Assessment 2: Economics for Managers - Market Structures Analysis

Verified

Added on  2020/02/24

|24
|4404
|34
Report
AI Summary
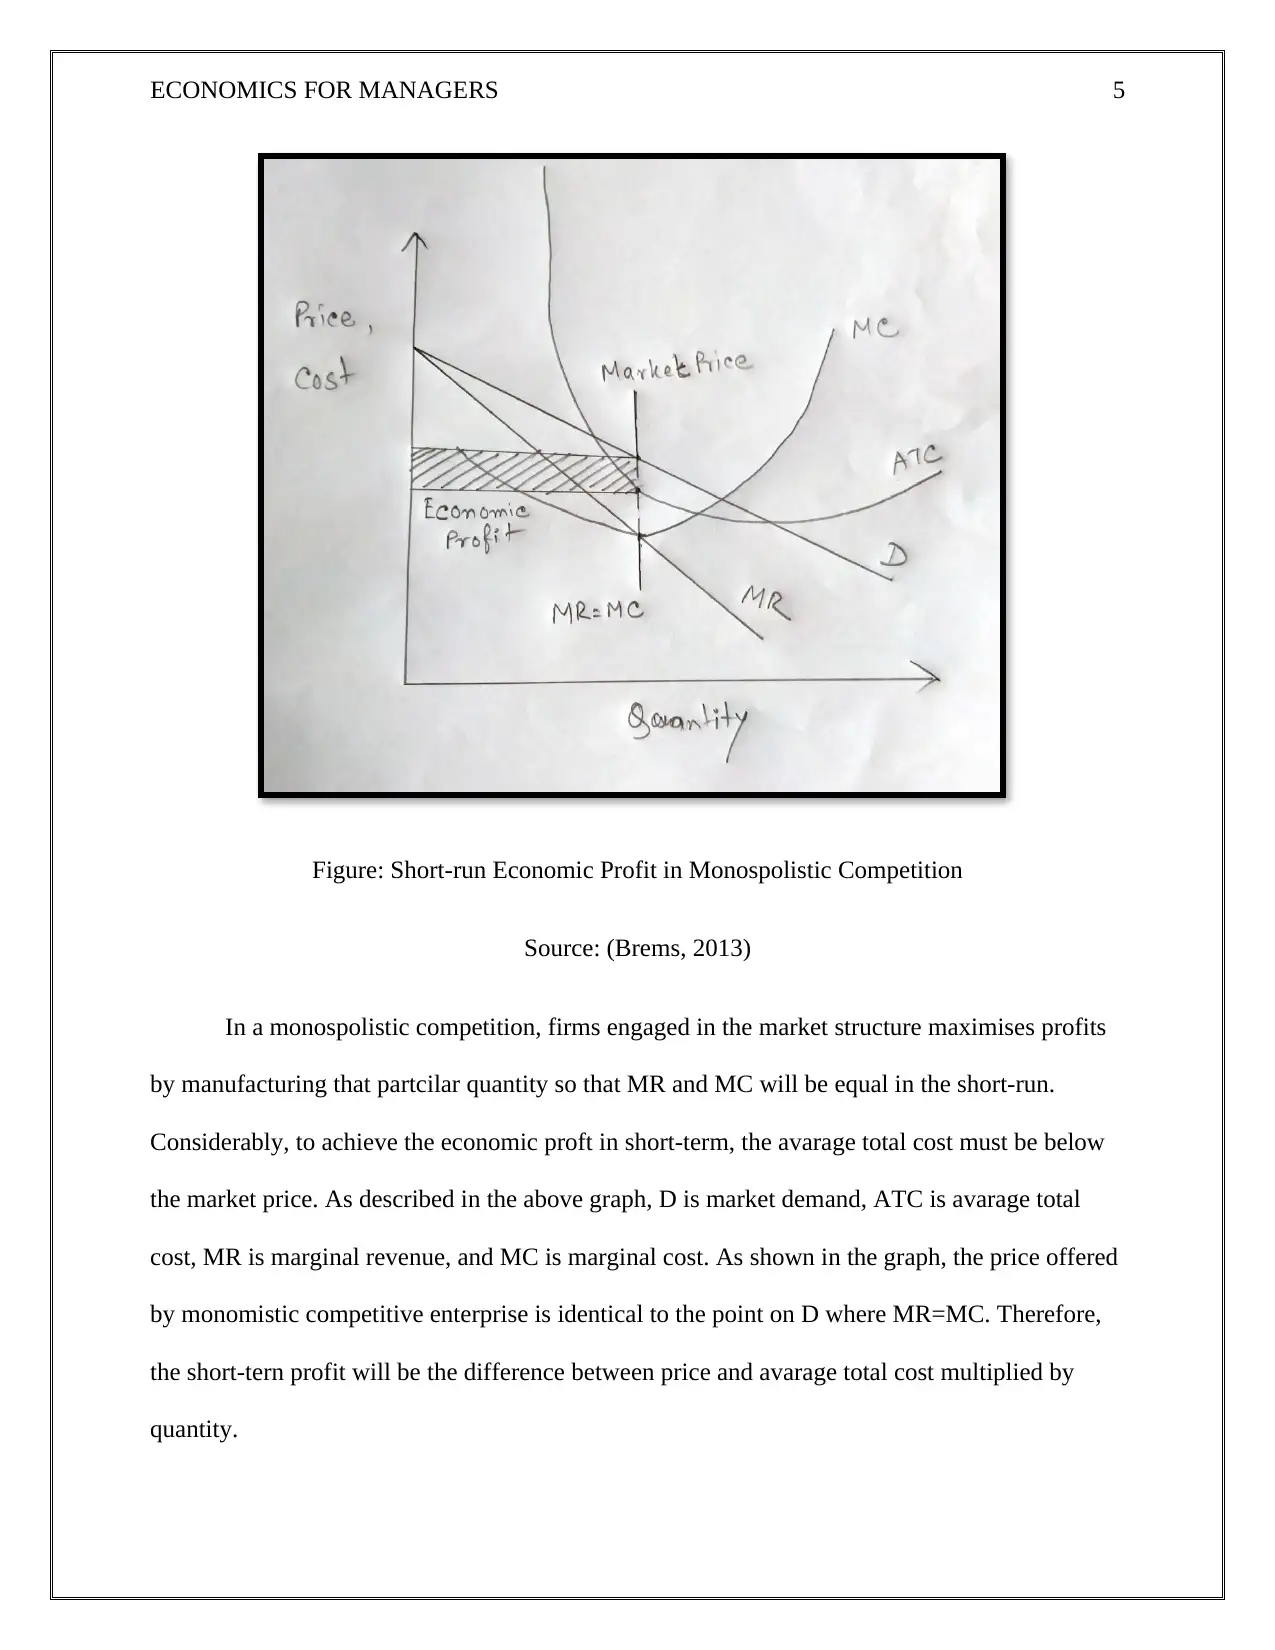
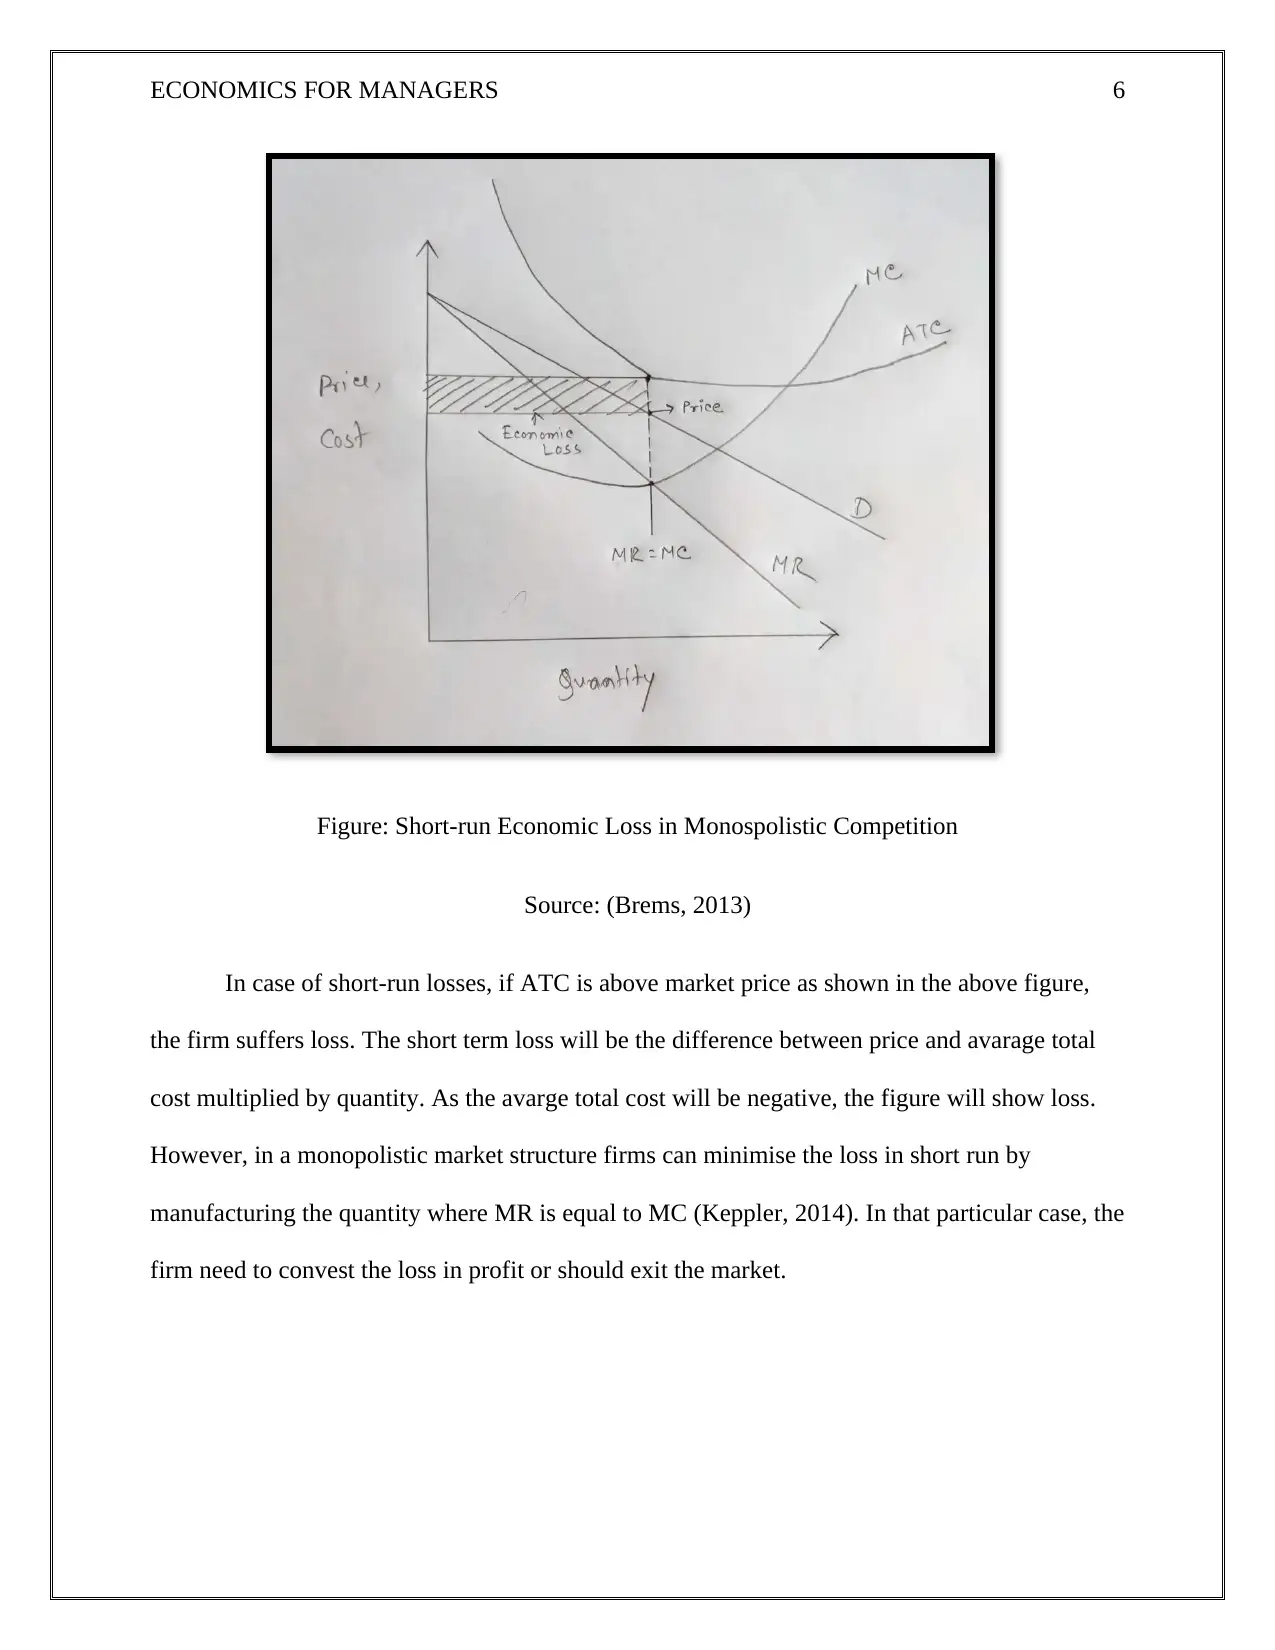
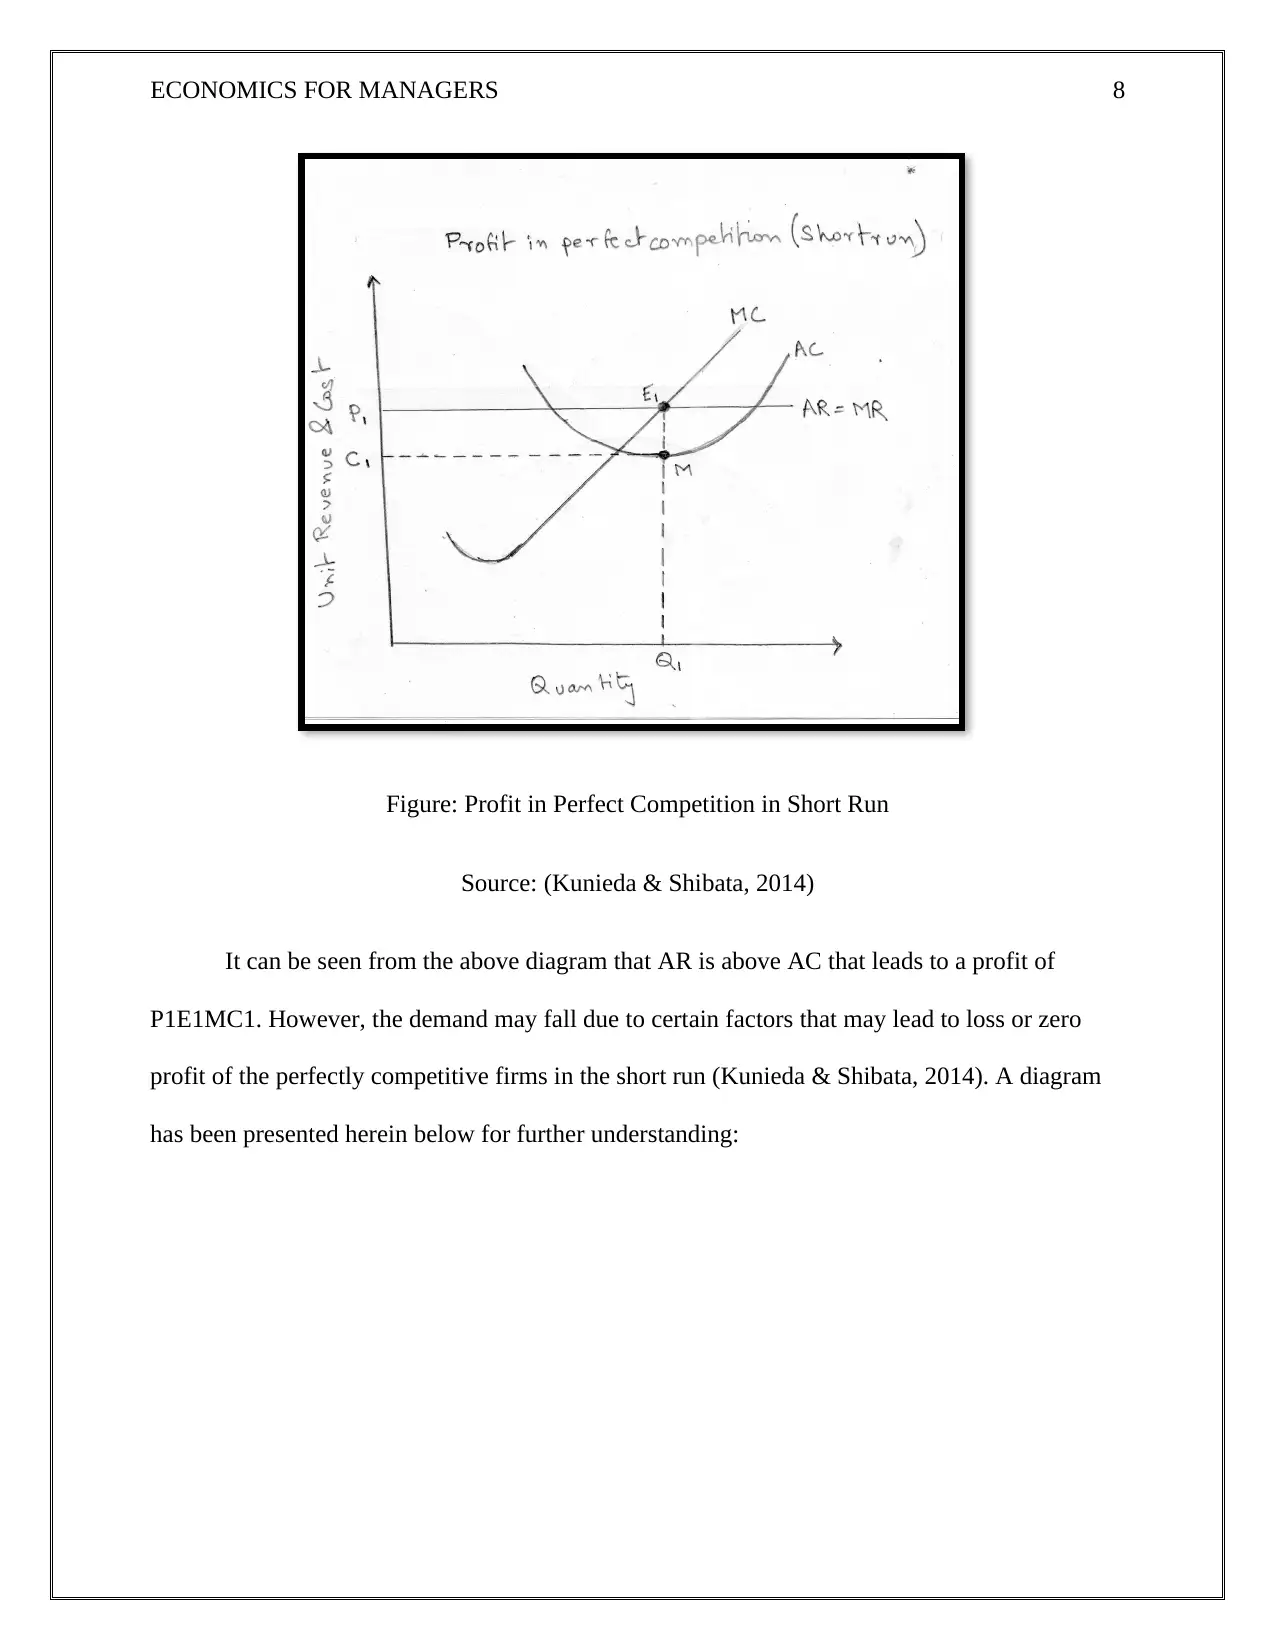
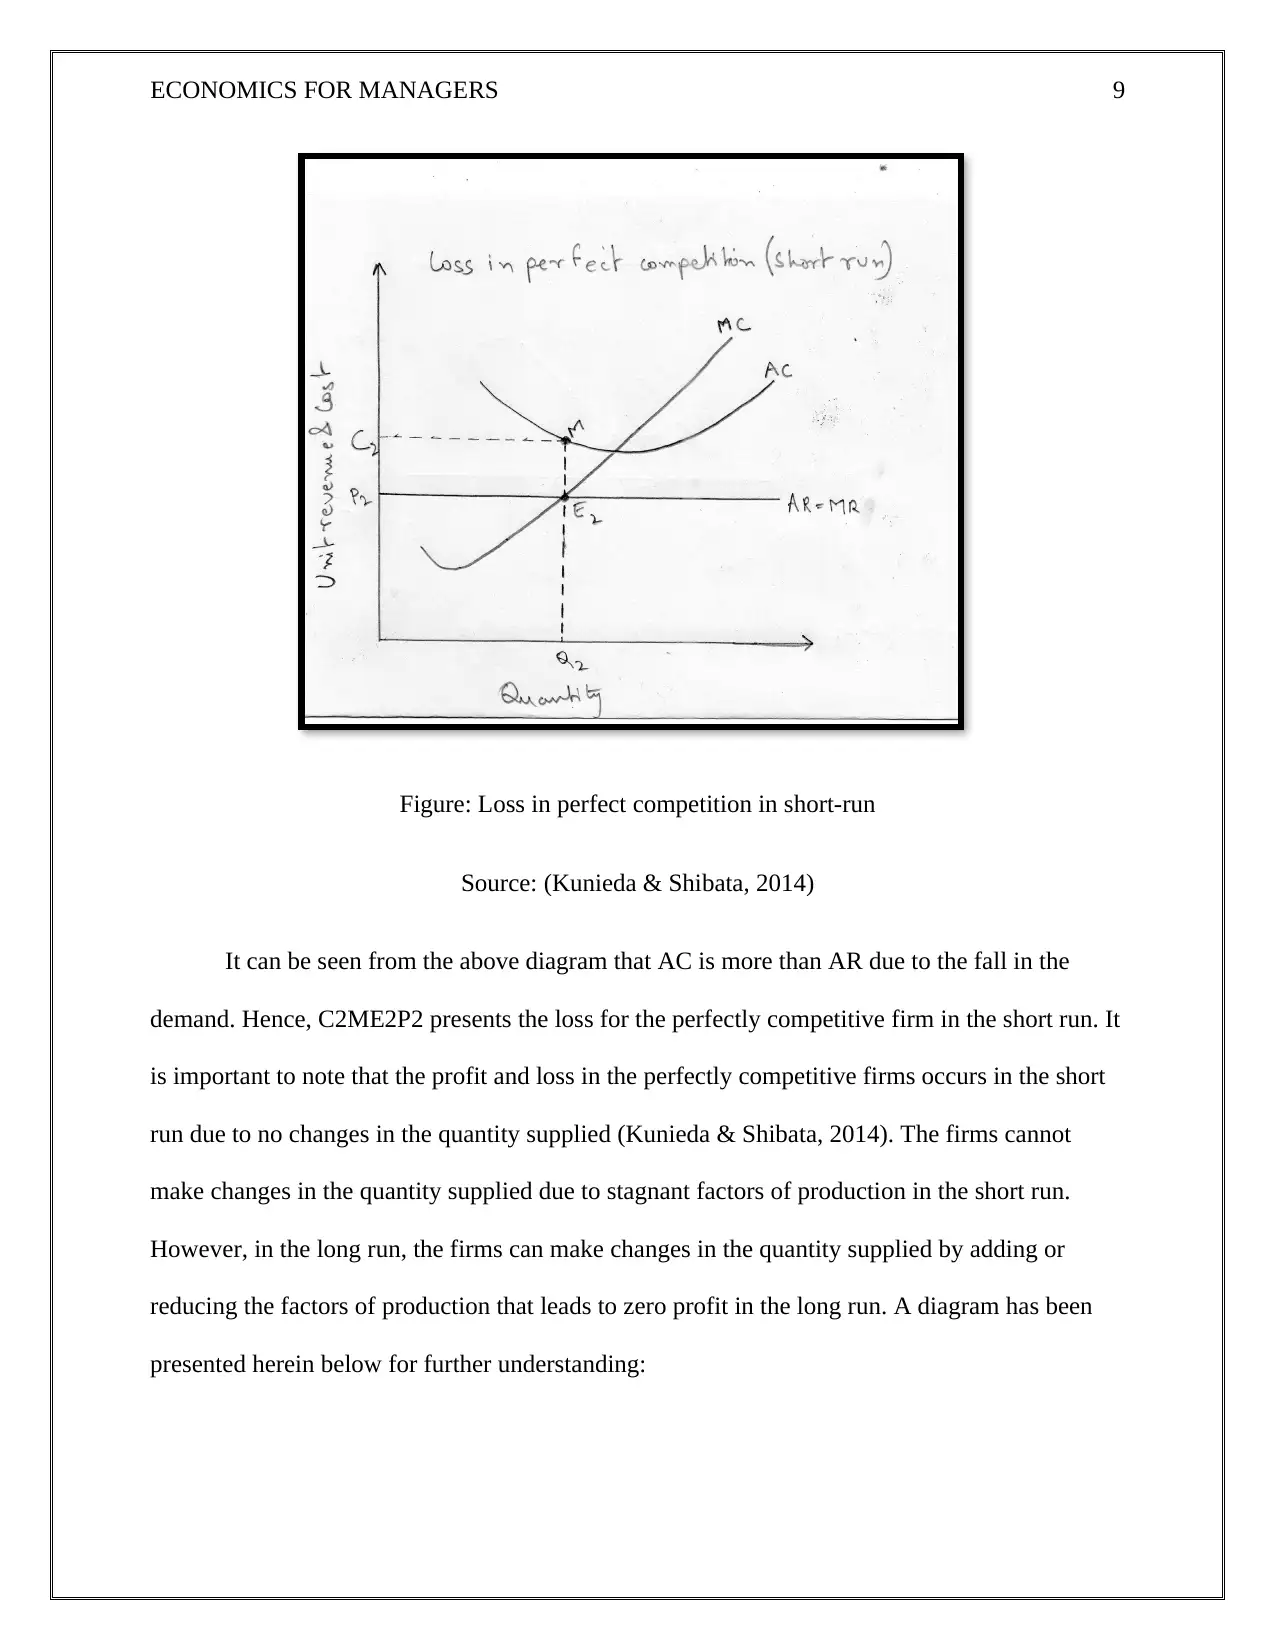
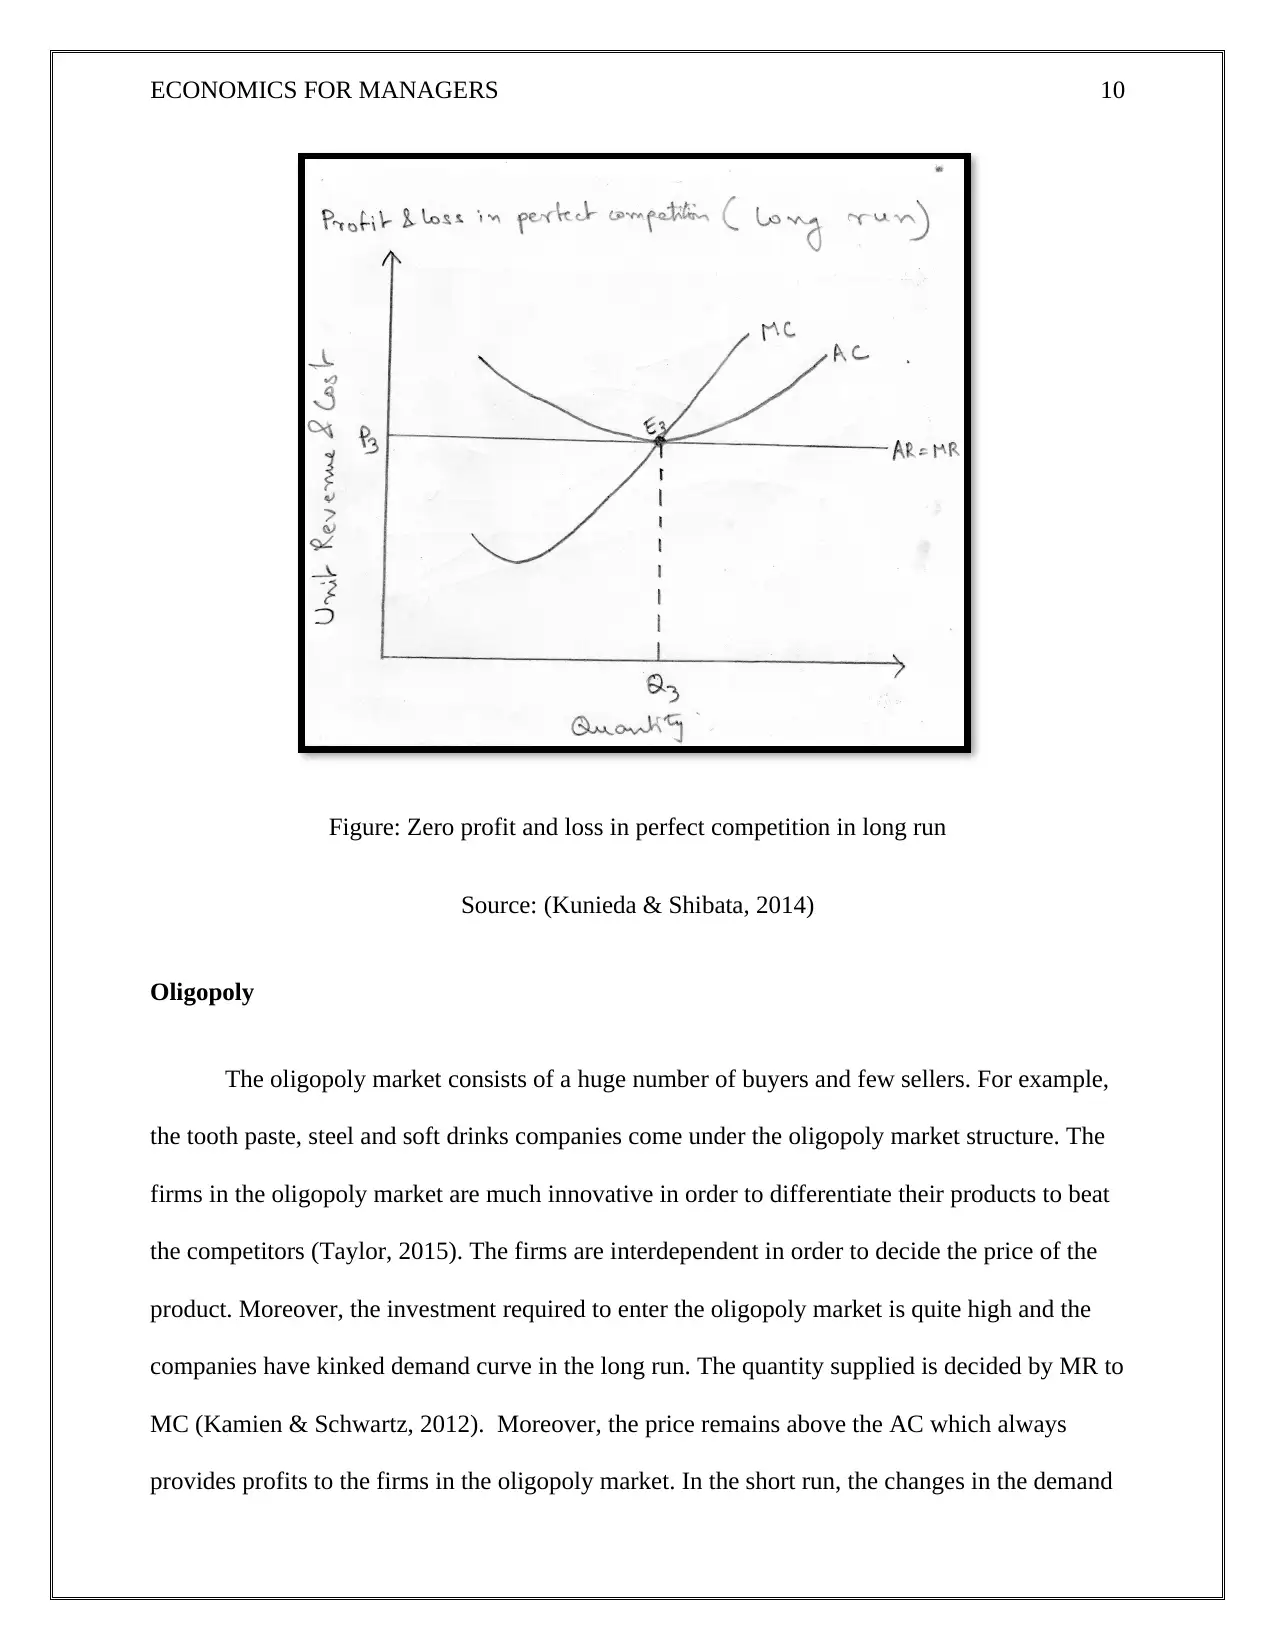
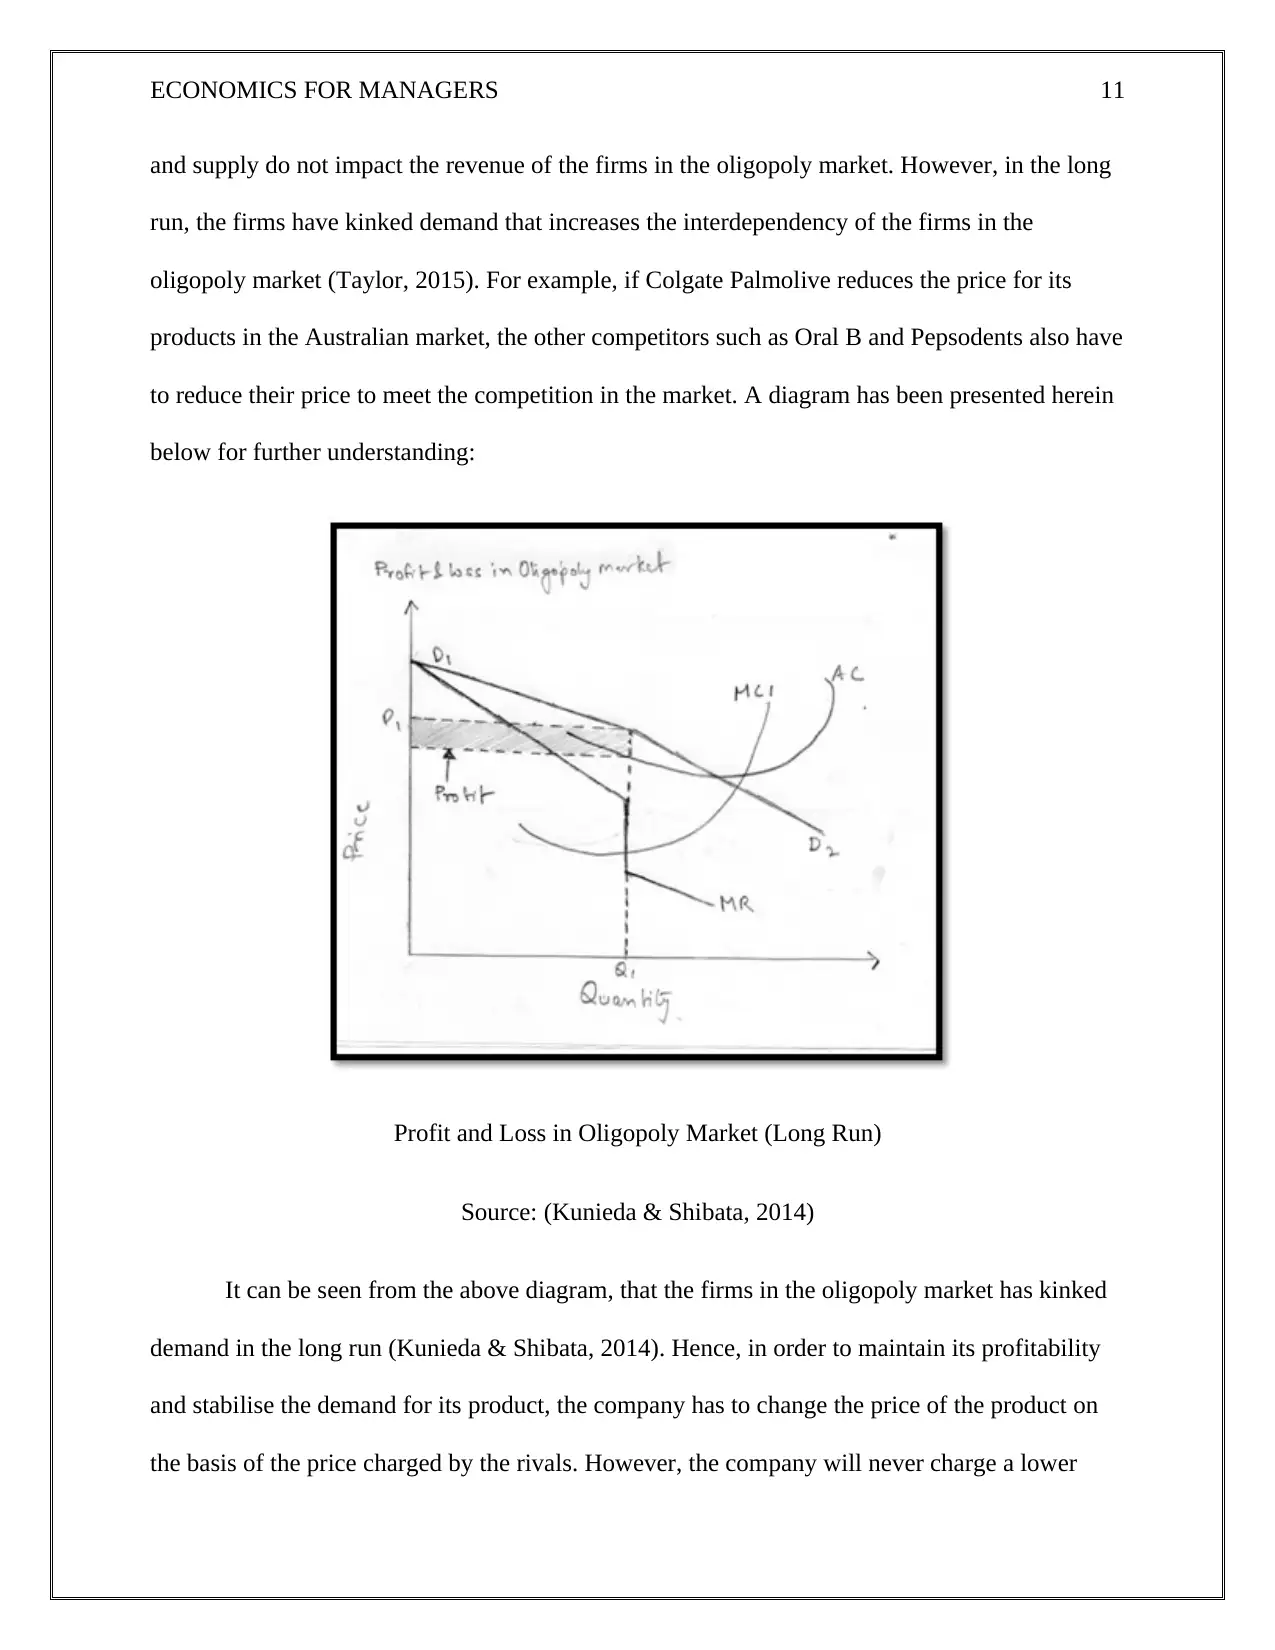
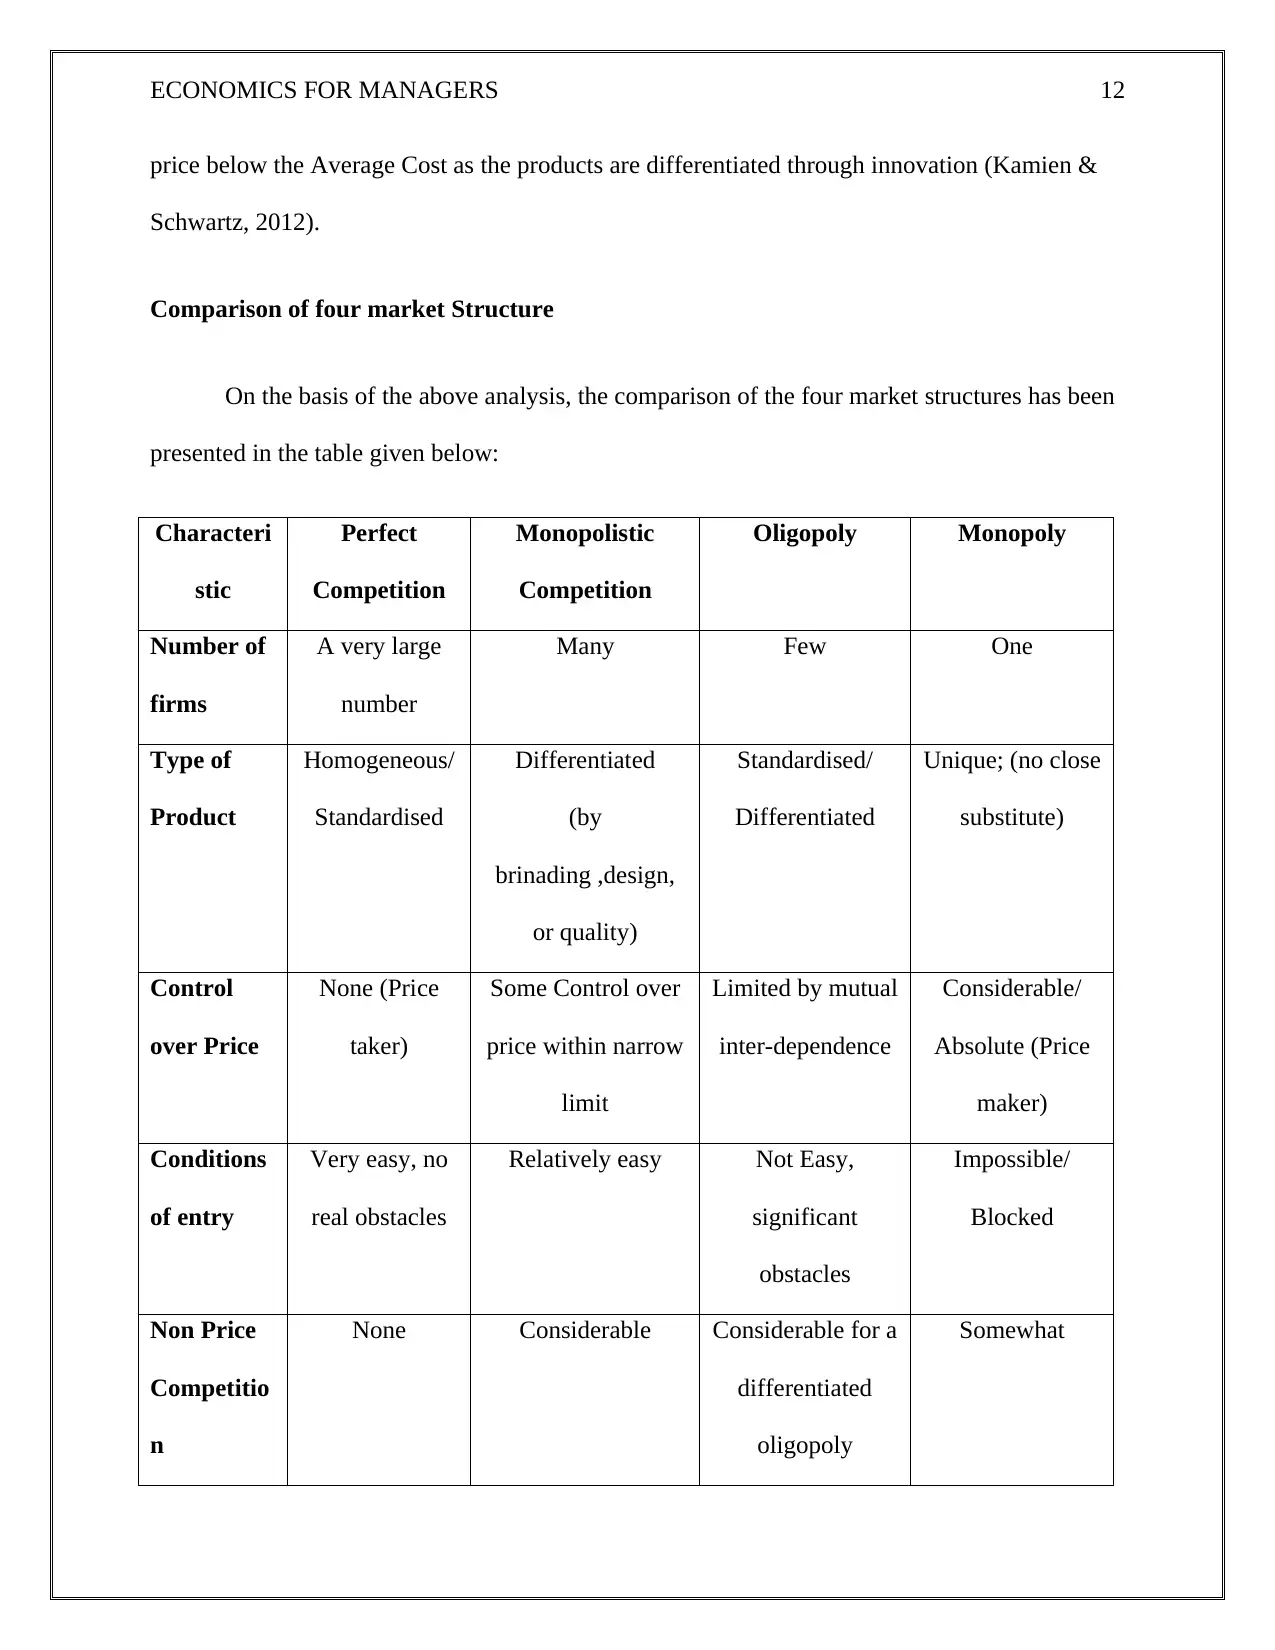
This report provides a comprehensive analysis of four market structures: monopoly, oligopoly, monopolistic competition, and perfect competition. It describes the key features of each market structure, including the number of firms, type of product, control over price, and conditions of entry. The report utilizes diagrams to illustrate short-run and long-run profits and losses in each market structure. Furthermore, it compares resource allocation across the four market types. The study also includes a brief description of negative externalities and uses a case study from Australia to demonstrate their impact and government interventions. Finally, the report investigates the effects of externalities on monopoly and perfectly competitive market outcomes, offering a detailed exploration of economic concepts and their real-world applications.
Document Page
Running Head: ECONOMICS FOR MANAGERS 1
Assessment 2: Research Essay
Following the guidelines of the course ID guidelines
Student’s Name
University
tabler-icon-diamond-filled.svg

Secure Best Marks with AI Grader

Need help grading? Try our AI Grader for instant feedback on your assignments.
Document Page
ECONOMICS FOR MANAGERS 2
Introduction
In the study essay, key features of four market structures i.e. monopoly, oligopoly,
monopolistic competition, and the perfectly competitive market have been described. Using
diagrams, the short run and long run profits and losses in the identified market structure is also
elaborated (O'Sullivan, 2009). Also, the allocation of resources in the four types of markets has
been compared. Furthermore, the study paper provides a brief description of negative
externalities using the diagram. Providing a case study from Australia, the impact and
government interventions have been identified to solve the problem of a negative externality.
Lastly, the study investigates the effect of externality on monopoly and perfectly competitive
market outcomes in the presence of negative externalities.
Question 1: Four Market Structure
Monopoly
In a monopoly market structure, a single manufacturer or seller has the control over the
market as no close substitute is available (Abdin, 2008). Therefore, the single firm is called
monopolistic. As the single supplier produces products having no close substitute, the
monopolistic firm can be termed as the price maker. In other characteristics, due to lack of close
substitutes and infrastructural assistance, entry to the market is restricted for new participators.
Non-price competition in monopoly market is somewhat in compared to other market structure
whereas the market structure is efficient in terms of productive efficiency (Carlton, 2012). The
identified market structure secures high profitability in the longer period of time. For instance,
rural gas station can be identified as a monopolistic firm as there are no other market competitors
Document Page
ECONOMICS FOR MANAGERS 3
(Baur, 2017). In the underlying figure, the long-term and short-term economic profits of
monopoly market structure have been illustrated as follows:
Figure: Monopoly Long-run and Short-run Economic Profit
Source: (Prescott, 2013)
In a monopoly market structure, super-normal profitability can be achieved in the long-
term. In case of profit maximisation, marginal cost must be equal to marginal revenue
considering the competition. In case of monopolistic market structure, competition is nil. As
shown in the figure, profit maximisation is achieved when MC=MR, where P is price and output
is Q. Given at a price AR is above ATC at point Q, PABC area can indicate the supernatural
Document Page
ECONOMICS FOR MANAGERS 4
profit (Prescott, 2013). Precisely, no presence of close substitute and competition, a monopolistic
firm can secure maximum profit at area PABC in the long run.
Monopolistic Competitive market
Monopolistic competitive market structure forms an imperferct competiton where many
producers have offfered products or services differentiated by brinading ,design, or quality.
Clearly, the offered products are not perfected substituables by each other (Brems, 2013). In a
monopolistic competiton, the number of competitors are many but not as high as perfect
competiton. In terms of control over the price, firms have got some control on prices whereas the
entry to the market is relatively easy (Feenstra, 2010). In the monopolistic competition,
production factors of manufactured goods/service are not absolutely transportable. Apparently, in
sich market structure, more elastic demand curve can be seen as the manufacturers reduce price
of goods/service to incresae sales. In the meanwhile, long-run profits for such market structure is
nil (Feenstra, 2016). Invariably, retail stores and coffee shop businesses are examples of real life
monopolistic competition. In the next section, the short-run economic profits and losses of
monopolistic competiton have been described.
tabler-icon-diamond-filled.svg

Secure Best Marks with AI Grader

Need help grading? Try our AI Grader for instant feedback on your assignments.
Document Page
ECONOMICS FOR MANAGERS 5
Figure: Short-run Economic Profit in Monospolistic Competition
Source: (Brems, 2013)
In a monospolistic competition, firms engaged in the market structure maximises profits
by manufacturing that partcilar quantity so that MR and MC will be equal in the short-run.
Considerably, to achieve the economic proft in short-term, the avarage total cost must be below
the market price. As described in the above graph, D is market demand, ATC is avarage total
cost, MR is marginal revenue, and MC is marginal cost. As shown in the graph, the price offered
by monomistic competitive enterprise is identical to the point on D where MR=MC. Therefore,
the short-tern profit will be the difference between price and avarage total cost multiplied by
quantity.
Document Page
ECONOMICS FOR MANAGERS 6
Figure: Short-run Economic Loss in Monospolistic Competition
Source: (Brems, 2013)
In case of short-run losses, if ATC is above market price as shown in the above figure,
the firm suffers loss. The short term loss will be the difference between price and avarage total
cost multiplied by quantity. As the avarge total cost will be negative, the figure will show loss.
However, in a monopolistic market structure firms can minimise the loss in short run by
manufacturing the quantity where MR is equal to MC (Keppler, 2014). In that particular case, the
firm need to convest the loss in profit or should exit the market.
Document Page
ECONOMICS FOR MANAGERS 7
Perfectly competitive market
Perfect or pure competition is rare in the real life scenario, but the model is essential in
analysing the industry that characterises similar to a perfect competition market. A perfectly
competitive market is characterised by a huge number of sellers that means the decision of a
single seller will not impact the price of the commodity in the market (Taylor, 2015).
Furthermore, the products and services in the perfectly competitive market are standardise and
homogenous in nature. Every product and service is a perfect substitute of the products and
services of the rival company (Carlton, 2012). Furthermore, the firms in the perfectly
competitive market are price takers and the decision of the price is made on the basis of the
market mechanism such as demand and supply of product. Moreover, there are not significant
barriers that may prevent a firm from leaving and entering the perfectly competitive industry
(Carlton, 2012). Some of the examples of perfectly competitive market are stock market industry
and agricultural industry because these industries have the same characteristics of a perfectly
competitive market.
In a perfectly competitive market, the demand curve is horizontal to the market price,
which is equal to average revenue and marginal revenue. Hence, in a perfectly competitive
market D = P = AR = MR. Moreover, the quantity is MC = MR (Carlton, 2012). Furthermore, in
the short run, rise in the demand leads to increase in the price that provides profit to the perfectly
competitive firms. A diagram has been presented herein below for further understanding:
tabler-icon-diamond-filled.svg

Paraphrase This Document

Need a fresh take? Get an instant paraphrase of this document with our AI Paraphraser
Document Page
ECONOMICS FOR MANAGERS 8
Figure: Profit in Perfect Competition in Short Run
Source: (Kunieda & Shibata, 2014)
It can be seen from the above diagram that AR is above AC that leads to a profit of
P1E1MC1. However, the demand may fall due to certain factors that may lead to loss or zero
profit of the perfectly competitive firms in the short run (Kunieda & Shibata, 2014). A diagram
has been presented herein below for further understanding:
Document Page
ECONOMICS FOR MANAGERS 9
Figure: Loss in perfect competition in short-run
Source: (Kunieda & Shibata, 2014)
It can be seen from the above diagram that AC is more than AR due to the fall in the
demand. Hence, C2ME2P2 presents the loss for the perfectly competitive firm in the short run. It
is important to note that the profit and loss in the perfectly competitive firms occurs in the short
run due to no changes in the quantity supplied (Kunieda & Shibata, 2014). The firms cannot
make changes in the quantity supplied due to stagnant factors of production in the short run.
However, in the long run, the firms can make changes in the quantity supplied by adding or
reducing the factors of production that leads to zero profit in the long run. A diagram has been
presented herein below for further understanding:
Document Page
ECONOMICS FOR MANAGERS 10
Figure: Zero profit and loss in perfect competition in long run
Source: (Kunieda & Shibata, 2014)
Oligopoly
The oligopoly market consists of a huge number of buyers and few sellers. For example,
the tooth paste, steel and soft drinks companies come under the oligopoly market structure. The
firms in the oligopoly market are much innovative in order to differentiate their products to beat
the competitors (Taylor, 2015). The firms are interdependent in order to decide the price of the
product. Moreover, the investment required to enter the oligopoly market is quite high and the
companies have kinked demand curve in the long run. The quantity supplied is decided by MR to
MC (Kamien & Schwartz, 2012). Moreover, the price remains above the AC which always
provides profits to the firms in the oligopoly market. In the short run, the changes in the demand
tabler-icon-diamond-filled.svg

Secure Best Marks with AI Grader

Need help grading? Try our AI Grader for instant feedback on your assignments.
Document Page
ECONOMICS FOR MANAGERS 11
and supply do not impact the revenue of the firms in the oligopoly market. However, in the long
run, the firms have kinked demand that increases the interdependency of the firms in the
oligopoly market (Taylor, 2015). For example, if Colgate Palmolive reduces the price for its
products in the Australian market, the other competitors such as Oral B and Pepsodents also have
to reduce their price to meet the competition in the market. A diagram has been presented herein
below for further understanding:
Profit and Loss in Oligopoly Market (Long Run)
Source: (Kunieda & Shibata, 2014)
It can be seen from the above diagram, that the firms in the oligopoly market has kinked
demand in the long run (Kunieda & Shibata, 2014). Hence, in order to maintain its profitability
and stabilise the demand for its product, the company has to change the price of the product on
the basis of the price charged by the rivals. However, the company will never charge a lower
Document Page
ECONOMICS FOR MANAGERS 12
price below the Average Cost as the products are differentiated through innovation (Kamien &
Schwartz, 2012).
Comparison of four market Structure
On the basis of the above analysis, the comparison of the four market structures has been
presented in the table given below:
Characteri
stic
Perfect
Competition
Monopolistic
Competition
Oligopoly Monopoly
Number of
firms
A very large
number
Many Few One
Type of
Product
Homogeneous/
Standardised
Differentiated
(by
brinading ,design,
or quality)
Standardised/
Differentiated
Unique; (no close
substitute)
Control
over Price
None (Price
taker)
Some Control over
price within narrow
limit
Limited by mutual
inter-dependence
Considerable/
Absolute (Price
maker)
Conditions
of entry
Very easy, no
real obstacles
Relatively easy Not Easy,
significant
obstacles
Impossible/
Blocked
Non Price
Competitio
n
None Considerable Considerable for a
differentiated
oligopoly
Somewhat
Document Page
ECONOMICS FOR MANAGERS 13
Productive
efficiency
Highly efficient Less Efficient Less Efficient Inefficient
Long run
profits
Nil Nil Positive High
Examples Agriculture and
stock market
Retails stores,
cosmetics, apparel
Tooth paste, Steel,
soft drinks
Local utilities,
rural gas station
Table: Comparison of Four Market Structures
Source: (Yomogida, 2010)
However, in terms of resource allocation it is important to note that how the firms in
different market structure use the allocated resources in order to produce the products and service
in respective market. In the case of perfectly competitive firm, it can be seen that the companies
earn normal profit in the long run. Hence, a fuller utilisation of resources can be evident in the
perfectly competitive market (Salvatore, 2011). On the other hand, in the monopoly market, the
firms produces relatively lesser amount of product to increase the demand and charge higher
price for the products and services to maximise profit (Sutton, 2015). Therefore, it can be seen
that monopolistic firms do not make fuller utilisation of the allocated resources.
Furthermore, in a monopolistic competitive market there are a huge number of buyers
and sellers, but the products are identical in nature (Slavin, 2014). The companies in the
monopolistic competitive market charge a higher price than the market price due to the
differentiated characteristics of the products. Hence, it can be seen that firms in monopolistic
competitive market do not product at their optimum level. In other words, the firms produce less
than the installed capacity (Salvatore, 2011). Furthermore, the same happens with the firms in
the oligopoly market. The interdependency characteristics of this market forces the oligopolistic
tabler-icon-diamond-filled.svg

Paraphrase This Document

Need a fresh take? Get an instant paraphrase of this document with our AI Paraphraser
Document Page
ECONOMICS FOR MANAGERS 14
firms to produce lesser amount as compared to their optimum level. However, to meet the
changing policies of the competitors the firms need to produce on the basis of the market demand
(Slavin, 2014). Therefore, it can be seen that oligopoly firms uses lesser resources as compared
to the perfectly competitive firms and more resources as compared to the monopolistic firms.
Document Page
ECONOMICS FOR MANAGERS 15
Question 2: Negative externalities
To identify the macroeconomic status of free market, understanding the negative
externalities associated with the market is a primary need. Negative externality is said to be
occurred when production or consumption of a goods can create harmful consequences to a third
party other than producers and consumers (Cho, 2013). Evidently, negative externalities can
impose external costs on the third party as well. Therefore, negative externalities can contribute
to a market failure as the social cost exceeds private costs in a given market. The receiver of
negative externalities can be any individual or organisation other than the manufacturer and
consumer of the goods. For instance, any type of pollution can impact the social population.
Therefore, it is addressed as a negative externality (Wang & Tan, 2017). In the study, negative
externality of production has been described using graphical representation as follows:
Figure: Negative Externality of Production
Document Page
ECONOMICS FOR MANAGERS 16
Source: (Sunderasan, 2012)
A negative externality that has taken place due to production or manufacturing of a
product affecting the third party other than the producer and consumers in a harmful way, can be
defined as negative externality of production. For example, burning of fossil fuel e.g. coal, oil,
and LNG to produce electricity can contribute to air pollution. Clearly, air pollution during the
production of electricity can create a harmful effect on the social population. As depicted in the
above figure, Q1 can be identified as the production output where the demand status and supply
status is equal. At Q1 position, the social marginal cost (SMC) is significantly higher than that of
social marginal benefit (SMB) showing socially inefficiency (Sunderasan, 2012). At point Q2,
SMC is equal to SMB notifying social efficiency at the point. The marked section in the figure is
called deadweight welfare loss because the SMC is greater than PMC i.e. private marginal cost.
Case Study
Emission of green house gas has become one of the leading challenges for Australia
according to the data released by the Australian government. Hannam (2017) reviewed in the
article stating that the carbon emission in the country has been continue to increase as the data
released by the National Greenhouse Gas Inventory discloses that carbon emission in the country
increased by 1.6% in the March quarter, biggest change in terms of quarterly increase in the
previous nine years. The Australian carbon emission has reached 550.4 million tonne annually
up by 1% in compared to the last year. Since the Coalition government has taken the charge,
carbon emission in the country was up by 6% in compared to a decline of 10% during Labour
government (Hannam, 2017).
tabler-icon-diamond-filled.svg

Secure Best Marks with AI Grader

Need help grading? Try our AI Grader for instant feedback on your assignments.
Document Page
ECONOMICS FOR MANAGERS 17
Each of the data indicates how coal-powered energy sector and major industries have
contributed towards increasing carbon emission affecting the social population. Clearly, the
increase rate of carbon emission refers to the environment policy framework implemented by the
Coalition government. According to the analysis, being a negative externality, pollution has
affected the economy as well. Due to the increase in greenhouse gas, the social cost exceeds
private costs. In the underlying figure, carbon emission trend in Australia has been represented as
below:
Figure: Quarterly Carbon emission trend in Australia (2007-2017)
Source: (Hannam, 2017)
As described in the above mentioned figure, since March quarter in 2013, the carbon
emission trend is continuously increasing. Due to negative externalities such as pollution,
government interventions are mandatory to correct the market failure due to the event (Hannam,
2017). Evidently, according to the economists, internalise exterior costs and benefits must be
Document Page
ECONOMICS FOR MANAGERS 18
taken into account to avoid the sustainable impact of negative externalities. In Australia, the
mining, oil and gas, and coal-powered electricity production sectors can be identified as the
major contributors to greenhouse gas emission. In order to reduce the amount of pollution, one of
the most common approaches is pollution tax i.e. the government should force polluters to pay
massive charges for creating negative externalities.
In the meanwhile, negative externalities create adverse effect on the health of social
people increasing social costs to that of private costs. Herein, introducing carbon tax will help to
increase the private cost of production or/and consumption. Therefore, the rise in the private cost
should reduce the quantity demanded as well as the output of the product causing negative
externalities. In this way, government directed carbon tax can negate the adverse effect of
negative externalities hurting the economic conditions.
Effect of externality on monopoly and perfectly competitive market
Firstly, it is important to understand the impact of externalities over the monopoly and
perfectly competitive market in order to know which market structure is socially beneficial
(Arellano, 2007). Moreover, the social marginal cost for a perfectly competitive firm will be
always higher than the private marginal cost in case of emission of carbon in the air that causes
negative externalities (air pollution) (Gilman, 2016). Furthermore, a perfectly competitive firm
will produce more than the socially optimal level at Qp in order to meet the high level of
competition in the market and earn normal profit in the long run (O'Sullivan, 2009). A diagram
has been presented herein below for further understanding:
Document Page
ECONOMICS FOR MANAGERS 19
Figure: Externality in Perfectly Competitive firm
Source: (Sunderasan, 2012)
It can be seen from the above diagram that a perfectly competitive firm will produce at
Qp that will lead to negative externalities and deadweight welfare loss marked with the shaded
section (Wang & Tan, 2017). However, in the case of a monopoly firm it is important to note
that the output will always be lower than the socially optimum level of output to maximise the
profit. In other words, the output level for the monopoly firms will be at S = PMC = MR (Carl,
2012). A figure has been given below for better understanding:
tabler-icon-diamond-filled.svg

Paraphrase This Document

Need a fresh take? Get an instant paraphrase of this document with our AI Paraphraser
Document Page
ECONOMICS FOR MANAGERS 20
Figure: Externality in Monopoly firm
Source: (Sunderasan, 2012)
By utilising the formula of welfare, it can be seen from the above figure that the welfare
at socially optimal price level is “A + B + C + D + E + F + G + H” and the welfare at monopoly
price level is “A + B + C + D + F + G”. Hence, the deadweight welfare loss for monopoly firms
is “E + H” that are presented with the shaded portion (Wang & Tan, 2017).
By considering both the market structures, it can be seen that perfectly competitive
market makes fuller utilisation of resources and produces higher quantity of products as
compared to monopoly market firms (Martin, 2016). It can be seen that the deadweight loss
occurring from the negative externalities will be higher in the case of perfectly competitive
market as compared to monopolistic market (Wang & Tan, 2017). Hence, monopoly market is
Document Page
ECONOMICS FOR MANAGERS 21
socially preferred market structure over the perfectly competitive market with the occurrence of
negative externalities.
Conclusion
By considering the above analysis, it can be seen that all four market structures differs
from one another on the basis of number of sellers, similarities between the products, barriers of
entry and exit, decision making of price and several other factors. The comparison made on the
basis of allocation of resources, it can be seen that firms in the perfectly competitive market are
found to use the available resources to its optimal level. However, other market structures do not
present optimum utilisation of resources due to their profit maximisation, product differentiation
and interdependency characteristics. Moreover, the negative externalities caused by the
operations of the firms in different market structure leads to welfare loss. Hence, it is the role of
the government to take care of the social cost that is incurred by the operations of the firms
causing negative externalities. Finally, the research concludes by presenting that monopoly
market is socially preferred market structure over the perfectly competitive market with the
occurrence of negative externalities due to the production of output below the socially optimum
level.
Document Page
ECONOMICS FOR MANAGERS 22
References
Abdin, M. (2008). Hidden Monopoly in the Free Market. SSRN Electronic Journal.
Arellano, F. (2007). Forecasting Profits in the Short Run: Using a More Reliable Profit Margin
Ratio. SSRN Electronic Journal.
Baur, D. (2017). 'Monopoly' in Real Life - The Housing Market and Inequality. SSRN Electronic
Journal.
Brems, H. (2013). Product equilibrium under monopolistic competition (3rd ed.). Cambridge:
Harvard Univ Press.
Carl, S. (2012). Market Structure. Delhi: Orange Apple.
Carlton, D. (2012). Planning and Market Structure (5th ed.). Cambridge, Mass.: National Bureau
of Economic Research.
Cho, M. (2013). Externality and information asymmetry in the production of local public
goods. International Journal Of Economic Theory, 9(2), 177-201.
Feenstra, R. (2010). Measuring the gains from trade under monopolistic competition. Canadian
Journal Of Economics/Revue Canadienne D'économique, 43(1), 1-28.
http://dx.doi.org/10.1111/j.1540-5982.2009.01577.x
Feenstra, R. (2016). Gains from Trade Under Monopolistic Competition. Pacific Economic
Review, 21(1), 35-44.
Gilman, L. (2016). Economics. Minneapolis: Lerner Publications.
tabler-icon-diamond-filled.svg

Secure Best Marks with AI Grader

Need help grading? Try our AI Grader for instant feedback on your assignments.
Document Page
ECONOMICS FOR MANAGERS 23
Hannam, P. (2017). Australia's carbon pollution soars, government data shows. The Sydney
Morning Herald. Retrieved August 2017, from
http://www.smh.com.au/environment/climate-change/australias-carbon-pollution-soars-
government-data-shows-20170804-gxpd71.html
Kamien, M., & Schwartz, N. (2012). Market structure and innovation (7th ed.). Cambridge:
Cambridge University Press.
Keppler, J. (2014). Monopolistic competition theory (5th ed.). Baltimore: Johns Hopkins
University Press.
Kunieda, T., & Shibata, A. (2014). Credit Market Imperfections and Macroeconomic
Instability. Pacific Economic Review, 19(5), 592-611.
Martin, R. (2016). Externality regulation and the monopoly firm. Journal Of Public
Economics, 29(3), 347-362.
O'Sullivan, A. (2009). Urban economics (3rd ed.). Boston: McGraw-Hill/Irwin.
Prescott, E. (2013). Market structure and monopoly profits: A dynamic theory. Journal Of
Economic Theory, 6(6), 546-557.
Rozeff, M. (2009). Stiglitz, Externality and Government. SSRN Electronic Journal.
Salvatore, D. (2011). Microeconomics. New York: McGraw Hill.
Slavin, S. (2014). Microeconomics. New York, NY: McGraw-Hill Education.
Sunderasan, S. (2012). Externality (2nd ed.). New York: Nova Publishers.
Sutton, J. (2015). Technology and Market Structure. Cambridge: MIT Press.
Document Page
ECONOMICS FOR MANAGERS 24
Taylor, T. (2015). Economics. Chantilly, Va.: Teaching Co.
Wang, Y., & Tan, D. (2017). The Influence of Product Market Externality on Dynamic
Decisions of Monopoly. Modern Economy, 8(6), 806-815.
Yomogida, M. (2010). Fragmentation and Welfare in Monopolistic Competition. Review Of
International Economics, 18(3), 531-539.
chevron_up_icon
1 out of 24
circle_padding
hide_on_mobile
zoom_out_icon
logo.png

Your All-in-One AI-Powered Toolkit for Academic Success.

Available 24*7 on WhatsApp / Email

[object Object]