Marketing and Communication Report: Competitor Analysis and Strategies
VerifiedAdded on 2020/04/21
|16
|3067
|56
Report
AI Summary
This report encompasses a comprehensive analysis of marketing and communication strategies, market share dynamics, and competitive landscapes. The report begins with an examination of the direct marketing code of practice, focusing on the principles established by ADMA, followed by an analysis of competitor pricing for a home theatre system. Further, it delves into the market share of XYZ Widget Co., examining trends in high-end widgets, low-end and mid-level market trends, and the impact of advertising. Descriptive statistics and visual representations, including time series analysis, are used to illustrate market trends and predict future market shares. Finally, the report concludes with a comparative analysis of the Australian College of Specialist Make-up, its competitors, and the factors contributing to its success, utilizing both qualitative and quantitative data. The report utilizes data from various sources, including competitor pricing, market share data, and college websites to provide a comprehensive overview of the marketing and competitive environments.

Marketing and Communication 1
MARKETING AND COMMUNICATION
Name
Course Number
Date
Faculty Name
MARKETING AND COMMUNICATION
Name
Course Number
Date
Faculty Name
Paraphrase This Document
Need a fresh take? Get an instant paraphrase of this document with our AI Paraphraser
Marketing and Communication 2
Marketing and Communication
Task 1: Direct marketing code of practice (ADMA, 2015)
The Association for Data-driven Marketing & Advertising (ADMA) has outlined seven key
features that should be adhered to for direct marketing. The key responsibility for ADMA is to set
acceptable standards that are to be followed by the stakeholders their direct beneficiaries for the
purposes of future growth. Code of principles is one of the focuses of ADMA alongside ethical &
regulatory considerations, rules, resources and outcomes. The 7 core principles that have been
developed by ADMA are discussed below.
The consumer is put first, through protection and empowerment. This is the main principle
which benchmarks all the others. Based on these principles, the members are advised and
encouraged to reach out to the customers, which is not one on of the approaches based on
the regulatory requirements. ADMA believe that respecting the customers increases the
probability of influencing their purchasing decisions, hence favouring their underlying
products and services. The expected outcomes after following and respecting the principles
include compliance and confidence for the consumers, commercial growth and business
focus.
The second principle emphasizes the use of data as a basis for marketing and
advertisements. This principle directs the businesses to responsibly collect, use, store and
maintain data based on the regulatory rules. Also, the marketers/businesses are urged to
avoid engaging in marketing strategies that are exploitative and intrusive to the consumer
needs. A disclaimer has been developed by ADMA to let the companies take personal
responsibilities for any actions. There are rules that should be adhered to base on the
responsible use of data with respect to advertisements and marketing. Among the rules
Marketing and Communication 3
include compliance with the rules and regulatory provisions that are related to the data
handling processes. It the obligation of the members to ensures sensitive handling of the
data to maintain integrity and privacy of the information. All integrity issues that might arise
from using data for marketing and advertising should be handled effectively to avoid hurting
and misleading the customers.
Customers should have the choice to make informed decisions on whether or not to provide
their personal information. This indicates that all information obtained from the customers
should be out of their willingness. The members have the obligations should provide a
Value Exchange to the customers to persuade their adherence in giving personal
information.
The members have an obligation of using the collected customer data fairly without
selection and intimidation. The customers have the right to efficient, prompt and courteous
services to their customers. As a concern for promoting fairness, all the arising concerns and
queries should be addressed effectively.
Transparency is also another concern about how the information should be gathered from
the customers. Every move concerning the collection and use of the information should
open up to the customers. As a way of protecting the customers, they should be informed
every detail concerning the data being collected and how the data will be used.
Honesty: - the companies and members are obligated to honesty towards their customers. In
this manner, they should always honour their promises, hence avoiding any misleading
engagements. Therefore, any actions and decisions that can create a negative public view of
the data-driven marketing focus should be avoided.
⊘ This is a preview!⊘
Do you want full access?
Subscribe today to unlock all pages.
Trusted by 1+ million students worldwide
Marketing and Communication 4
Finally, the members and companies attached to ADMA should value the security and
safety of the information acquired from the customers. In cases where the data is no longer
useful to the company, it should be de-identified to avoid its connection to the customers,
which lead to information leakages.
Task 2: Competitor price for a home theatre system
mean= ∑ xi
n
¿ $ 56,385
30
¿ $ 1,879.50
Standard deviation= √ ∑ ( x−μ)2
n
¿ √ 16,525,299.5
30
¿ $ 742.1882
Paraphrase This Document
Need a fresh take? Get an instant paraphrase of this document with our AI Paraphraser
Marketing and Communication 5
1000 1200 1400 1600 1800 2000 2200 2400 2600 2800 3000 3200 3400 3600
0
1
2
3
4
5
6
7
8
Histogram of Competitor Price
Frequency
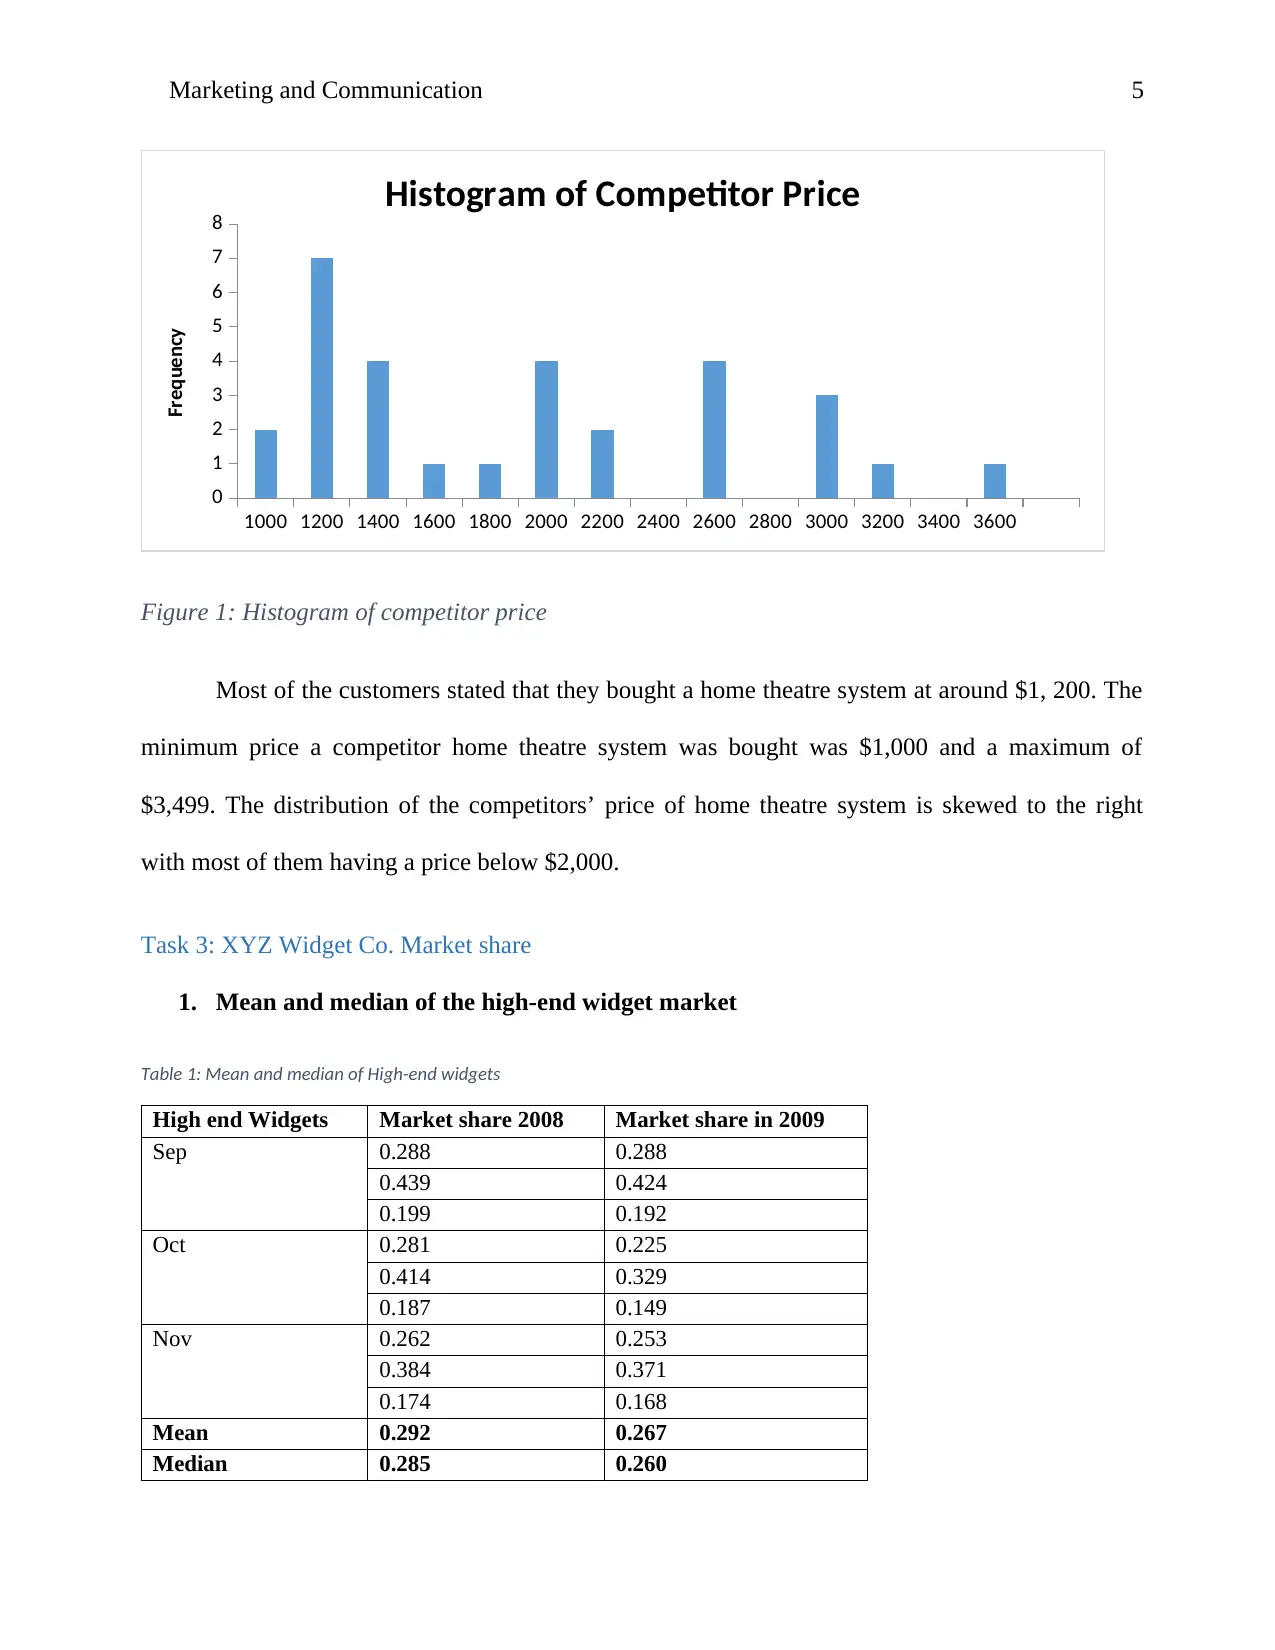
Figure 1: Histogram of competitor price
Most of the customers stated that they bought a home theatre system at around $1, 200. The
minimum price a competitor home theatre system was bought was $1,000 and a maximum of
$3,499. The distribution of the competitors’ price of home theatre system is skewed to the right
with most of them having a price below $2,000.
Task 3: XYZ Widget Co. Market share
1. Mean and median of the high-end widget market
Table 1: Mean and median of High-end widgets
High end Widgets Market share 2008 Market share in 2009
Sep 0.288 0.288
0.439 0.424
0.199 0.192
Oct 0.281 0.225
0.414 0.329
0.187 0.149
Nov 0.262 0.253
0.384 0.371
0.174 0.168
Mean 0.292 0.267
Median 0.285 0.260
1000 1200 1400 1600 1800 2000 2200 2400 2600 2800 3000 3200 3400 3600
0
1
2
3
4
5
6
7
8
Histogram of Competitor Price
Frequency
Figure 1: Histogram of competitor price
Most of the customers stated that they bought a home theatre system at around $1, 200. The
minimum price a competitor home theatre system was bought was $1,000 and a maximum of
$3,499. The distribution of the competitors’ price of home theatre system is skewed to the right
with most of them having a price below $2,000.
Task 3: XYZ Widget Co. Market share
1. Mean and median of the high-end widget market
Table 1: Mean and median of High-end widgets
High end Widgets Market share 2008 Market share in 2009
Sep 0.288 0.288
0.439 0.424
0.199 0.192
Oct 0.281 0.225
0.414 0.329
0.187 0.149
Nov 0.262 0.253
0.384 0.371
0.174 0.168
Mean 0.292 0.267
Median 0.285 0.260
Marketing and Communication 6
2. Time series analysis
a. Has widget market share increased between September 2008 and 2009
1 2 3 4 5 6 7 8 9 10 11 12 13 14 15 16 17 18 19 20 21 22 23 24 25 26 27 28 29 30 31 32 33
0.000
0.050
0.100
0.150
0.200
0.250
0.300
0.350
0.400
0.450
0.500
Market Share for September 2008 and 2009
Market Share Sep-08 Market Share Sep-09
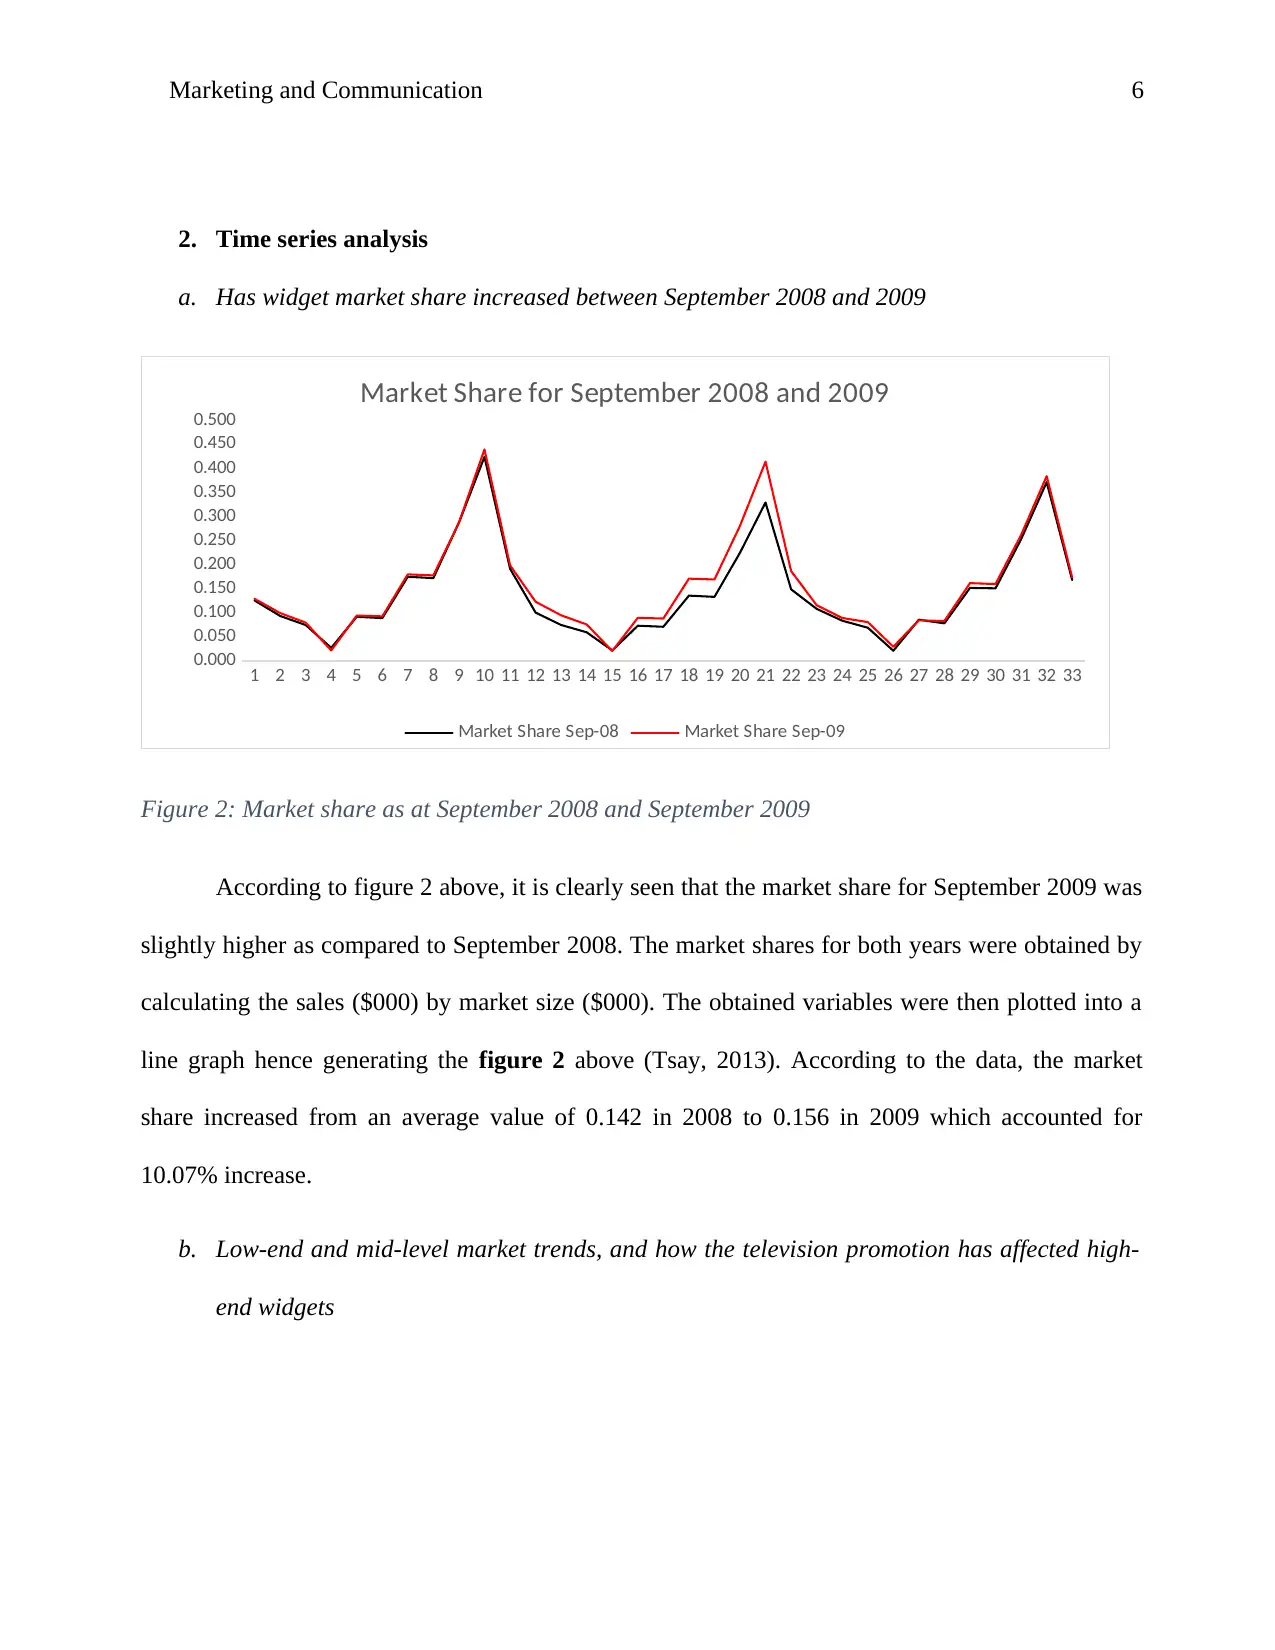
Figure 2: Market share as at September 2008 and September 2009
According to figure 2 above, it is clearly seen that the market share for September 2009 was
slightly higher as compared to September 2008. The market shares for both years were obtained by
calculating the sales ($000) by market size ($000). The obtained variables were then plotted into a
line graph hence generating the figure 2 above (Tsay, 2013). According to the data, the market
share increased from an average value of 0.142 in 2008 to 0.156 in 2009 which accounted for
10.07% increase.
b. Low-end and mid-level market trends, and how the television promotion has affected high-
end widgets
2. Time series analysis
a. Has widget market share increased between September 2008 and 2009
1 2 3 4 5 6 7 8 9 10 11 12 13 14 15 16 17 18 19 20 21 22 23 24 25 26 27 28 29 30 31 32 33
0.000
0.050
0.100
0.150
0.200
0.250
0.300
0.350
0.400
0.450
0.500
Market Share for September 2008 and 2009
Market Share Sep-08 Market Share Sep-09
Figure 2: Market share as at September 2008 and September 2009
According to figure 2 above, it is clearly seen that the market share for September 2009 was
slightly higher as compared to September 2008. The market shares for both years were obtained by
calculating the sales ($000) by market size ($000). The obtained variables were then plotted into a
line graph hence generating the figure 2 above (Tsay, 2013). According to the data, the market
share increased from an average value of 0.142 in 2008 to 0.156 in 2009 which accounted for
10.07% increase.
b. Low-end and mid-level market trends, and how the television promotion has affected high-
end widgets
⊘ This is a preview!⊘
Do you want full access?
Subscribe today to unlock all pages.
Trusted by 1+ million students worldwide
Marketing and Communication 7
Sep Oct Nov
0.000
0.020
0.040
0.060
0.080
0.100
0.120
0.140
0.160
0.180
0.200
Low-end and Mid-level Markets
Low-end widget Markets Mid-level widget markets
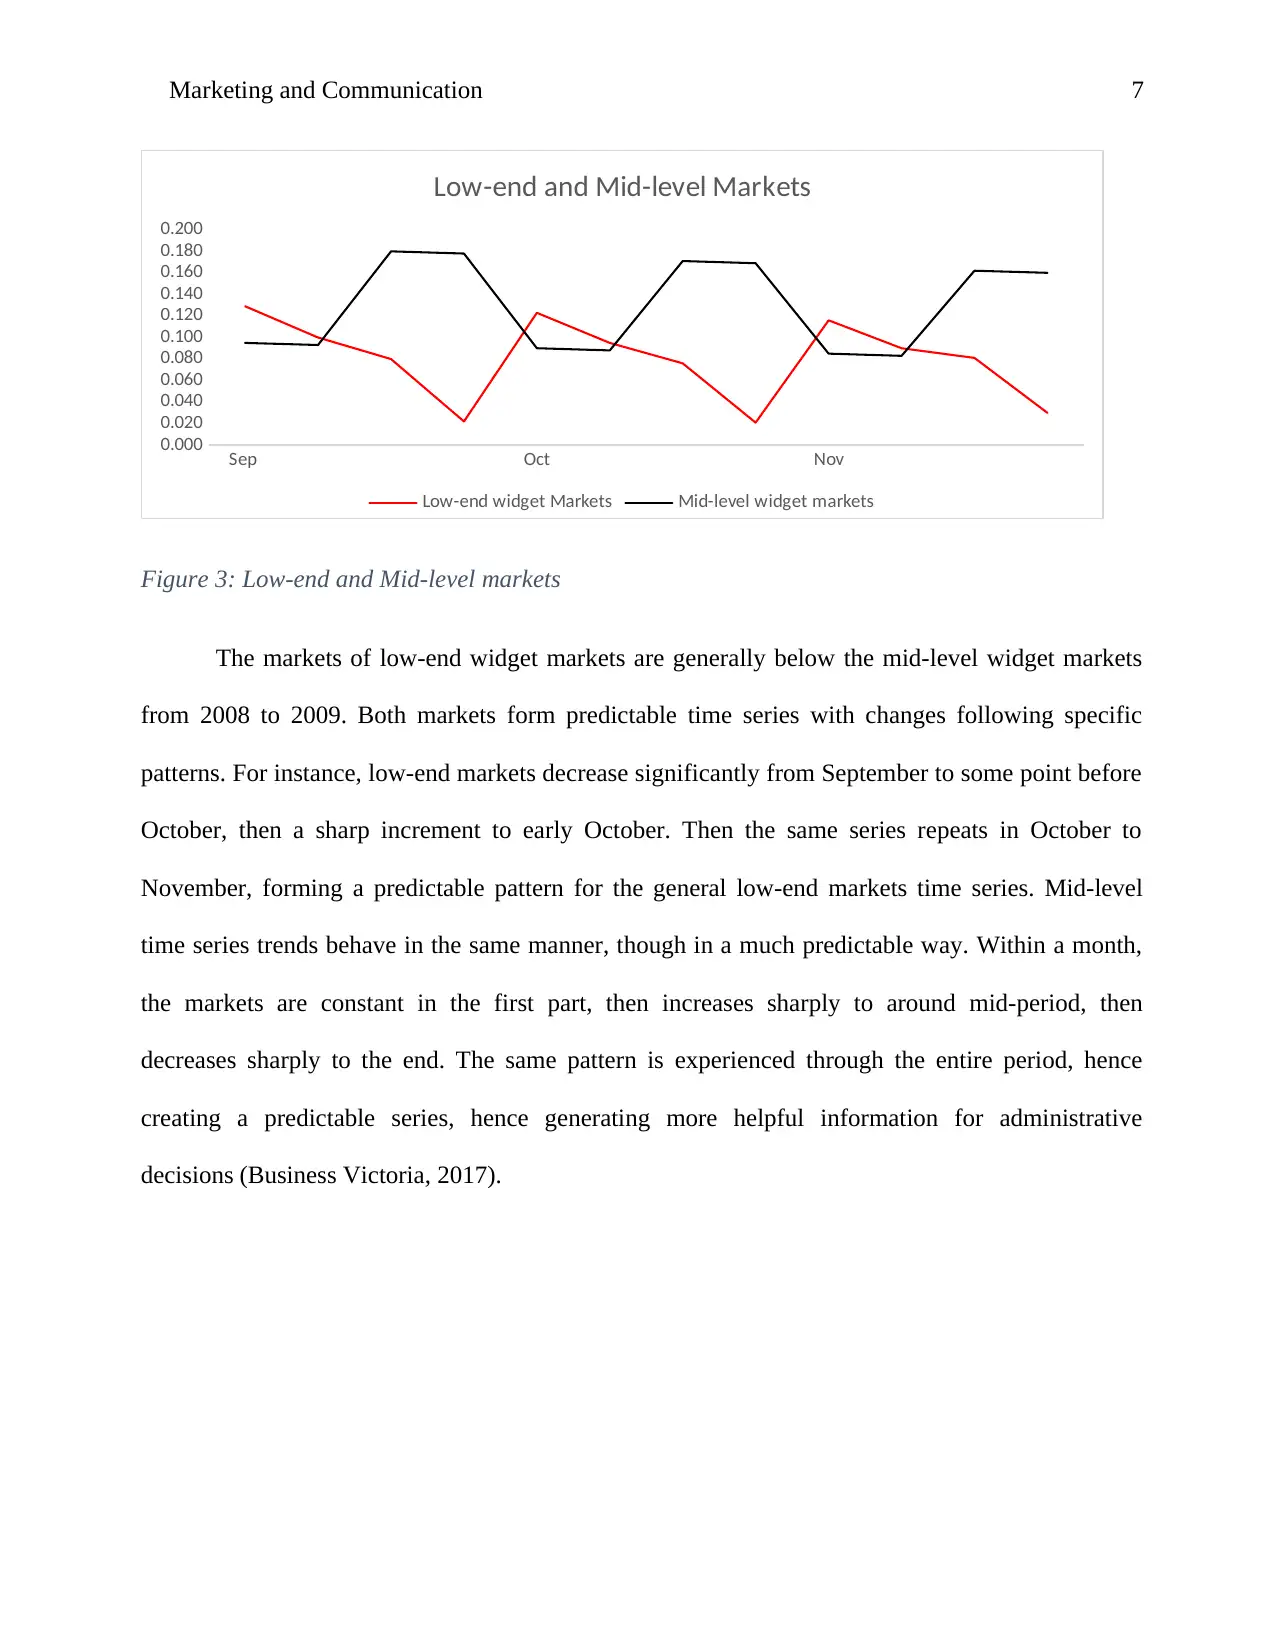
Figure 3: Low-end and Mid-level markets
The markets of low-end widget markets are generally below the mid-level widget markets
from 2008 to 2009. Both markets form predictable time series with changes following specific
patterns. For instance, low-end markets decrease significantly from September to some point before
October, then a sharp increment to early October. Then the same series repeats in October to
November, forming a predictable pattern for the general low-end markets time series. Mid-level
time series trends behave in the same manner, though in a much predictable way. Within a month,
the markets are constant in the first part, then increases sharply to around mid-period, then
decreases sharply to the end. The same pattern is experienced through the entire period, hence
creating a predictable series, hence generating more helpful information for administrative
decisions (Business Victoria, 2017).
Sep Oct Nov
0.000
0.020
0.040
0.060
0.080
0.100
0.120
0.140
0.160
0.180
0.200
Low-end and Mid-level Markets
Low-end widget Markets Mid-level widget markets
Figure 3: Low-end and Mid-level markets
The markets of low-end widget markets are generally below the mid-level widget markets
from 2008 to 2009. Both markets form predictable time series with changes following specific
patterns. For instance, low-end markets decrease significantly from September to some point before
October, then a sharp increment to early October. Then the same series repeats in October to
November, forming a predictable pattern for the general low-end markets time series. Mid-level
time series trends behave in the same manner, though in a much predictable way. Within a month,
the markets are constant in the first part, then increases sharply to around mid-period, then
decreases sharply to the end. The same pattern is experienced through the entire period, hence
creating a predictable series, hence generating more helpful information for administrative
decisions (Business Victoria, 2017).
Paraphrase This Document
Need a fresh take? Get an instant paraphrase of this document with our AI Paraphraser
Marketing and Communication 8
Sep Oct Nov
50
100
150
200
250
High-end widget sales ($000)
2009 2008 Average
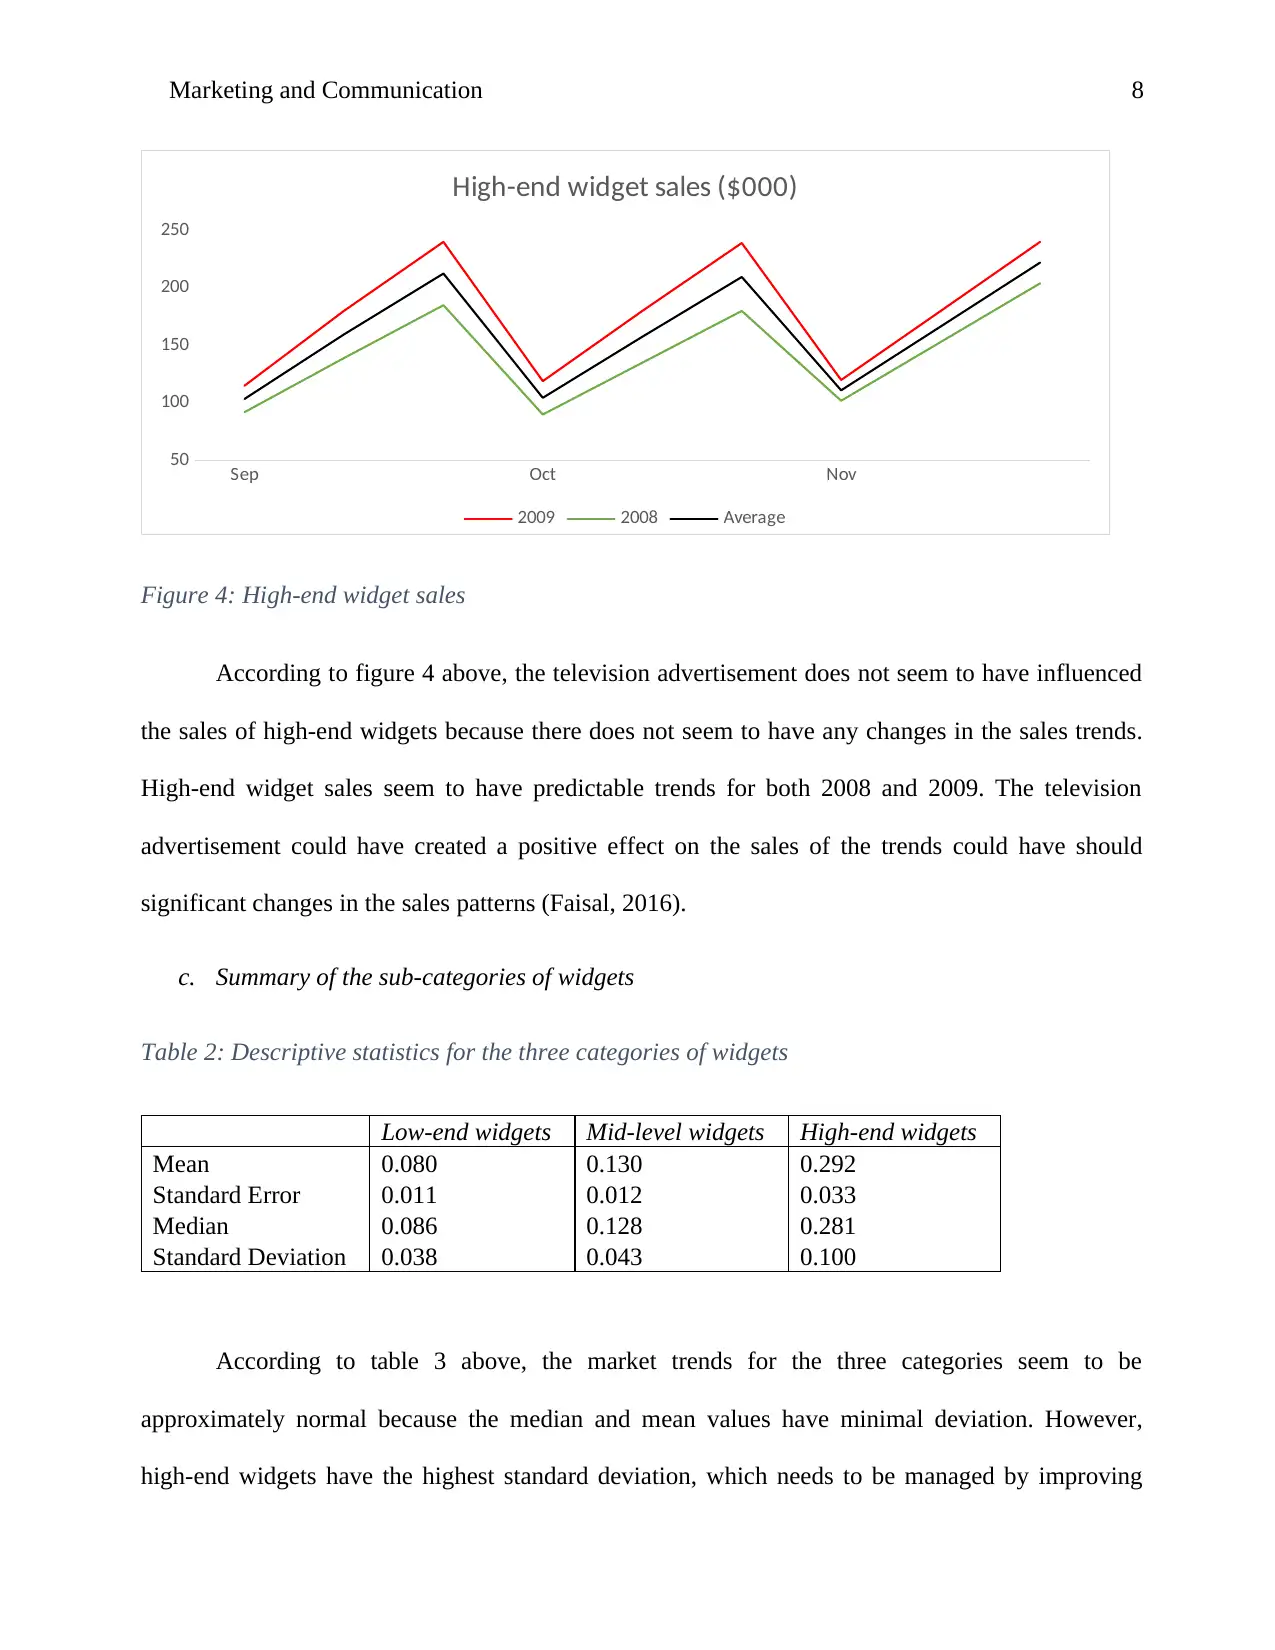
Figure 4: High-end widget sales
According to figure 4 above, the television advertisement does not seem to have influenced
the sales of high-end widgets because there does not seem to have any changes in the sales trends.
High-end widget sales seem to have predictable trends for both 2008 and 2009. The television
advertisement could have created a positive effect on the sales of the trends could have should
significant changes in the sales patterns (Faisal, 2016).
c. Summary of the sub-categories of widgets
Table 2: Descriptive statistics for the three categories of widgets
Low-end widgets Mid-level widgets High-end widgets
Mean 0.080 0.130 0.292
Standard Error 0.011 0.012 0.033
Median 0.086 0.128 0.281
Standard Deviation 0.038 0.043 0.100
According to table 3 above, the market trends for the three categories seem to be
approximately normal because the median and mean values have minimal deviation. However,
high-end widgets have the highest standard deviation, which needs to be managed by improving
Sep Oct Nov
50
100
150
200
250
High-end widget sales ($000)
2009 2008 Average
Figure 4: High-end widget sales
According to figure 4 above, the television advertisement does not seem to have influenced
the sales of high-end widgets because there does not seem to have any changes in the sales trends.
High-end widget sales seem to have predictable trends for both 2008 and 2009. The television
advertisement could have created a positive effect on the sales of the trends could have should
significant changes in the sales patterns (Faisal, 2016).
c. Summary of the sub-categories of widgets
Table 2: Descriptive statistics for the three categories of widgets
Low-end widgets Mid-level widgets High-end widgets
Mean 0.080 0.130 0.292
Standard Error 0.011 0.012 0.033
Median 0.086 0.128 0.281
Standard Deviation 0.038 0.043 0.100
According to table 3 above, the market trends for the three categories seem to be
approximately normal because the median and mean values have minimal deviation. However,
high-end widgets have the highest standard deviation, which needs to be managed by improving
Marketing and Communication 9
their marketing strategies to normalize the sales patterns. Based on the range statistic, low-end
widgets have a larger variation compared to mid-level widgets. Proper marketing strategies can also
be helpful in improving the sales distribution. According to the line graph below, all the three
categories experience seasonal effects on their market trends which can be smoothened by
performing more organized marketing and advertisement strategies across all potential customers
(Ryan, 2014).
d. Visual representation
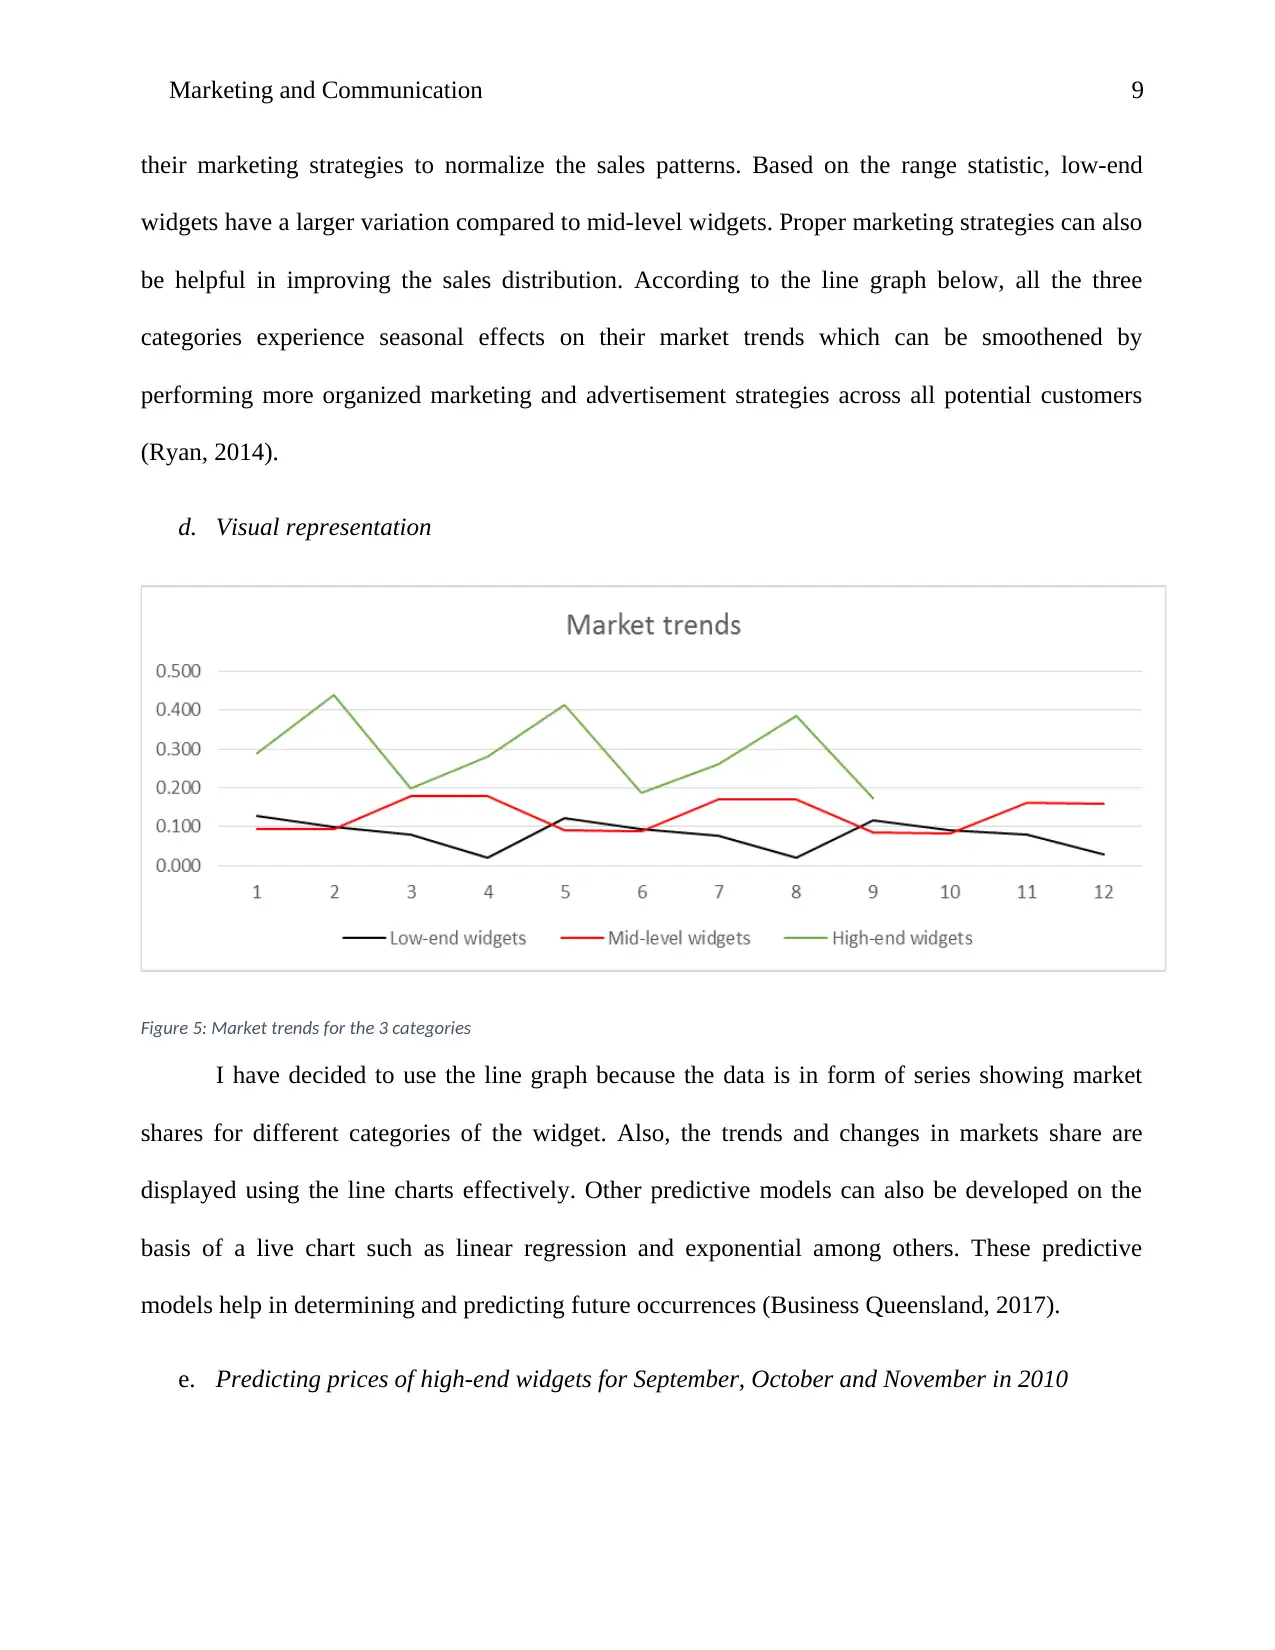
Figure 5: Market trends for the 3 categories
I have decided to use the line graph because the data is in form of series showing market
shares for different categories of the widget. Also, the trends and changes in markets share are
displayed using the line charts effectively. Other predictive models can also be developed on the
basis of a live chart such as linear regression and exponential among others. These predictive
models help in determining and predicting future occurrences (Business Queensland, 2017).
e. Predicting prices of high-end widgets for September, October and November in 2010
their marketing strategies to normalize the sales patterns. Based on the range statistic, low-end
widgets have a larger variation compared to mid-level widgets. Proper marketing strategies can also
be helpful in improving the sales distribution. According to the line graph below, all the three
categories experience seasonal effects on their market trends which can be smoothened by
performing more organized marketing and advertisement strategies across all potential customers
(Ryan, 2014).
d. Visual representation
Figure 5: Market trends for the 3 categories
I have decided to use the line graph because the data is in form of series showing market
shares for different categories of the widget. Also, the trends and changes in markets share are
displayed using the line charts effectively. Other predictive models can also be developed on the
basis of a live chart such as linear regression and exponential among others. These predictive
models help in determining and predicting future occurrences (Business Queensland, 2017).
e. Predicting prices of high-end widgets for September, October and November in 2010
⊘ This is a preview!⊘
Do you want full access?
Subscribe today to unlock all pages.
Trusted by 1+ million students worldwide
Marketing and Communication 10
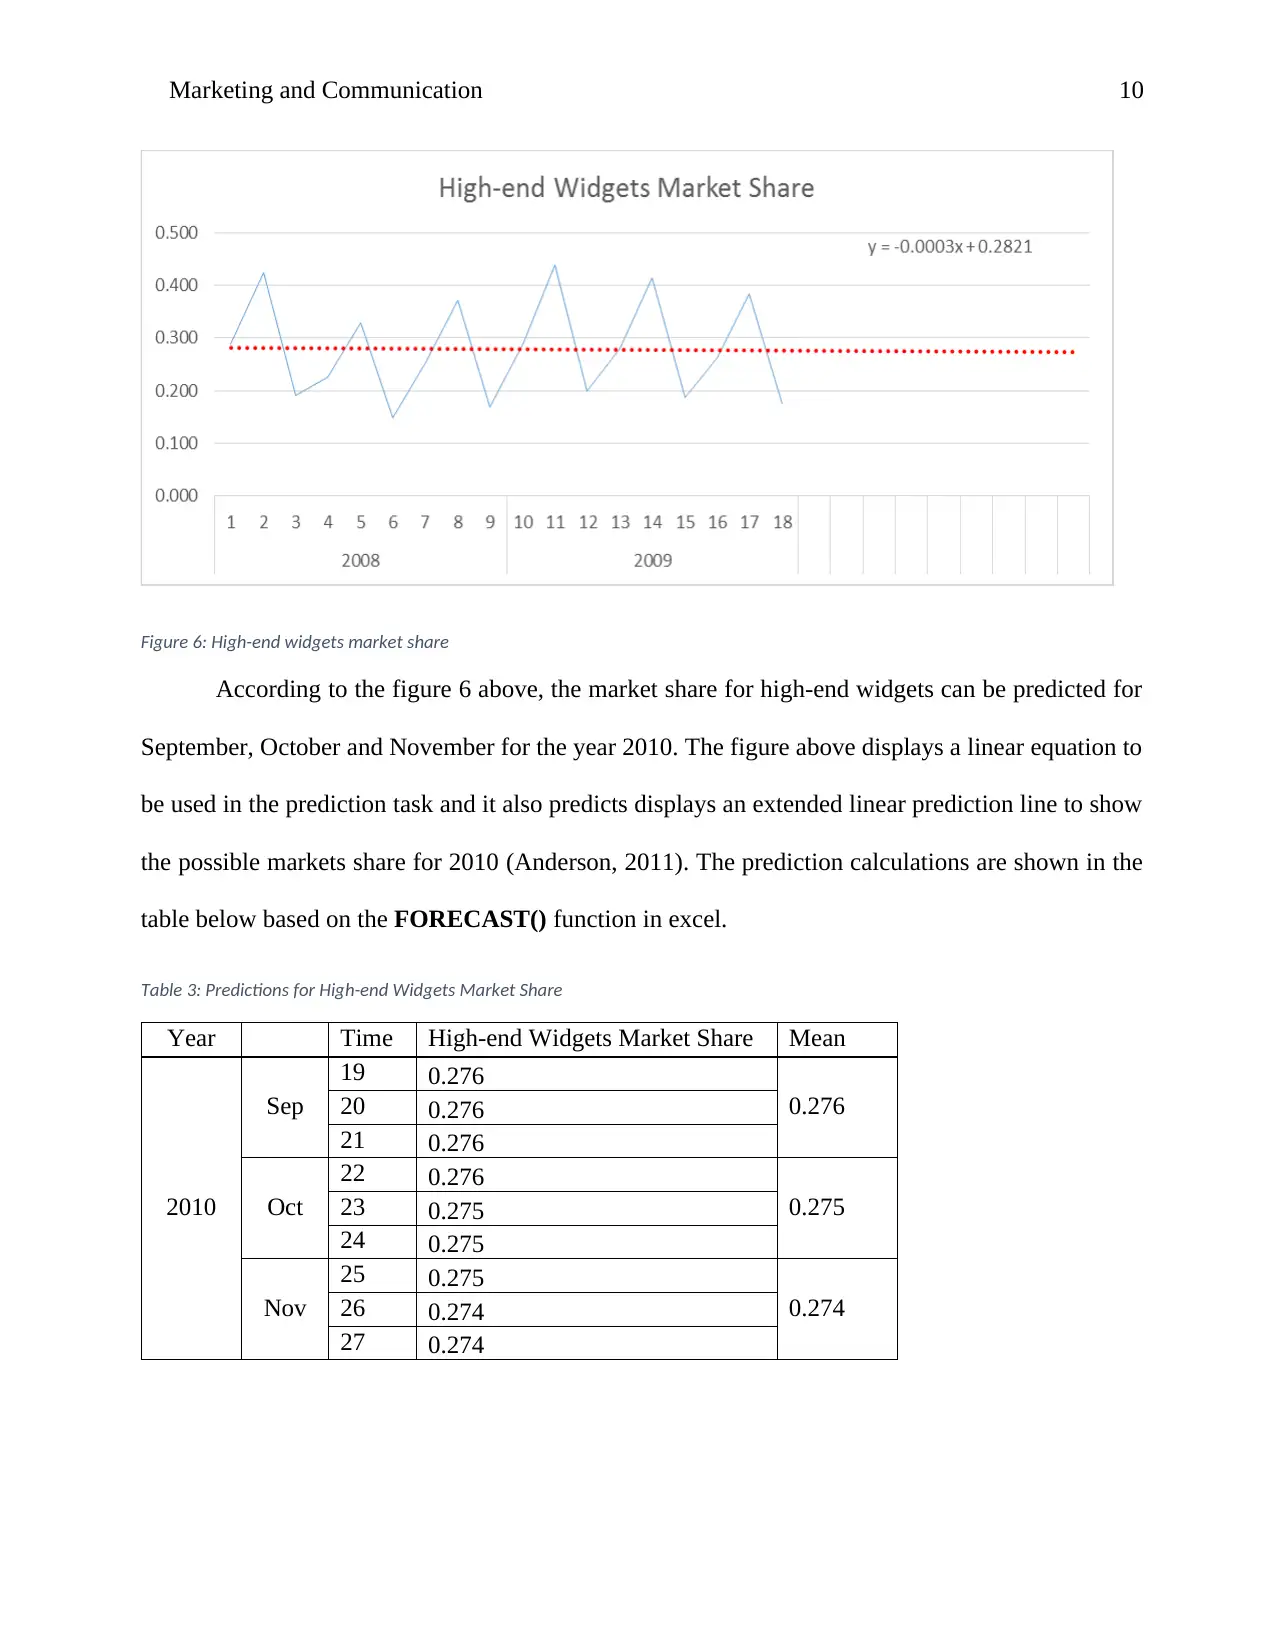
Figure 6: High-end widgets market share
According to the figure 6 above, the market share for high-end widgets can be predicted for
September, October and November for the year 2010. The figure above displays a linear equation to
be used in the prediction task and it also predicts displays an extended linear prediction line to show
the possible markets share for 2010 (Anderson, 2011). The prediction calculations are shown in the
table below based on the FORECAST() function in excel.
Table 3: Predictions for High-end Widgets Market Share
Year Time High-end Widgets Market Share Mean
2010
Sep
19 0.276
0.27620 0.276
21 0.276
Oct
22 0.276
0.27523 0.275
24 0.275
Nov
25 0.275
0.27426 0.274
27 0.274
Paraphrase This Document
Need a fresh take? Get an instant paraphrase of this document with our AI Paraphraser
Marketing and Communication 11
The predicted values for September, October and November market shares for high-end
widgets are reducing because the prediction equation has a negative slope coefficient (Brockwell
and Davis, 2016). Also, observing the trend of the market shares for the high-end category shows a
reduction in share values in time.
Assessment 2: Comparative analysis on Australian College of Specialist Make-up
Scope of the Research
Australian College of Specialist Make-up has been in existence from 1986 indicating that
they have enhanced their skills and mode of passing knowledge to those who enrol for professional
courses in their institution. They have gathered commendable experience in the make-up industry
and that is what had influenced their unwavering trust from the Australians and the international
community at large. The scope of the study is to understand the key factors that have made
Australian College of Specialist Make-up succeed and maintain their positions ahead of other
colleges offering the same courses and services within the country. The success of an institution is
influenced by various factors including customer perception, information hovering the public
domain about the institution, location and their marketing strategies among others. In this case,
qualitative and quantitative information will be compared to Australian College of Specialist Make-
up among other competitors such as Australian College of Beauty Therapy, Melbourne Polytechnic.
Tools of Research
The main tools used in this research is online research where qualitative and quantitative
information about Australian College of Specialist Make-up and its immediate competitors
mentioned in the section above. Information such as the level of experience, location, and amount
of tuition fee, modes of advertisement and the quality of services offered will be researched and
Marketing and Communication 12
recorded for comparative purposes. Main sources of information will be their official websites for
the colleges among other authentic sites.
About Australian College of Specialist Make-up (ACSM)
ACSM is a learning institution which is specialized in beauty makeup and it was founded in
1986 with experience of close to 31 years. They have only established one campus which is located
on Stirling Street in Perth. The college has chosen to work with quality makeup products from
Kryolan® and MAC®. They have customized and developed the learning areas, which provides the
best experience to the students, hence producing qualified and experienced professionals. Their
choice in using beauty products and specialists from the above-mentioned brands has improved the
chances of employment for any graduate from the college.
Competitor Companies: Australian College of Beauty Therapy (ACBT) & Melbourne Polytechnic
ACBT is a high education learning institution offering courses on beauty therapy. It was
started in 1986 and it is located in Perth City. It is registered to Australian Skills Quality Authority
and approved by Comité International d’Esthétique et de Cosmétologie(CIDESCO), which is a
global standards setter for beauty and SPA therapy. Although it is affiliated with other brands for
beauty products, it has not fully initiated business relationships with these brands such as Lycon,
MAC®, AHAVA, and ULTRACEUTICALS. It could be better for the institution’s marketing
strategy which would both benefit the students and the college if there was a full affiliation with
these brands (ACBT, 2017).
Melbourne Polytechnic is a higher-learning institution offering various professional courses
including beauty and make-up specialization. Therefore, make-up specialization is not the only
professional course the polytechnic is focusing on, hence compromising its quality because of the
time spent by the administration in developing a conducive environment for the students.
⊘ This is a preview!⊘
Do you want full access?
Subscribe today to unlock all pages.
Trusted by 1+ million students worldwide
1 out of 16
Related Documents


Your All-in-One AI-Powered Toolkit for Academic Success.
+13062052269
info@desklib.com
Available 24*7 on WhatsApp / Email
![[object Object]](/_next/static/media/star-bottom.7253800d.svg)
Unlock your academic potential
Copyright © 2020–2026 A2Z Services. All Rights Reserved. Developed and managed by ZUCOL.