Deakin Business School MIS784: Curved TV Conjoint Analysis Report
VerifiedAdded on 2022/12/28
|12
|2490
|36
Report
AI Summary
This report presents a conjoint analysis conducted to determine the optimal product profile for Sony's curved TVs. The analysis begins with an executive summary and an introduction to conjoint analysis, explaining its use in understanding consumer preferences for product attributes like brand, screen size, refresh rate, resolution, and price. The background section provides context on the rising demand for curved TVs and the competitive landscape. The methodology section describes the use of multiple regression to calculate part-worths, which represent the utility associated with each level of the TV attributes. Data analysis includes regression statistics, ANOVA results, and the calculation of part-worths and part-worth ranges. The importance of each attribute is determined, revealing consumer priorities. Based on the analysis, product profiles for Sony are proposed, and utilities and purchase probabilities are calculated for each profile. Finally, the report estimates the profitability of the new product profiles, recommending the most profitable option based on market share and cost considerations. The report concludes that the most profitable product is the SONY 65 in 120 HZ 4000 Pixels $9000, with a profit of $244,719,950.

Running header: Curved TV 1
SONY CURVED TV
Name:
Institution
SONY CURVED TV
Name:
Institution
Paraphrase This Document
Need a fresh take? Get an instant paraphrase of this document with our AI Paraphraser
Curved TV 2
Executive Summary
The following report seeks to exhibit how CA can be adopted by SONY company to identify the
product profile which is likely to generate the maximum profit. As evident, it is essential to
incorporate numerous attributes of a product to ensure all concerns or are involved to obtain the
appropriate consumer preference (Weedmark, 2018). Similarly, it is essential to incorporate
different TV attributes to aid in identifying the consumer’s preferences. The coefficients of
regression represent the part-worth for each level. Moreover, to obtain the part-wort ranges the
minimum value of level is subtracted from the maximum value within the factor (attribute).
Generally, the most profitable product (NEW) is (SONY 65 in 120 HZ 4000 Pixels $9000) with
a profit of $244,719,950.
Curved TV 3
Table of Contents
Executive Summary.............................................................................................................2
Introduction..........................................................................................................................4
Background..........................................................................................................................5
Importance of different TV attributes..................................................................................6
Methodology........................................................................................................................6
Data Analysis.......................................................................................................................7
Regression........................................................................................................................7
Part-worths.......................................................................................................................8
Part-worth Range.............................................................................................................9
Importance.......................................................................................................................9
Product Profiles for SONY................................................................................................10
Utilities..............................................................................................................................10
Purchase Probabilities........................................................................................................10
Profitability........................................................................................................................11
Recommendations..............................................................................................................11
References..........................................................................................................................11
⊘ This is a preview!⊘
Do you want full access?
Subscribe today to unlock all pages.
Trusted by 1+ million students worldwide
Curved TV 4
Introduction
There are no doubts companies tend to engage in various activities to become relevant in
the market, such as the introduction new products or commodities and the redesigning of existing
product to the market. Notably, during the unveiling of new products and services it is essential
to understand the customer’s value and needs (Brooks, 2014). However, products tend to have
numerous features thus it is challenging to understand the specific aspects which the customers
tend to value more than others. As a result, there are various methods adopted by manufactures,
companies, and wholesalers to explore the customer preference; however, the most applicable
and recommended methods used to exhibit the order of importance is the conjoint analysis
(Adrian, 2014). Conjoint analysis (CA) is a statistical technique developed particularly to exhibit
how the respondents develop preference for a specific product or service (Partani, 2010).
Consequently, CA can also be referred to as discrete choice modelling, multi-attribute
compositional modelling, and stated preference research (Partani, 2010).
Besides, CA is a marketing strategy for forecasting how developed or redesigned goods
and services would perform when introduced to the market. The technique aids in selecting the
appropriate attributes (features) associated with the product and set the price for the given
product, thus companies can “win over” customers and maximize the sale, which result in
increased profit margin (Allen, 2017). The consumers evaluate the value for a product by
combing the separate amount of value provided by the attributes. Notably, there are various
components of CA, which include factor, level, profile, utility, and part-worth, among others.
Factor: Comprises of an independent variable that represent a given attribute or feature
Level: A non-metric value that exhibits a factor
Profile: Exhibits all the possible levels of factors
Paraphrase This Document
Need a fresh take? Get an instant paraphrase of this document with our AI Paraphraser
Curved TV 5
Utility: A value or worth of a specific product that shows the consumer’s subjective
preference.
Part-worth: A specific utility linked to each level of each factor.
Therefore, the following report seeks to exhibit how CA can be adopted by SONY
company to identify the product profile which is likely to generate the maximum profit.
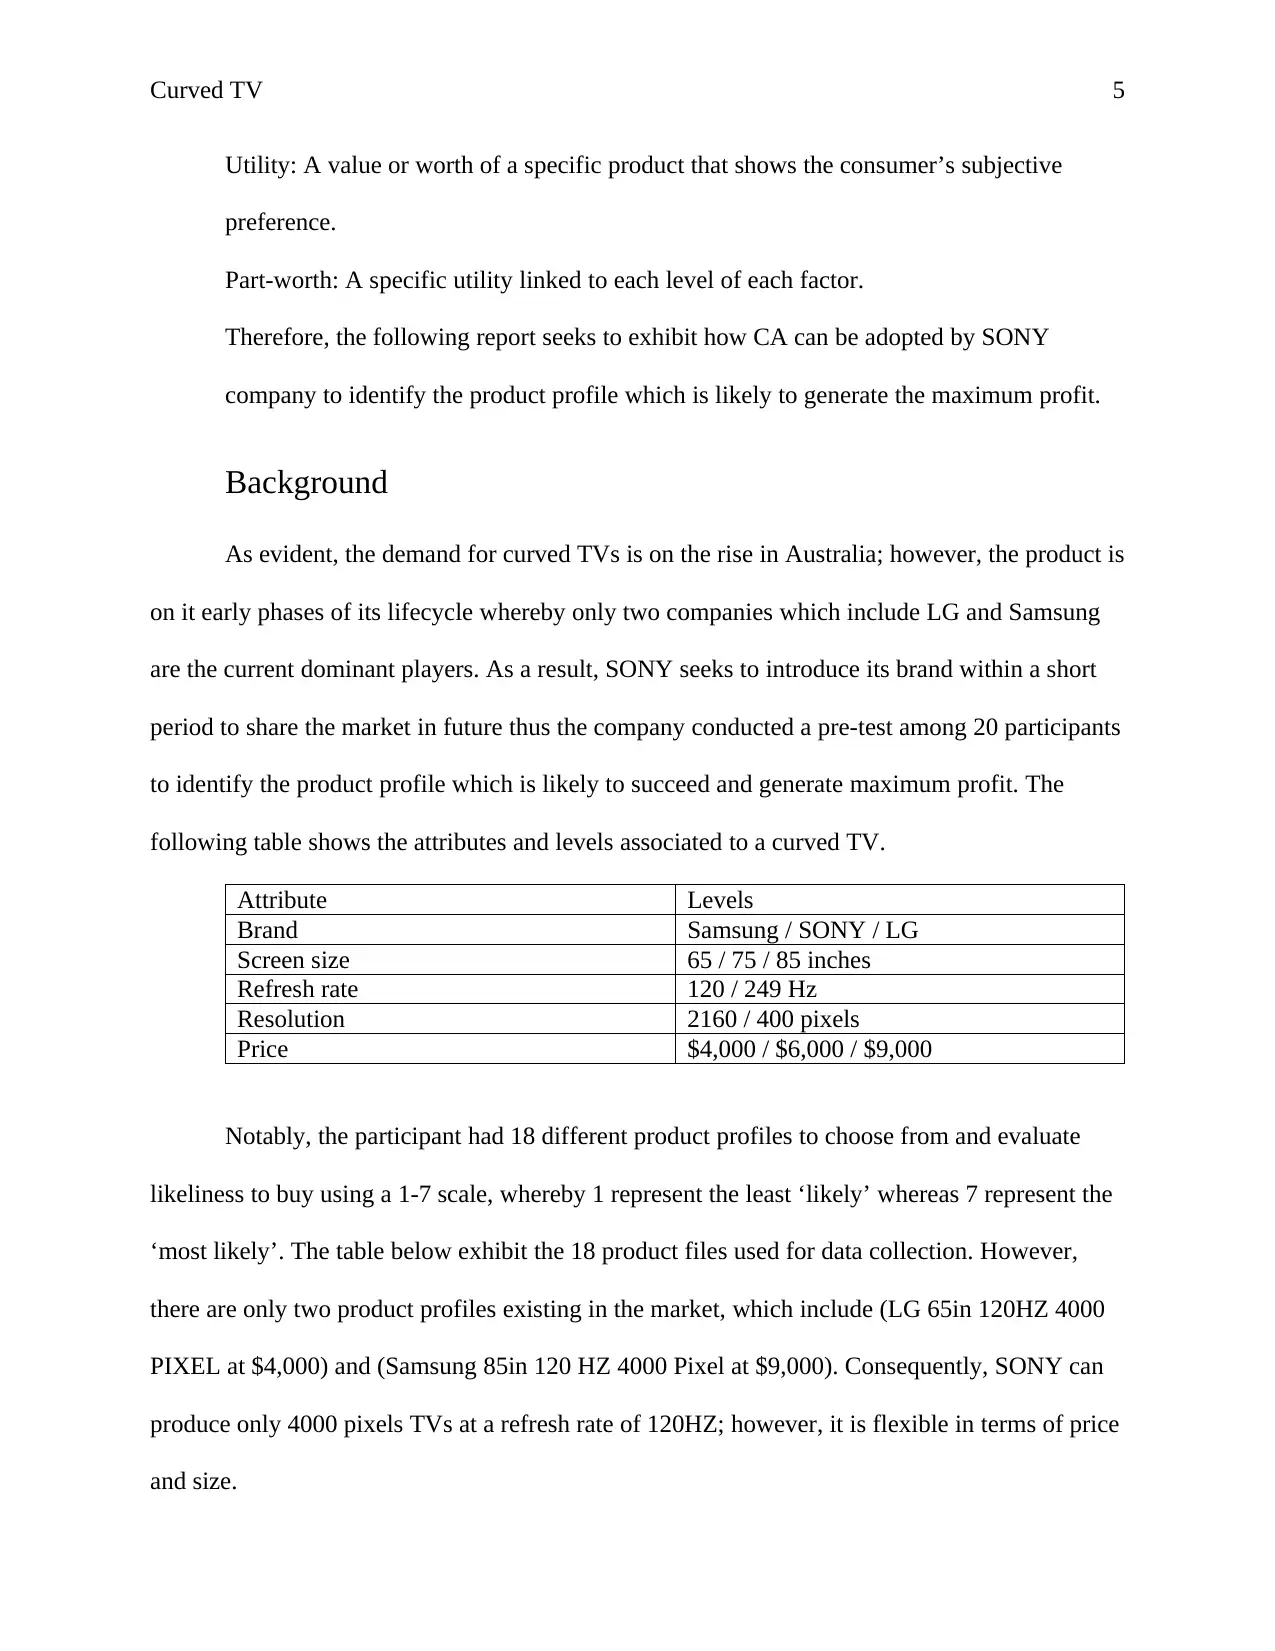
Background
As evident, the demand for curved TVs is on the rise in Australia; however, the product is
on it early phases of its lifecycle whereby only two companies which include LG and Samsung
are the current dominant players. As a result, SONY seeks to introduce its brand within a short
period to share the market in future thus the company conducted a pre-test among 20 participants
to identify the product profile which is likely to succeed and generate maximum profit. The
following table shows the attributes and levels associated to a curved TV.
Attribute Levels
Brand Samsung / SONY / LG
Screen size 65 / 75 / 85 inches
Refresh rate 120 / 249 Hz
Resolution 2160 / 400 pixels
Price $4,000 / $6,000 / $9,000
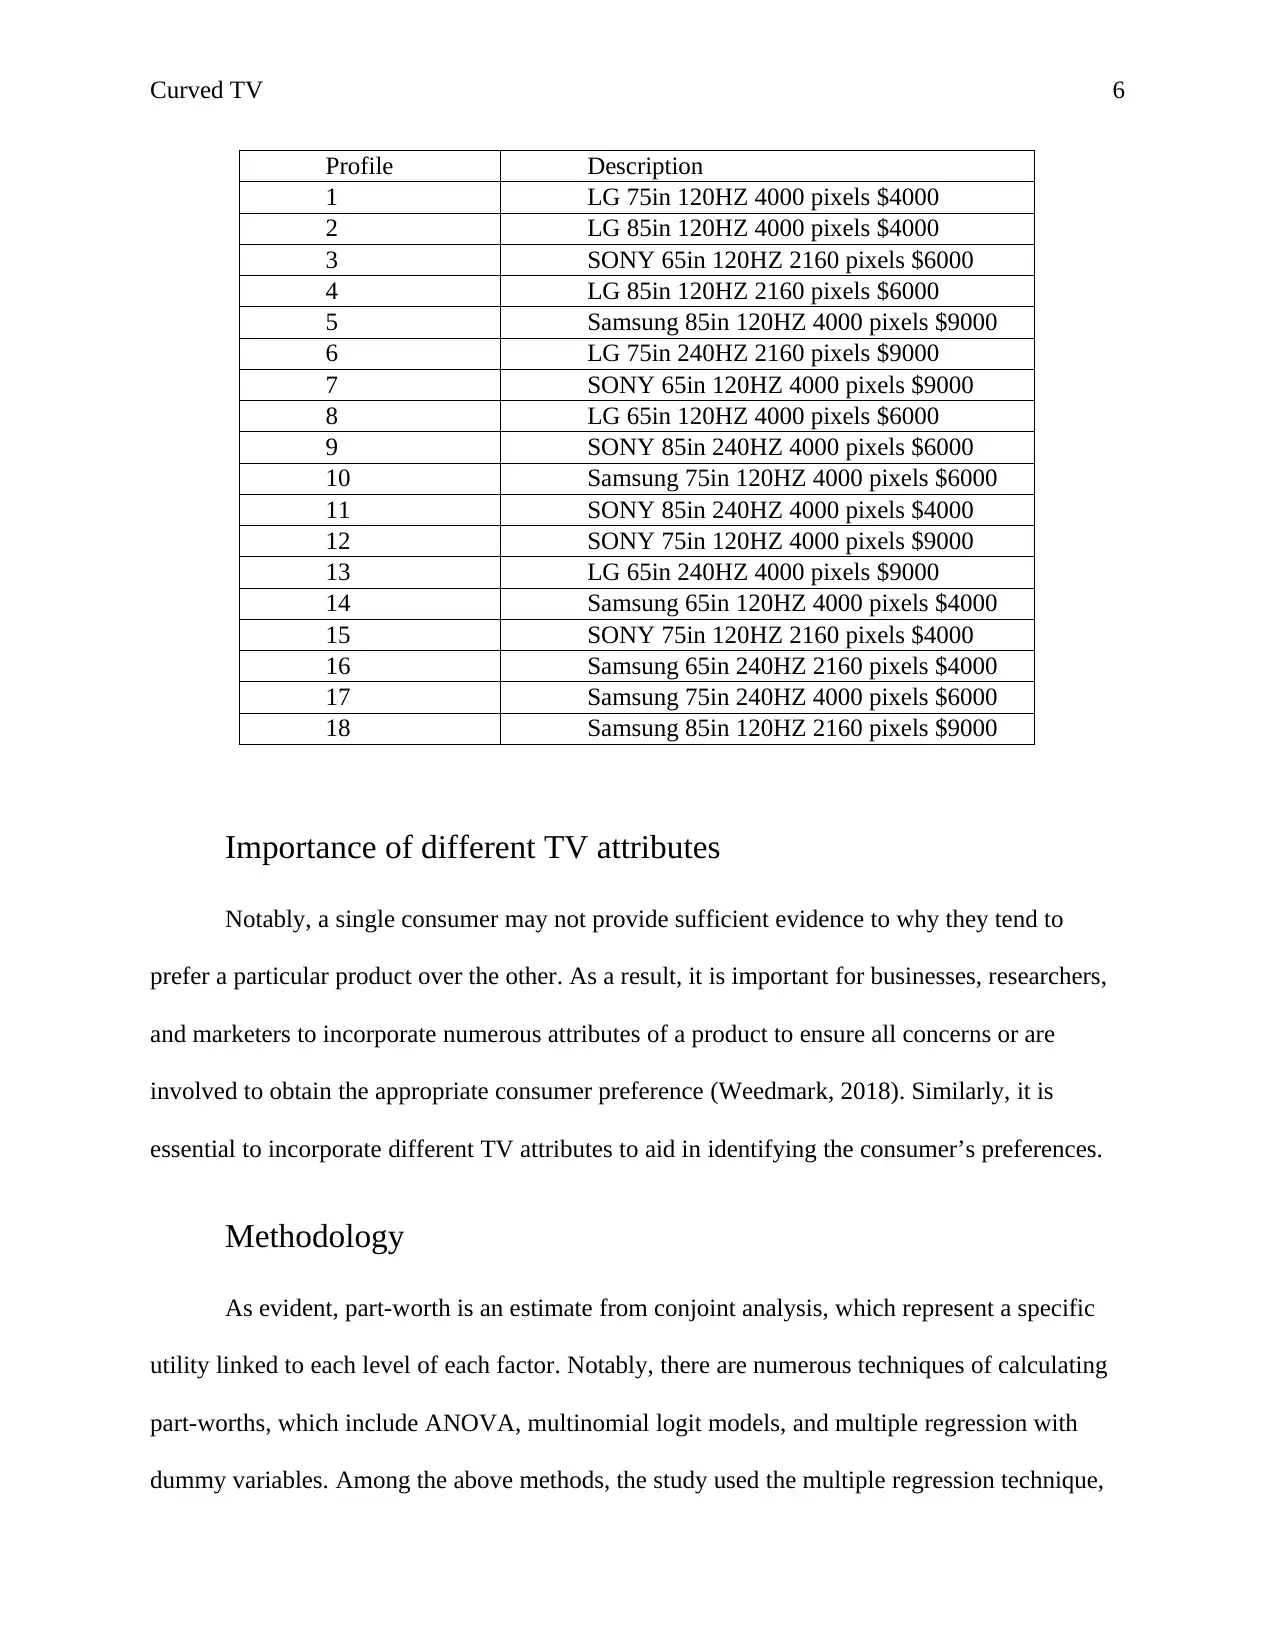
Notably, the participant had 18 different product profiles to choose from and evaluate
likeliness to buy using a 1-7 scale, whereby 1 represent the least ‘likely’ whereas 7 represent the
‘most likely’. The table below exhibit the 18 product files used for data collection. However,
there are only two product profiles existing in the market, which include (LG 65in 120HZ 4000
PIXEL at $4,000) and (Samsung 85in 120 HZ 4000 Pixel at $9,000). Consequently, SONY can
produce only 4000 pixels TVs at a refresh rate of 120HZ; however, it is flexible in terms of price
and size.
Utility: A value or worth of a specific product that shows the consumer’s subjective
preference.
Part-worth: A specific utility linked to each level of each factor.
Therefore, the following report seeks to exhibit how CA can be adopted by SONY
company to identify the product profile which is likely to generate the maximum profit.
Background
As evident, the demand for curved TVs is on the rise in Australia; however, the product is
on it early phases of its lifecycle whereby only two companies which include LG and Samsung
are the current dominant players. As a result, SONY seeks to introduce its brand within a short
period to share the market in future thus the company conducted a pre-test among 20 participants
to identify the product profile which is likely to succeed and generate maximum profit. The
following table shows the attributes and levels associated to a curved TV.
Attribute Levels
Brand Samsung / SONY / LG
Screen size 65 / 75 / 85 inches
Refresh rate 120 / 249 Hz
Resolution 2160 / 400 pixels
Price $4,000 / $6,000 / $9,000
Notably, the participant had 18 different product profiles to choose from and evaluate
likeliness to buy using a 1-7 scale, whereby 1 represent the least ‘likely’ whereas 7 represent the
‘most likely’. The table below exhibit the 18 product files used for data collection. However,
there are only two product profiles existing in the market, which include (LG 65in 120HZ 4000
PIXEL at $4,000) and (Samsung 85in 120 HZ 4000 Pixel at $9,000). Consequently, SONY can
produce only 4000 pixels TVs at a refresh rate of 120HZ; however, it is flexible in terms of price
and size.
Curved TV 6
Profile Description
1 LG 75in 120HZ 4000 pixels $4000
2 LG 85in 120HZ 4000 pixels $4000
3 SONY 65in 120HZ 2160 pixels $6000
4 LG 85in 120HZ 2160 pixels $6000
5 Samsung 85in 120HZ 4000 pixels $9000
6 LG 75in 240HZ 2160 pixels $9000
7 SONY 65in 120HZ 4000 pixels $9000
8 LG 65in 120HZ 4000 pixels $6000
9 SONY 85in 240HZ 4000 pixels $6000
10 Samsung 75in 120HZ 4000 pixels $6000
11 SONY 85in 240HZ 4000 pixels $4000
12 SONY 75in 120HZ 4000 pixels $9000
13 LG 65in 240HZ 4000 pixels $9000
14 Samsung 65in 120HZ 4000 pixels $4000
15 SONY 75in 120HZ 2160 pixels $4000
16 Samsung 65in 240HZ 2160 pixels $4000
17 Samsung 75in 240HZ 4000 pixels $6000
18 Samsung 85in 120HZ 2160 pixels $9000
Importance of different TV attributes
Notably, a single consumer may not provide sufficient evidence to why they tend to
prefer a particular product over the other. As a result, it is important for businesses, researchers,
and marketers to incorporate numerous attributes of a product to ensure all concerns or are
involved to obtain the appropriate consumer preference (Weedmark, 2018). Similarly, it is
essential to incorporate different TV attributes to aid in identifying the consumer’s preferences.
Methodology
As evident, part-worth is an estimate from conjoint analysis, which represent a specific
utility linked to each level of each factor. Notably, there are numerous techniques of calculating
part-worths, which include ANOVA, multinomial logit models, and multiple regression with
dummy variables. Among the above methods, the study used the multiple regression technique,
⊘ This is a preview!⊘
Do you want full access?
Subscribe today to unlock all pages.
Trusted by 1+ million students worldwide
Curved TV 7
whereby the levels act as the independent variable whereas the customer ratings or evaluation are
the dependent variable. Besides, the dependent variables are constant whereas the independent
tend to change with respect to each participant. Consequently, the calculation of part-worth is
done for each participant separately. Moreover, it is essential to identify levels that will be used
as base or reference level part-worth thus the reference level for the analysis include Screen size
85, LG brand, refresh rate 240, resolution 2160 pixel, and price $9,000. As evident, the
regression will utilize dummy variables that assume values 0 and 1, whereby 1 represent
availability whereas 0 exhibit not available in the product profile.
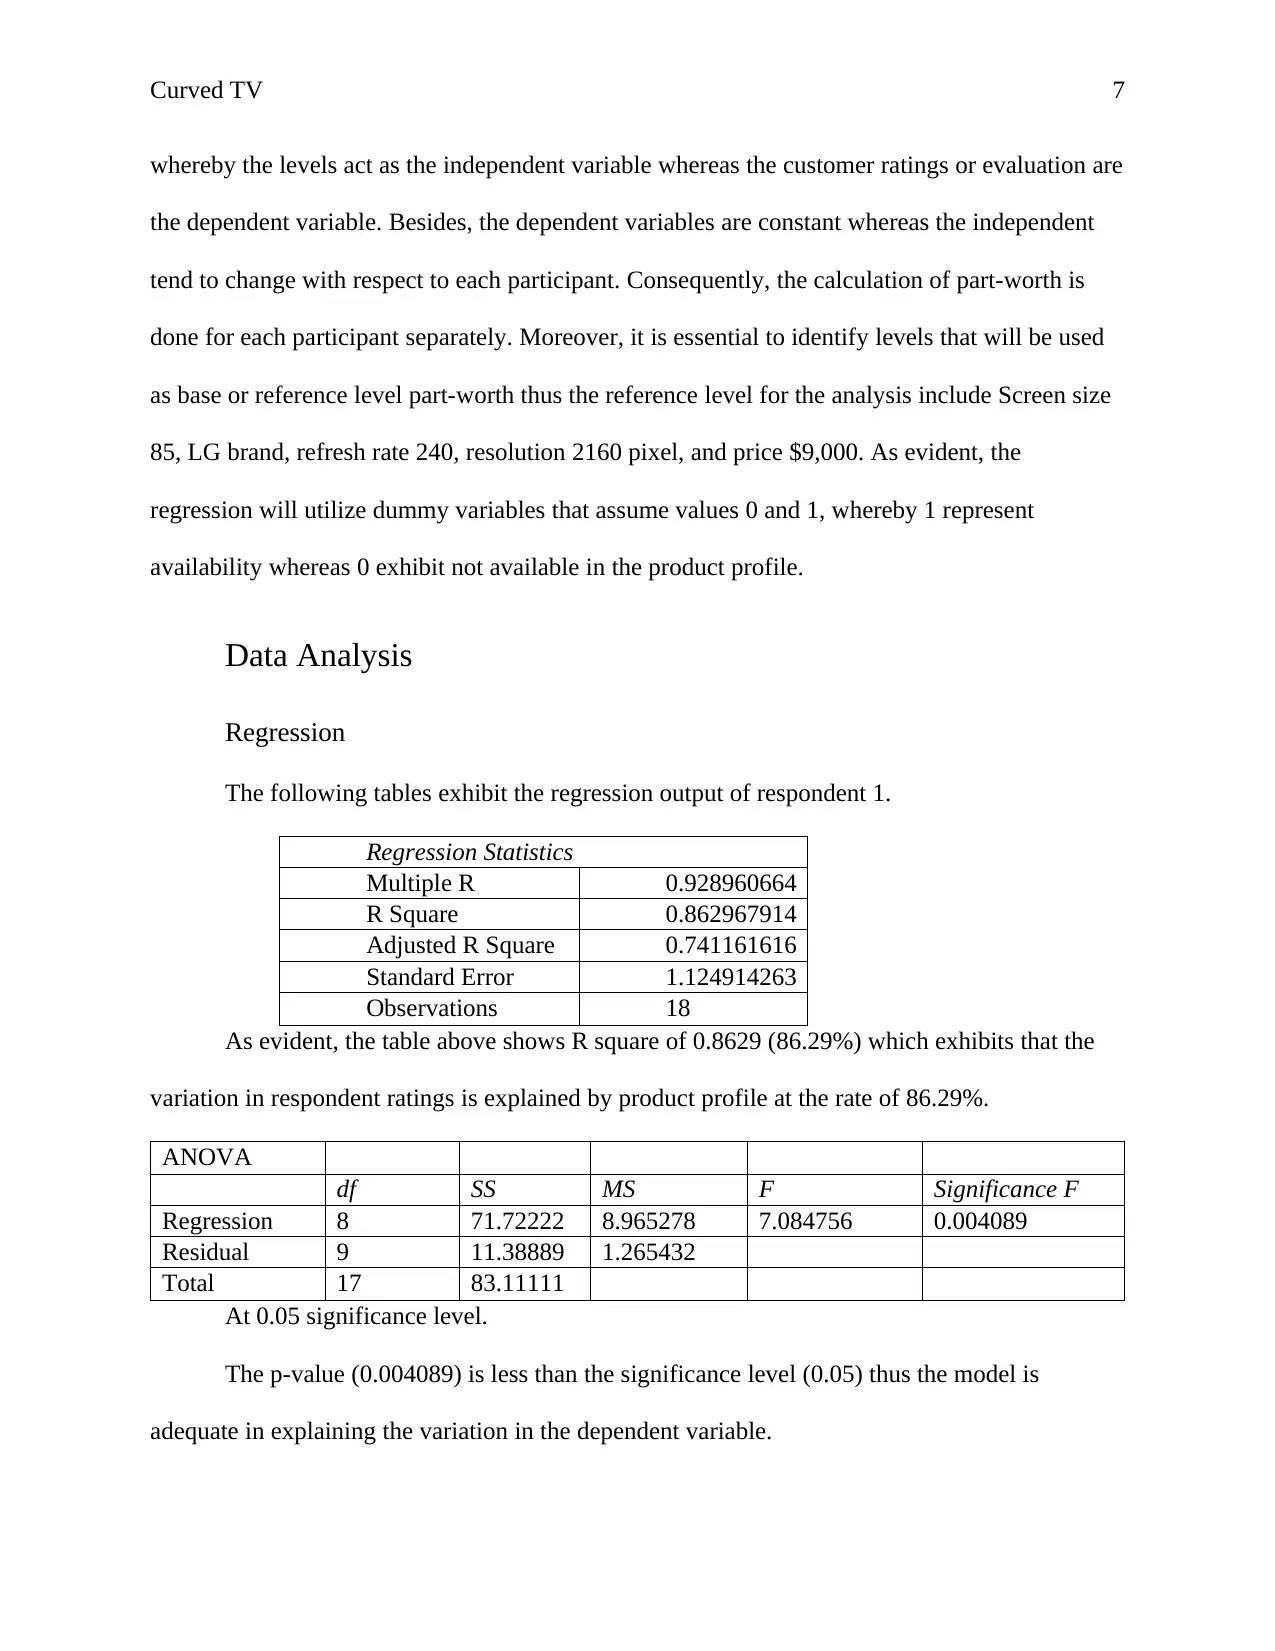
Data Analysis
Regression
The following tables exhibit the regression output of respondent 1.
Regression Statistics
Multiple R 0.928960664
R Square 0.862967914
Adjusted R Square 0.741161616
Standard Error 1.124914263
Observations 18
As evident, the table above shows R square of 0.8629 (86.29%) which exhibits that the
variation in respondent ratings is explained by product profile at the rate of 86.29%.
ANOVA
df SS MS F Significance F
Regression 8 71.72222 8.965278 7.084756 0.004089
Residual 9 11.38889 1.265432
Total 17 83.11111
At 0.05 significance level.
The p-value (0.004089) is less than the significance level (0.05) thus the model is
adequate in explaining the variation in the dependent variable.
whereby the levels act as the independent variable whereas the customer ratings or evaluation are
the dependent variable. Besides, the dependent variables are constant whereas the independent
tend to change with respect to each participant. Consequently, the calculation of part-worth is
done for each participant separately. Moreover, it is essential to identify levels that will be used
as base or reference level part-worth thus the reference level for the analysis include Screen size
85, LG brand, refresh rate 240, resolution 2160 pixel, and price $9,000. As evident, the
regression will utilize dummy variables that assume values 0 and 1, whereby 1 represent
availability whereas 0 exhibit not available in the product profile.
Data Analysis
Regression
The following tables exhibit the regression output of respondent 1.
Regression Statistics
Multiple R 0.928960664
R Square 0.862967914
Adjusted R Square 0.741161616
Standard Error 1.124914263
Observations 18
As evident, the table above shows R square of 0.8629 (86.29%) which exhibits that the
variation in respondent ratings is explained by product profile at the rate of 86.29%.
ANOVA
df SS MS F Significance F
Regression 8 71.72222 8.965278 7.084756 0.004089
Residual 9 11.38889 1.265432
Total 17 83.11111
At 0.05 significance level.
The p-value (0.004089) is less than the significance level (0.05) thus the model is
adequate in explaining the variation in the dependent variable.
Paraphrase This Document
Need a fresh take? Get an instant paraphrase of this document with our AI Paraphraser
Curved TV 8
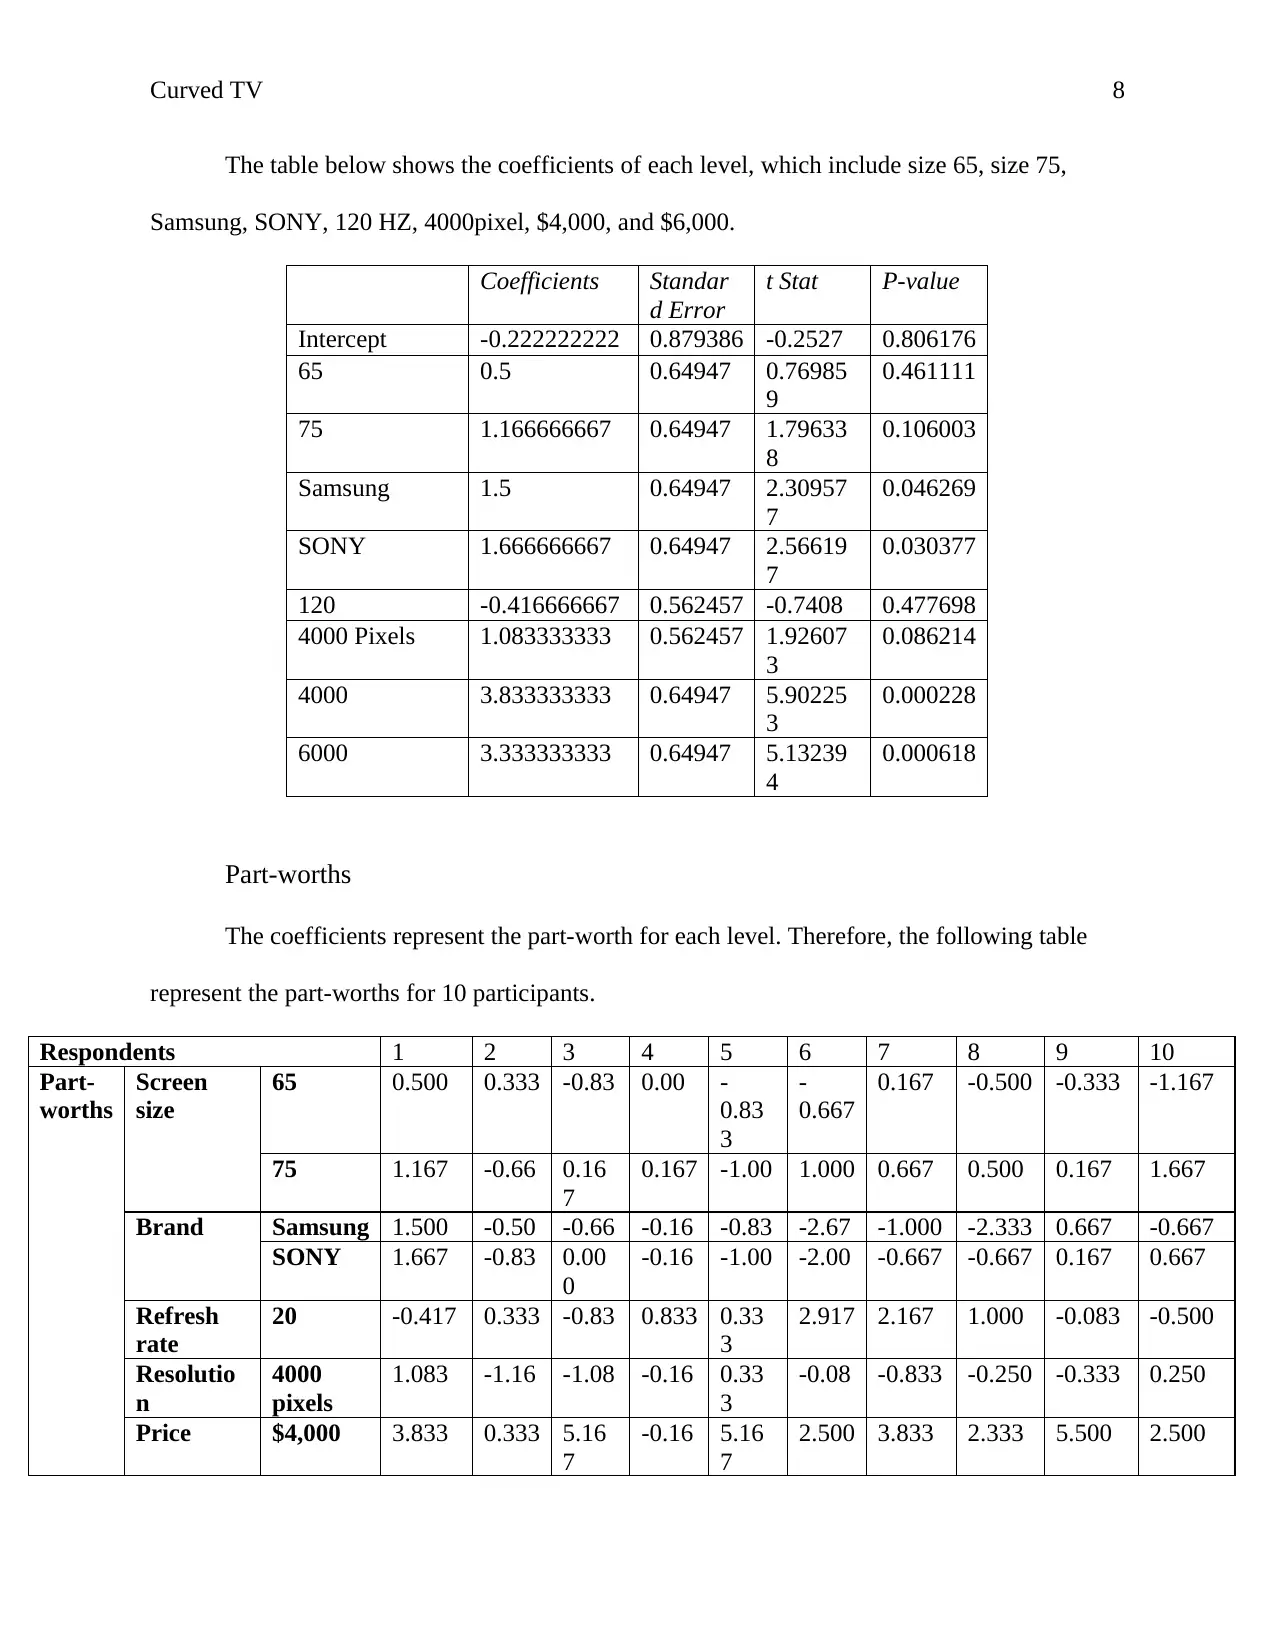
The table below shows the coefficients of each level, which include size 65, size 75,
Samsung, SONY, 120 HZ, 4000pixel, $4,000, and $6,000.
Coefficients Standar
d Error
t Stat P-value
Intercept -0.222222222 0.879386 -0.2527 0.806176
65 0.5 0.64947 0.76985
9
0.461111
75 1.166666667 0.64947 1.79633
8
0.106003
Samsung 1.5 0.64947 2.30957
7
0.046269
SONY 1.666666667 0.64947 2.56619
7
0.030377
120 -0.416666667 0.562457 -0.7408 0.477698
4000 Pixels 1.083333333 0.562457 1.92607
3
0.086214
4000 3.833333333 0.64947 5.90225
3
0.000228
6000 3.333333333 0.64947 5.13239
4
0.000618
Part-worths
The coefficients represent the part-worth for each level. Therefore, the following table
represent the part-worths for 10 participants.
Respondents 1 2 3 4 5 6 7 8 9 10
Part-
worths
Screen
size
65 0.500 0.333 -0.83 0.00 -
0.83
3
-
0.667
0.167 -0.500 -0.333 -1.167
75 1.167 -0.66 0.16
7
0.167 -1.00 1.000 0.667 0.500 0.167 1.667
Brand Samsung 1.500 -0.50 -0.66 -0.16 -0.83 -2.67 -1.000 -2.333 0.667 -0.667
SONY 1.667 -0.83 0.00
0
-0.16 -1.00 -2.00 -0.667 -0.667 0.167 0.667
Refresh
rate
20 -0.417 0.333 -0.83 0.833 0.33
3
2.917 2.167 1.000 -0.083 -0.500
Resolutio
n
4000
pixels
1.083 -1.16 -1.08 -0.16 0.33
3
-0.08 -0.833 -0.250 -0.333 0.250
Price $4,000 3.833 0.333 5.16
7
-0.16 5.16
7
2.500 3.833 2.333 5.500 2.500
Curved TV 9
$6,000 3.333 -1.16 2.66
7
-0.16 1.50
0
1.833 2.500 0.167 0.833 1.000
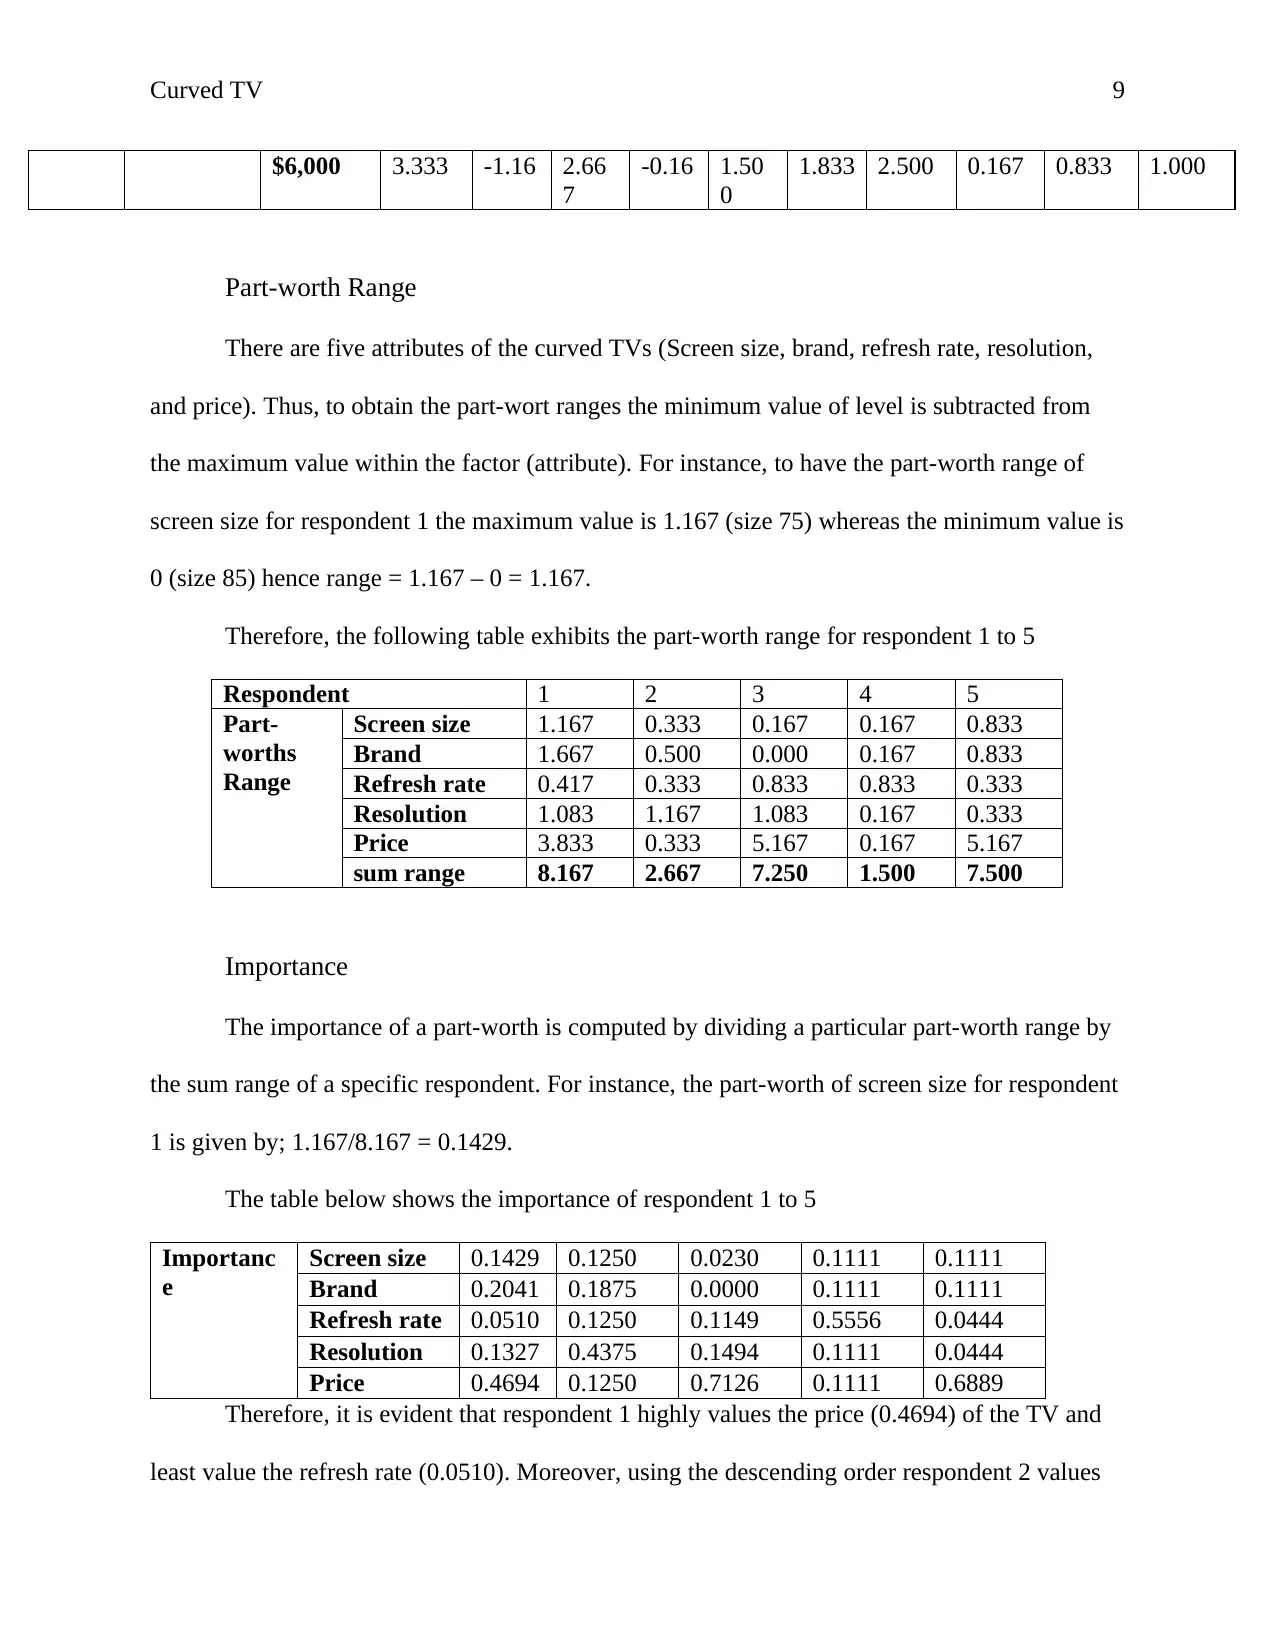
Part-worth Range
There are five attributes of the curved TVs (Screen size, brand, refresh rate, resolution,
and price). Thus, to obtain the part-wort ranges the minimum value of level is subtracted from
the maximum value within the factor (attribute). For instance, to have the part-worth range of
screen size for respondent 1 the maximum value is 1.167 (size 75) whereas the minimum value is
0 (size 85) hence range = 1.167 – 0 = 1.167.
Therefore, the following table exhibits the part-worth range for respondent 1 to 5
Respondent 1 2 3 4 5
Part-
worths
Range
Screen size 1.167 0.333 0.167 0.167 0.833
Brand 1.667 0.500 0.000 0.167 0.833
Refresh rate 0.417 0.333 0.833 0.833 0.333
Resolution 1.083 1.167 1.083 0.167 0.333
Price 3.833 0.333 5.167 0.167 5.167
sum range 8.167 2.667 7.250 1.500 7.500
Importance
The importance of a part-worth is computed by dividing a particular part-worth range by
the sum range of a specific respondent. For instance, the part-worth of screen size for respondent
1 is given by; 1.167/8.167 = 0.1429.
The table below shows the importance of respondent 1 to 5
Importanc
e
Screen size 0.1429 0.1250 0.0230 0.1111 0.1111
Brand 0.2041 0.1875 0.0000 0.1111 0.1111
Refresh rate 0.0510 0.1250 0.1149 0.5556 0.0444
Resolution 0.1327 0.4375 0.1494 0.1111 0.0444
Price 0.4694 0.1250 0.7126 0.1111 0.6889
Therefore, it is evident that respondent 1 highly values the price (0.4694) of the TV and
least value the refresh rate (0.0510). Moreover, using the descending order respondent 2 values
$6,000 3.333 -1.16 2.66
7
-0.16 1.50
0
1.833 2.500 0.167 0.833 1.000
Part-worth Range
There are five attributes of the curved TVs (Screen size, brand, refresh rate, resolution,
and price). Thus, to obtain the part-wort ranges the minimum value of level is subtracted from
the maximum value within the factor (attribute). For instance, to have the part-worth range of
screen size for respondent 1 the maximum value is 1.167 (size 75) whereas the minimum value is
0 (size 85) hence range = 1.167 – 0 = 1.167.
Therefore, the following table exhibits the part-worth range for respondent 1 to 5
Respondent 1 2 3 4 5
Part-
worths
Range
Screen size 1.167 0.333 0.167 0.167 0.833
Brand 1.667 0.500 0.000 0.167 0.833
Refresh rate 0.417 0.333 0.833 0.833 0.333
Resolution 1.083 1.167 1.083 0.167 0.333
Price 3.833 0.333 5.167 0.167 5.167
sum range 8.167 2.667 7.250 1.500 7.500
Importance
The importance of a part-worth is computed by dividing a particular part-worth range by
the sum range of a specific respondent. For instance, the part-worth of screen size for respondent
1 is given by; 1.167/8.167 = 0.1429.
The table below shows the importance of respondent 1 to 5
Importanc
e
Screen size 0.1429 0.1250 0.0230 0.1111 0.1111
Brand 0.2041 0.1875 0.0000 0.1111 0.1111
Refresh rate 0.0510 0.1250 0.1149 0.5556 0.0444
Resolution 0.1327 0.4375 0.1494 0.1111 0.0444
Price 0.4694 0.1250 0.7126 0.1111 0.6889
Therefore, it is evident that respondent 1 highly values the price (0.4694) of the TV and
least value the refresh rate (0.0510). Moreover, using the descending order respondent 2 values
⊘ This is a preview!⊘
Do you want full access?
Subscribe today to unlock all pages.
Trusted by 1+ million students worldwide
Curved TV 10
resolution and brand as the highest; however, screen size, refresh rate, and price have the same
value. Clearly, all respondents have different importance towards the TV.
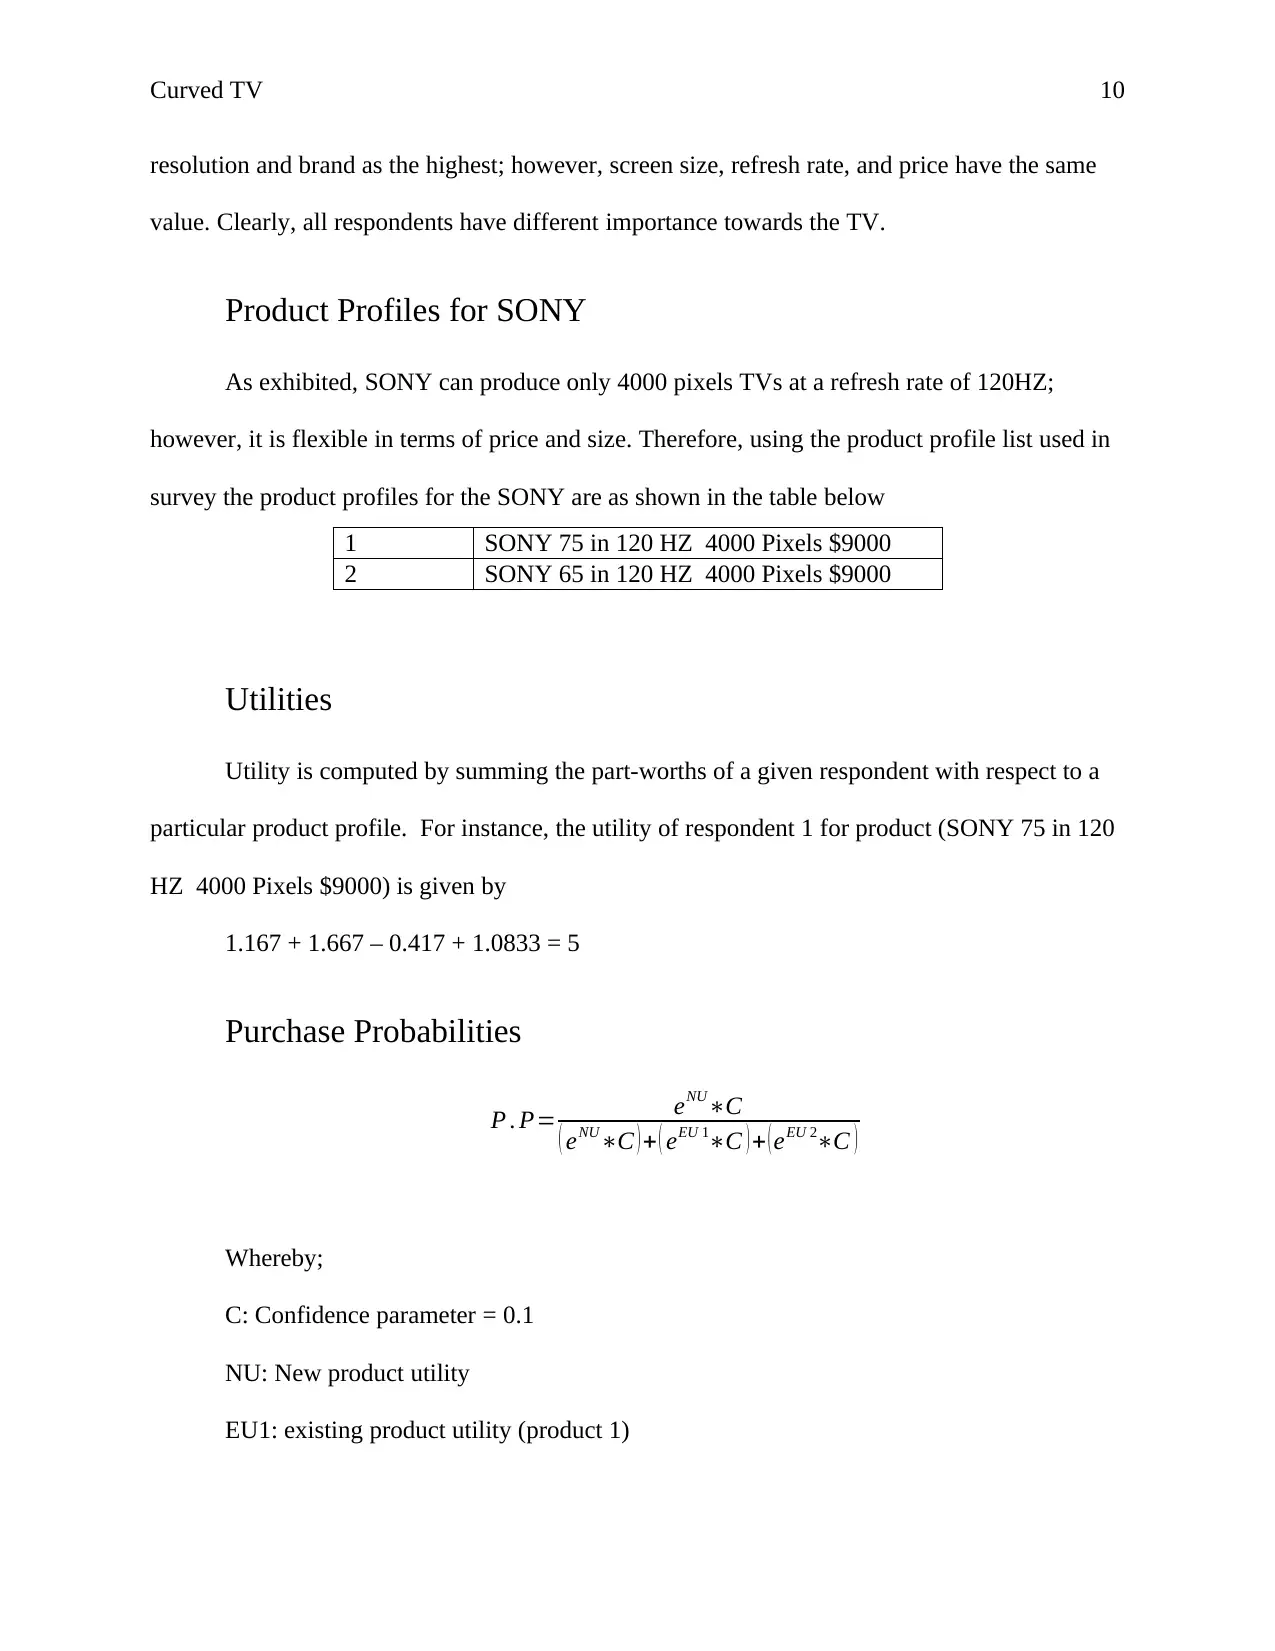
Product Profiles for SONY
As exhibited, SONY can produce only 4000 pixels TVs at a refresh rate of 120HZ;
however, it is flexible in terms of price and size. Therefore, using the product profile list used in
survey the product profiles for the SONY are as shown in the table below
Utilities
Utility is computed by summing the part-worths of a given respondent with respect to a
particular product profile. For instance, the utility of respondent 1 for product (SONY 75 in 120
HZ 4000 Pixels $9000) is given by
1.167 + 1.667 – 0.417 + 1.0833 = 5
Purchase Probabilities
P . P= eNU∗C
( eNU∗C ) + ( eEU 1∗C ) + ( eEU 2∗C )
Whereby;
C: Confidence parameter = 0.1
NU: New product utility
EU1: existing product utility (product 1)
1 SONY 75 in 120 HZ 4000 Pixels $9000
2 SONY 65 in 120 HZ 4000 Pixels $9000
resolution and brand as the highest; however, screen size, refresh rate, and price have the same
value. Clearly, all respondents have different importance towards the TV.
Product Profiles for SONY
As exhibited, SONY can produce only 4000 pixels TVs at a refresh rate of 120HZ;
however, it is flexible in terms of price and size. Therefore, using the product profile list used in
survey the product profiles for the SONY are as shown in the table below
Utilities
Utility is computed by summing the part-worths of a given respondent with respect to a
particular product profile. For instance, the utility of respondent 1 for product (SONY 75 in 120
HZ 4000 Pixels $9000) is given by
1.167 + 1.667 – 0.417 + 1.0833 = 5
Purchase Probabilities
P . P= eNU∗C
( eNU∗C ) + ( eEU 1∗C ) + ( eEU 2∗C )
Whereby;
C: Confidence parameter = 0.1
NU: New product utility
EU1: existing product utility (product 1)
1 SONY 75 in 120 HZ 4000 Pixels $9000
2 SONY 65 in 120 HZ 4000 Pixels $9000
Paraphrase This Document
Need a fresh take? Get an instant paraphrase of this document with our AI Paraphraser
Curved TV 11
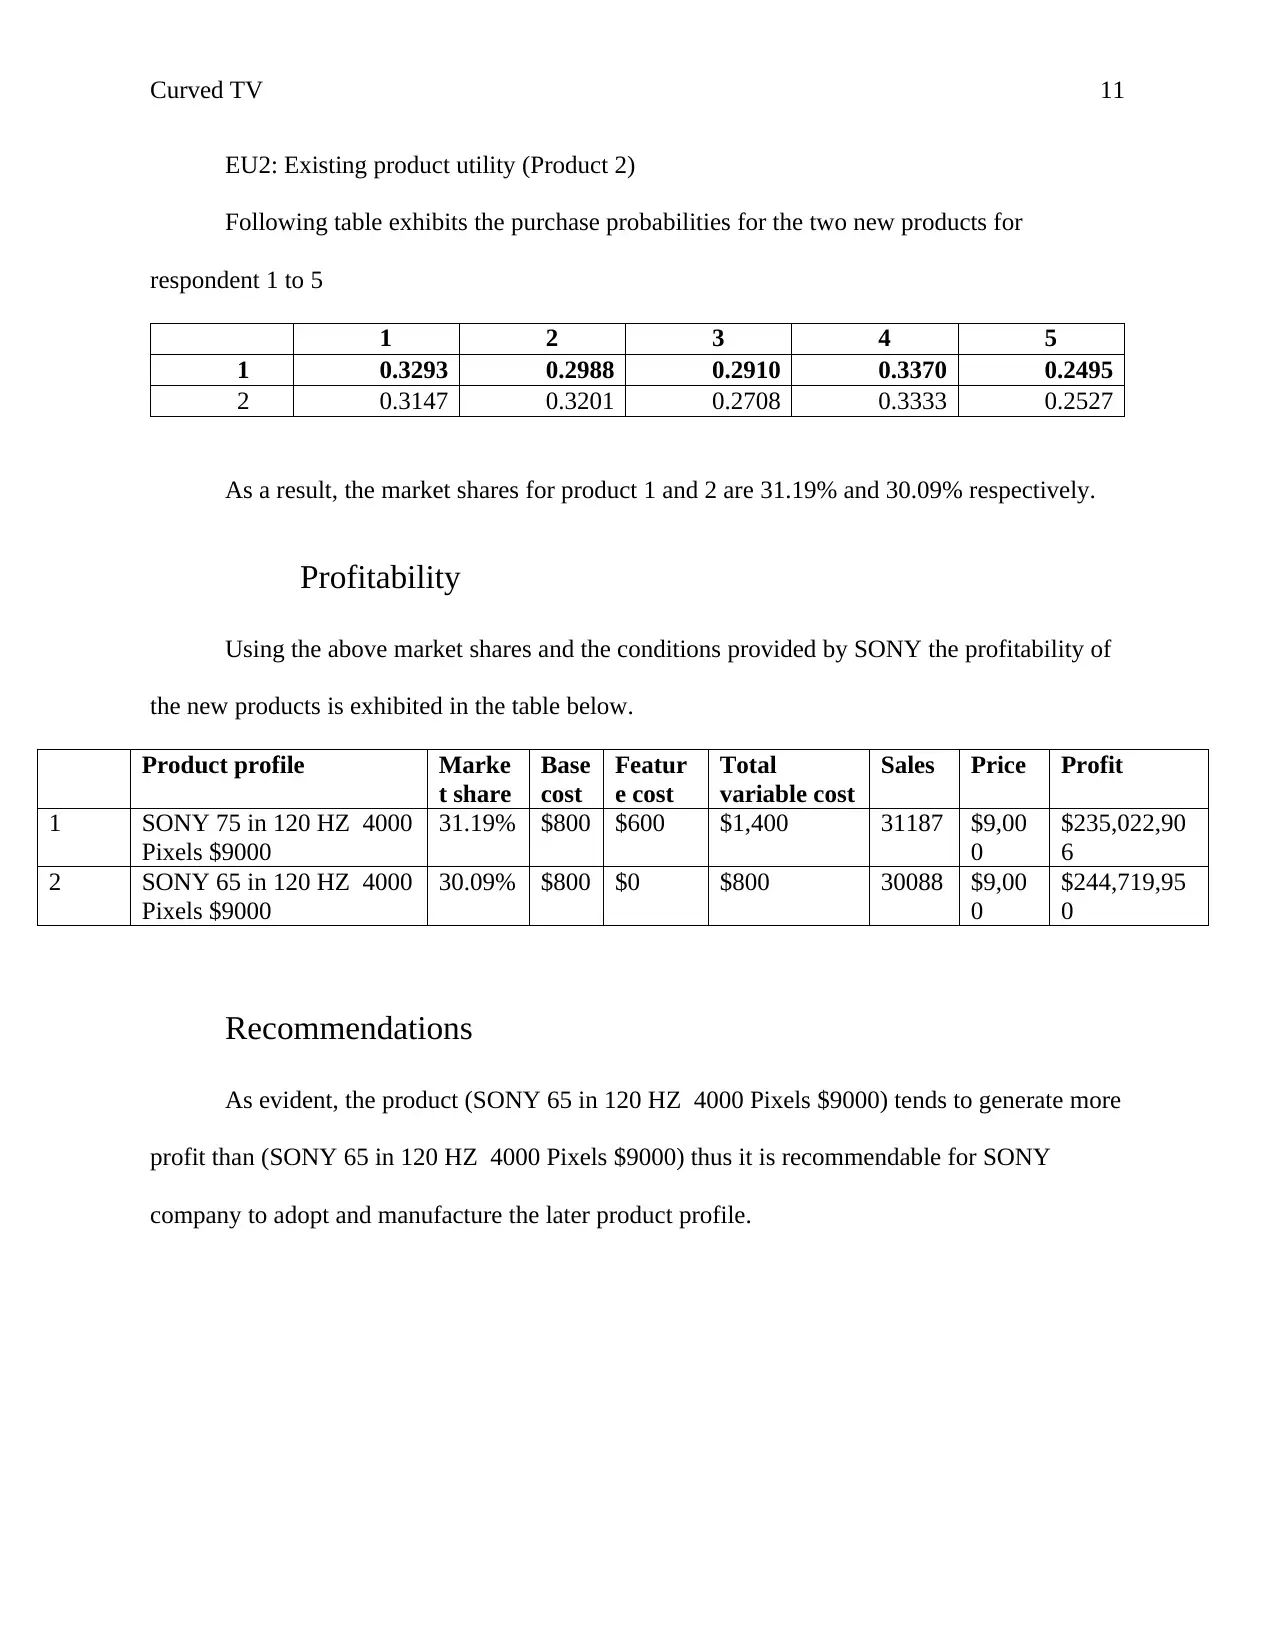
EU2: Existing product utility (Product 2)
Following table exhibits the purchase probabilities for the two new products for
respondent 1 to 5
1 2 3 4 5
1 0.3293 0.2988 0.2910 0.3370 0.2495
2 0.3147 0.3201 0.2708 0.3333 0.2527
As a result, the market shares for product 1 and 2 are 31.19% and 30.09% respectively.
Profitability
Using the above market shares and the conditions provided by SONY the profitability of
the new products is exhibited in the table below.
Product profile Marke
t share
Base
cost
Featur
e cost
Total
variable cost
Sales Price Profit
1 SONY 75 in 120 HZ 4000
Pixels $9000
31.19% $800 $600 $1,400 31187 $9,00
0
$235,022,90
6
2 SONY 65 in 120 HZ 4000
Pixels $9000
30.09% $800 $0 $800 30088 $9,00
0
$244,719,95
0
Recommendations
As evident, the product (SONY 65 in 120 HZ 4000 Pixels $9000) tends to generate more
profit than (SONY 65 in 120 HZ 4000 Pixels $9000) thus it is recommendable for SONY
company to adopt and manufacture the later product profile.
Curved TV 12
References
Adrian, M. (2014, December 4). Conjoint Analysis. Retrieved from Cleverism Website:
https://www.cleverism.com/conjoint-analysis-what-why-how/
Allen, M. (2017). Conjoint Analysis. The SAGE Encyclopedia of Communication Research
Methods, 12-15. doi:https://dx.doi.org/10.4135/9781483381411.n89
Brooks, C. (2014, April 1). What is Conjoint Analysis? Retrieved from Business New Daily:
https://www.businessnewsdaily.com/6161-conjoint-analysis.html
Partani, M. (2010, March 26). Conjoint Analysis . Retrieved from Slide Share:
https://www.slideshare.net/madhusudanpartani/conjoint-analysis-3566217?next_slideshow=1
Weedmark, D. (2018, Novermber 11). Definition of Consumer Preference. Retrieved from
Bizfluent Website: https://bizfluent.com/info-8698883-definition-consumer-preference.html
⊘ This is a preview!⊘
Do you want full access?
Subscribe today to unlock all pages.
Trusted by 1+ million students worldwide
1 out of 12
Related Documents


Your All-in-One AI-Powered Toolkit for Academic Success.
+13062052269
info@desklib.com
Available 24*7 on WhatsApp / Email
![[object Object]](/_next/static/media/star-bottom.7253800d.svg)
Unlock your academic potential
Copyright © 2020–2026 A2Z Services. All Rights Reserved. Developed and managed by ZUCOL.