Deakin University: Marketing Analytics Report on Consumer Behavior
VerifiedAdded on 2022/12/21
|11
|3707
|67
Report
AI Summary
This marketing analytics report analyzes consumer preferences for television attributes, focusing on branding, screen size, resolution, refresh rate, and price. The report utilizes regression analysis to identify the relationship between these attributes and consumer preferences, considering existing product profiles from companies like SONY, LG and Samsung. The study constructs various product profiles that SONY could offer, followed by a discussion on purchase probabilities and market share estimations of each profile. The analysis includes conjoint analysis to determine the most profitable product profiles, incorporating screen size, refresh rate, resolution, and price. The report uses the SONY_Data.xlsx file to derive the analysis and provides insights into how different TV attributes influence consumer buying behavior. It also provides the importance of each attribute from consumer perspectives to identify the most preferred product profile.
MARKETING ANALYTICS
MARKETING ANALYTICS
MARKETING ANALYTICS
Paraphrase This Document
Need a fresh take? Get an instant paraphrase of this document with our AI Paraphraser
2
MARKETING ANALYTICS
Table of Contents
1. The importance of different TV attributes in relation to the determination of consumer
preferences.......................................................................................................................................3
2. Identification of the appropriate product profile.........................................................................5
a. Discussion over regression.......................................................................................................5
b. Construction of all product possible profiles that SONY can offer.........................................7
c. Conduct discussion on purchase probabilities of each new product with respect to two
existing products in the market....................................................................................................9
3. Purchase probabilities of each new product with respect to two existing products in the market
along with estimating the market share of each product profile......................................................9
References......................................................................................................................................10
3
MARKETING ANALYTICS
1. The importance of different TV attributes in relation to the determination of consumer
preferences
In the era of technological revolution, television always faced constant transformation in relation
to different attributes. From black and white CRT display to ultra-sleek curved TV, it is quite an
astonishing journey itself. Curved TVs are the most promising product in the consumer
electronics and home entertainment domain. Performance is one of the key deliverables of
curved TVs and the viewing experience is also top-notch in these devices. Due to a lot of options
in the market of Television, customers are currently looking for some specific attributes that
fulfill their needs (Wedel and Kannan, 2016). A number of attributes are considered before
buying a TV in this day. The attributes can be changed according to the segment. However some
of the key attributes are similar irrespective of the segment. In this context the attributes of
Television from consumer perspectives can be explained effectively.
General Attributes
Customers tend to have different priorities before buying a new television. A number of factors
determine the set of requirements of a specific consumer. The most important features that are
considered by consumers are brands, resolution, screen size, refresh rate, resolution and price.
Each of the attributes has certain importance for which it is taken into account from the
perspectives of the consumers. In this segment, the importance of each of the attributes can be
identified.
Importance of Branding
Branding is one of the most effective marketing strategies that are consumed in the contemporary
perspectives. Branding can be extremely effective in terms of making a memorable impression
on the customers. Besides, it also portrays the level of expectation an individual can seek from a
particular product. Especially in the consumer electronics market, branding plays an important
role. Consumers in the home entertainment segment look for reliable brands to buy the product
from (Nair et al. 2017). Therefore in other words, it can be said that branding can significantly
increase the value of the business. The customer satisfaction is also fostered by branding. thus, it
is one of the key attributes in terms of buying a television.
Importance of Screen Size
⊘ This is a preview!⊘
Do you want full access?
Subscribe today to unlock all pages.
Trusted by 1+ million students worldwide
4
MARKETING ANALYTICS
Screen size is one of the prime determinants in terms of buying a new TV. Most of the customers
go for higher screen size as it provides an improved viewing experience to the consumers. It can
be stated that televisions with different screen sizes are developed by most of the manufacturing
companies (Erevelles et al. 2016). For this reason televisions generally manufactured in a
number of different screen sizes. However, there are some external aspects such as the size of the
room can also be an influence in terms of choosing the right screen size as per the need of the
consumers.
Importance of Resolution
The importance of resolution is also quite diverse in nature in relation to buying a new television.
It can be identified that the resolution is a key aspect in relation to buying a new TV. Typically
resolution describes the number of pixels there are in both vertical and horizontal alignment.
Therefore, it can be said that the higher the resolution, an image will look more sharp and
prominent. It can be identified that televisions with different resolutions are offered by different
brands. Therefore, the importance of resolution is higher while buying a new set of television.
Importance of Refresh Rate
In order to show a moving image effectively, a television needs to change the pixels displayed on
a screen. It is known as the refresh rate of the television. Typically a standard television has a
refresh rate of 60 Hz (Deng, et al. 2015). It suggests that the screen shows an image 60 times a
second. The refresh rate is one of the most important constraints while buying a new television
and it has a distinct importance in the customer perspectives.
Importance of Price
Price is one of the prime concerns of consumers when it comes to buy a new television. It can be
identified that there is a significant difference in price between TVs with different specifications.
Based on the bu8dget and the requirements of the customer, the appropriate model is chosen by
the customer. Therefore, the pricing is required to be managed in such a manner that customer
can get a new television according to the budget.
Television, electronic media, does not simply determine the number of spectators watching a
specific show. No tickets to count, no vouchers to clip or unsold newspapers to return. In case of
discussing customer’s buying behaviour towards television and those are;
Introduction to LED TV- It is known as the flat panel display that gets used by the use of LED
backlighting so that cold cathode fluorescent (CCFL) backlighting by using other LCDs. In case
Paraphrase This Document
Need a fresh take? Get an instant paraphrase of this document with our AI Paraphraser
5
MARKETING ANALYTICS
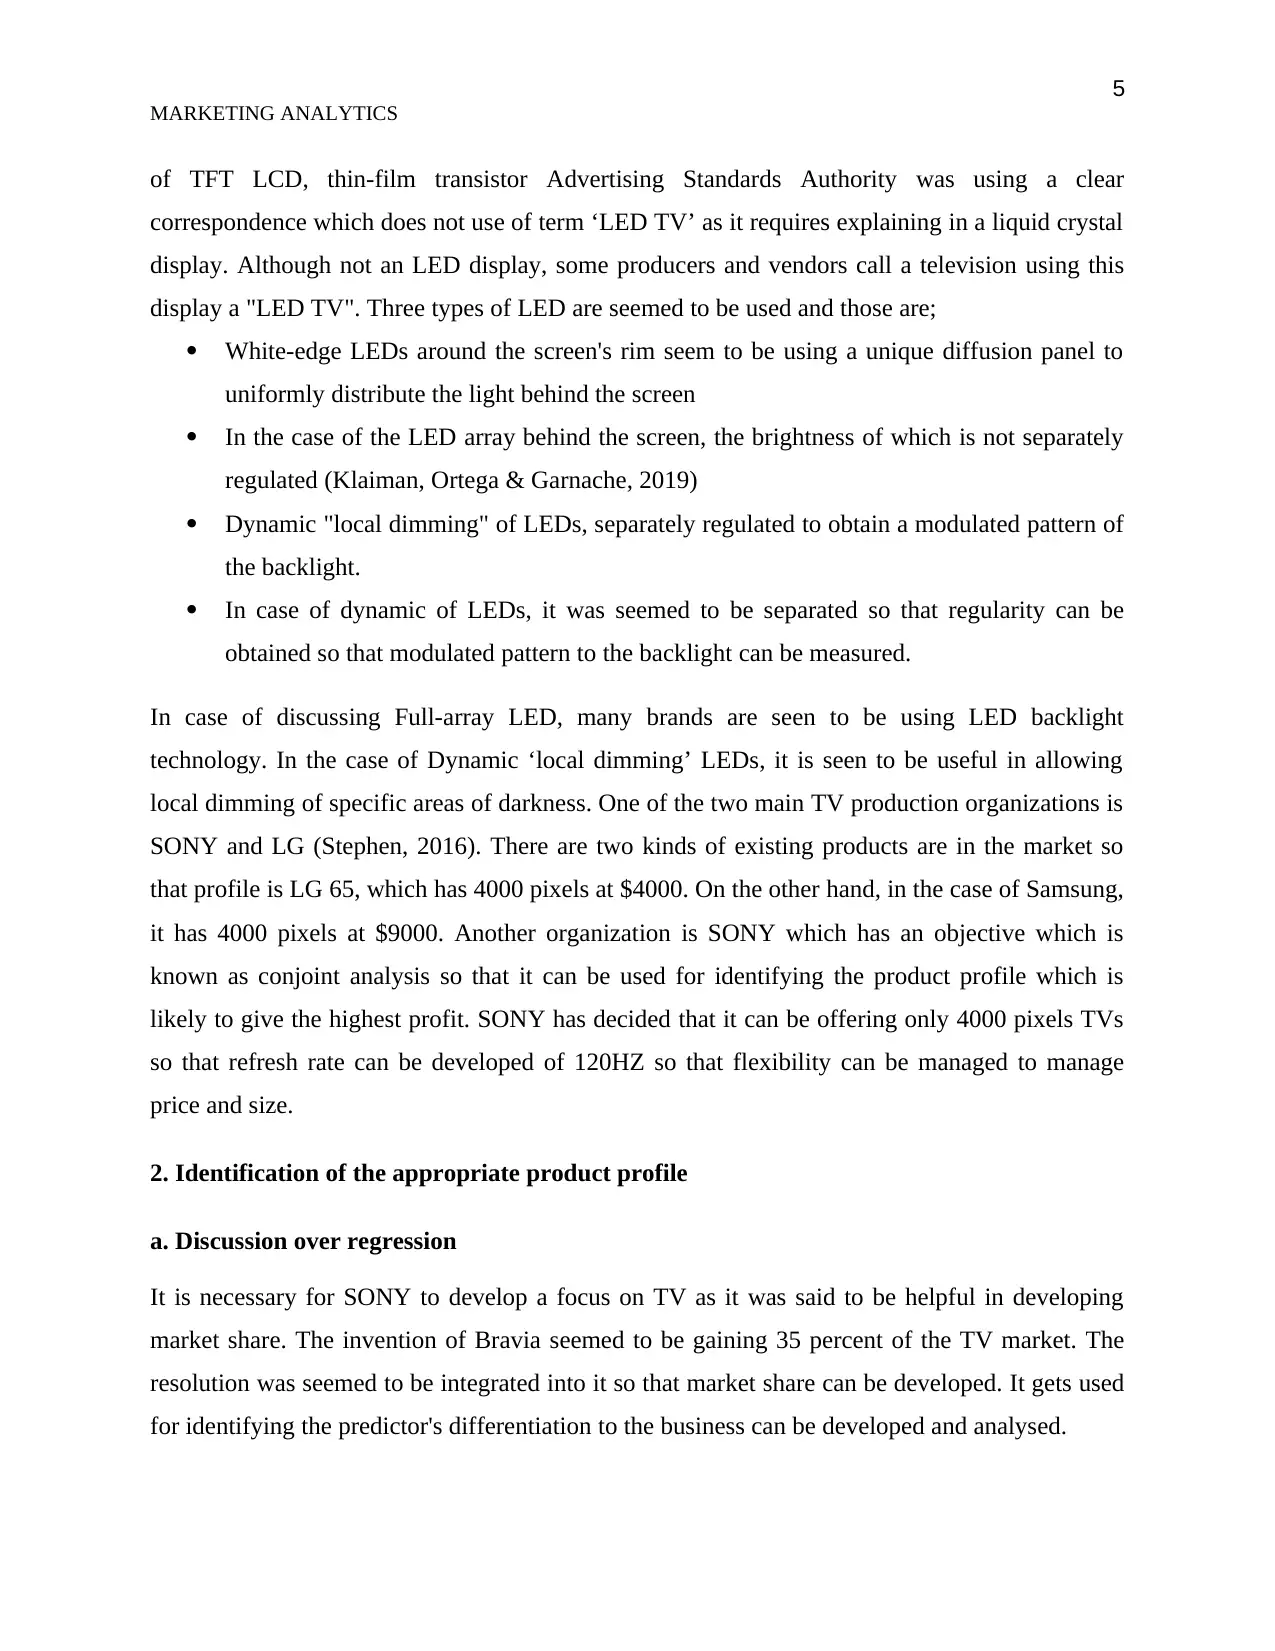
of TFT LCD, thin-film transistor Advertising Standards Authority was using a clear
correspondence which does not use of term ‘LED TV’ as it requires explaining in a liquid crystal
display. Although not an LED display, some producers and vendors call a television using this
display a "LED TV". Three types of LED are seemed to be used and those are;
White-edge LEDs around the screen's rim seem to be using a unique diffusion panel to
uniformly distribute the light behind the screen
In the case of the LED array behind the screen, the brightness of which is not separately
regulated (Klaiman, Ortega & Garnache, 2019)
Dynamic "local dimming" of LEDs, separately regulated to obtain a modulated pattern of
the backlight.
In case of dynamic of LEDs, it was seemed to be separated so that regularity can be
obtained so that modulated pattern to the backlight can be measured.
In case of discussing Full-array LED, many brands are seen to be using LED backlight
technology. In the case of Dynamic ‘local dimming’ LEDs, it is seen to be useful in allowing
local dimming of specific areas of darkness. One of the two main TV production organizations is
SONY and LG (Stephen, 2016). There are two kinds of existing products are in the market so
that profile is LG 65, which has 4000 pixels at $4000. On the other hand, in the case of Samsung,
it has 4000 pixels at $9000. Another organization is SONY which has an objective which is
known as conjoint analysis so that it can be used for identifying the product profile which is
likely to give the highest profit. SONY has decided that it can be offering only 4000 pixels TVs
so that refresh rate can be developed of 120HZ so that flexibility can be managed to manage
price and size.
2. Identification of the appropriate product profile
a. Discussion over regression
It is necessary for SONY to develop a focus on TV as it was said to be helpful in developing
market share. The invention of Bravia seemed to be gaining 35 percent of the TV market. The
resolution was seemed to be integrated into it so that market share can be developed. It gets used
for identifying the predictor's differentiation to the business can be developed and analysed.
MARKETING ANALYTICS
of TFT LCD, thin-film transistor Advertising Standards Authority was using a clear
correspondence which does not use of term ‘LED TV’ as it requires explaining in a liquid crystal
display. Although not an LED display, some producers and vendors call a television using this
display a "LED TV". Three types of LED are seemed to be used and those are;
White-edge LEDs around the screen's rim seem to be using a unique diffusion panel to
uniformly distribute the light behind the screen
In the case of the LED array behind the screen, the brightness of which is not separately
regulated (Klaiman, Ortega & Garnache, 2019)
Dynamic "local dimming" of LEDs, separately regulated to obtain a modulated pattern of
the backlight.
In case of dynamic of LEDs, it was seemed to be separated so that regularity can be
obtained so that modulated pattern to the backlight can be measured.
In case of discussing Full-array LED, many brands are seen to be using LED backlight
technology. In the case of Dynamic ‘local dimming’ LEDs, it is seen to be useful in allowing
local dimming of specific areas of darkness. One of the two main TV production organizations is
SONY and LG (Stephen, 2016). There are two kinds of existing products are in the market so
that profile is LG 65, which has 4000 pixels at $4000. On the other hand, in the case of Samsung,
it has 4000 pixels at $9000. Another organization is SONY which has an objective which is
known as conjoint analysis so that it can be used for identifying the product profile which is
likely to give the highest profit. SONY has decided that it can be offering only 4000 pixels TVs
so that refresh rate can be developed of 120HZ so that flexibility can be managed to manage
price and size.
2. Identification of the appropriate product profile
a. Discussion over regression
It is necessary for SONY to develop a focus on TV as it was said to be helpful in developing
market share. The invention of Bravia seemed to be gaining 35 percent of the TV market. The
resolution was seemed to be integrated into it so that market share can be developed. It gets used
for identifying the predictor's differentiation to the business can be developed and analysed.
6
MARKETING ANALYTICS
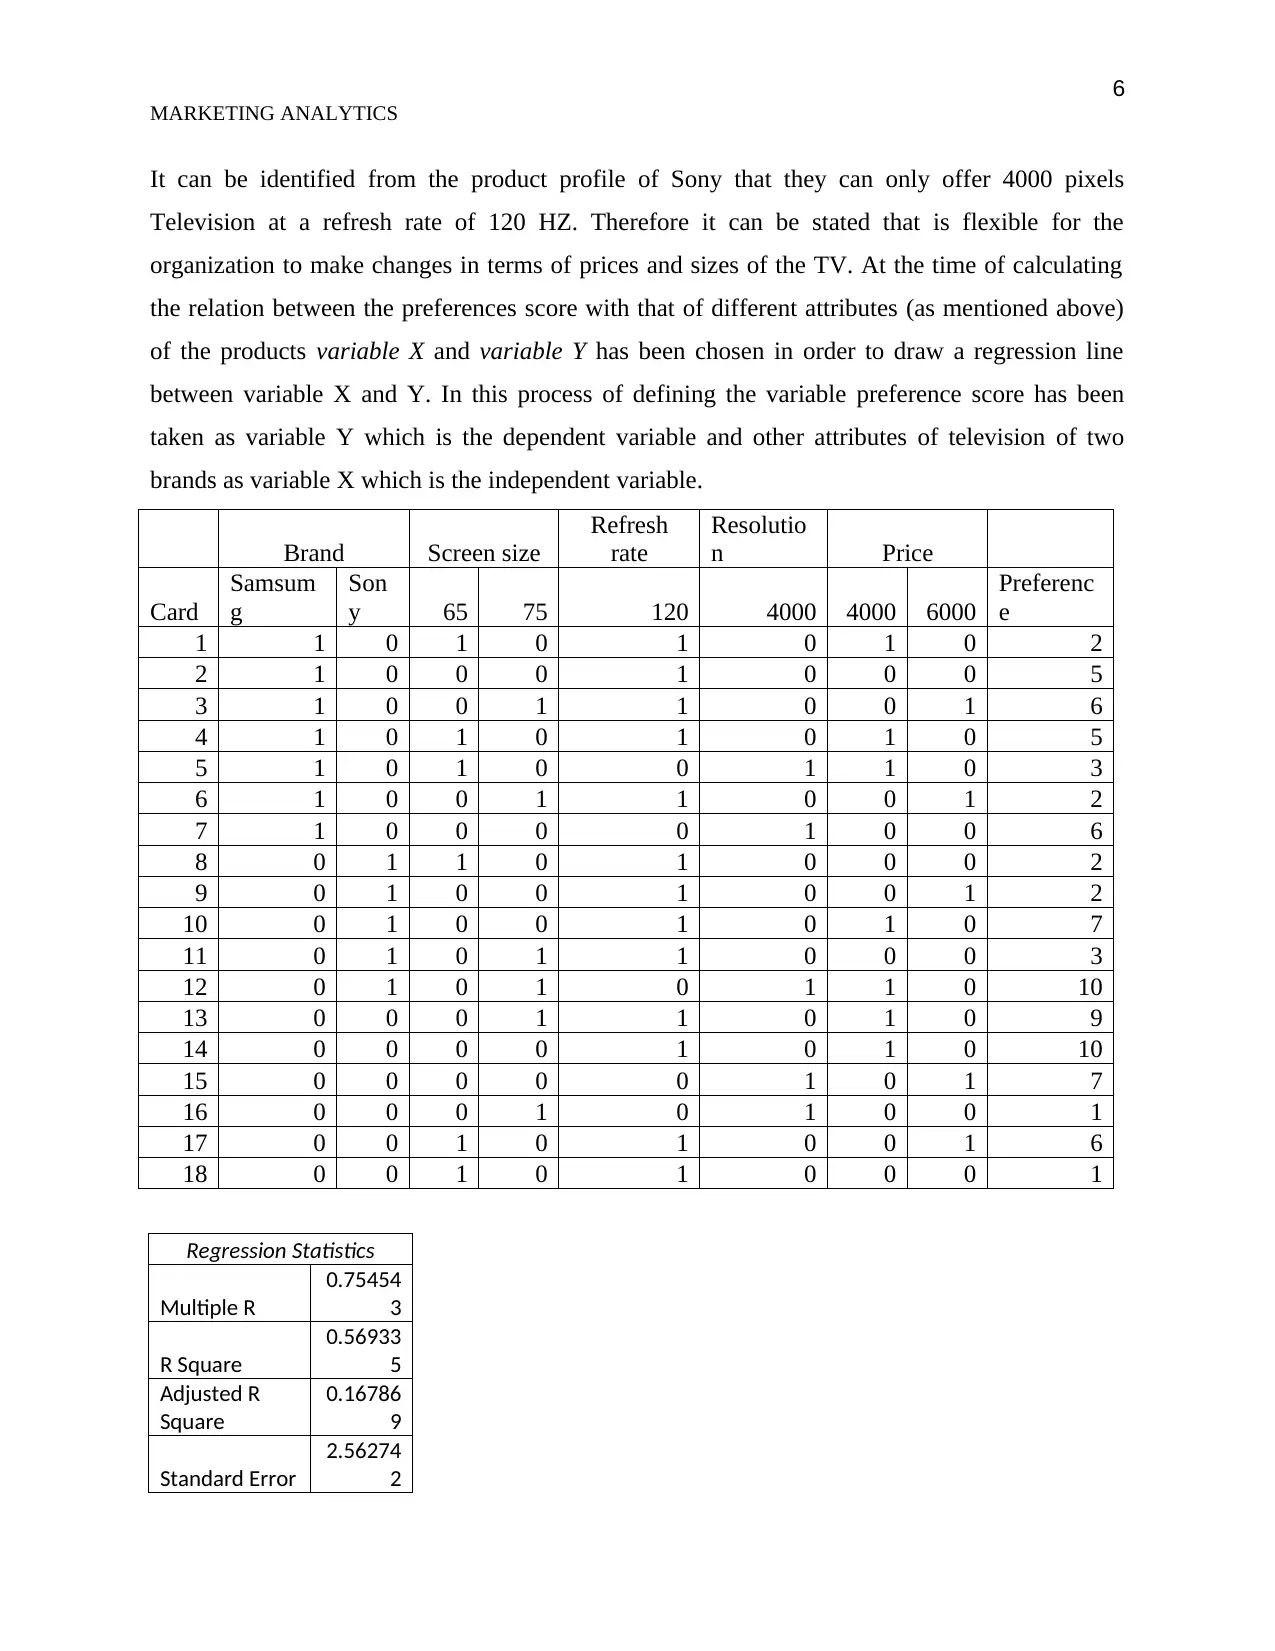
It can be identified from the product profile of Sony that they can only offer 4000 pixels
Television at a refresh rate of 120 HZ. Therefore it can be stated that is flexible for the
organization to make changes in terms of prices and sizes of the TV. At the time of calculating
the relation between the preferences score with that of different attributes (as mentioned above)
of the products variable X and variable Y has been chosen in order to draw a regression line
between variable X and Y. In this process of defining the variable preference score has been
taken as variable Y which is the dependent variable and other attributes of television of two
brands as variable X which is the independent variable.
Brand Screen size
Refresh
rate
Resolutio
n Price
Card
Samsum
g
Son
y 65 75 120 4000 4000 6000
Preferenc
e
1 1 0 1 0 1 0 1 0 2
2 1 0 0 0 1 0 0 0 5
3 1 0 0 1 1 0 0 1 6
4 1 0 1 0 1 0 1 0 5
5 1 0 1 0 0 1 1 0 3
6 1 0 0 1 1 0 0 1 2
7 1 0 0 0 0 1 0 0 6
8 0 1 1 0 1 0 0 0 2
9 0 1 0 0 1 0 0 1 2
10 0 1 0 0 1 0 1 0 7
11 0 1 0 1 1 0 0 0 3
12 0 1 0 1 0 1 1 0 10
13 0 0 0 1 1 0 1 0 9
14 0 0 0 0 1 0 1 0 10
15 0 0 0 0 0 1 0 1 7
16 0 0 0 1 0 1 0 0 1
17 0 0 1 0 1 0 0 1 6
18 0 0 1 0 1 0 0 0 1
Regression Statistics
Multiple R
0.75454
3
R Square
0.56933
5
Adjusted R
Square
0.16786
9
Standard Error
2.56274
2
MARKETING ANALYTICS
It can be identified from the product profile of Sony that they can only offer 4000 pixels
Television at a refresh rate of 120 HZ. Therefore it can be stated that is flexible for the
organization to make changes in terms of prices and sizes of the TV. At the time of calculating
the relation between the preferences score with that of different attributes (as mentioned above)
of the products variable X and variable Y has been chosen in order to draw a regression line
between variable X and Y. In this process of defining the variable preference score has been
taken as variable Y which is the dependent variable and other attributes of television of two
brands as variable X which is the independent variable.
Brand Screen size
Refresh
rate
Resolutio
n Price
Card
Samsum
g
Son
y 65 75 120 4000 4000 6000
Preferenc
e
1 1 0 1 0 1 0 1 0 2
2 1 0 0 0 1 0 0 0 5
3 1 0 0 1 1 0 0 1 6
4 1 0 1 0 1 0 1 0 5
5 1 0 1 0 0 1 1 0 3
6 1 0 0 1 1 0 0 1 2
7 1 0 0 0 0 1 0 0 6
8 0 1 1 0 1 0 0 0 2
9 0 1 0 0 1 0 0 1 2
10 0 1 0 0 1 0 1 0 7
11 0 1 0 1 1 0 0 0 3
12 0 1 0 1 0 1 1 0 10
13 0 0 0 1 1 0 1 0 9
14 0 0 0 0 1 0 1 0 10
15 0 0 0 0 0 1 0 1 7
16 0 0 0 1 0 1 0 0 1
17 0 0 1 0 1 0 0 1 6
18 0 0 1 0 1 0 0 0 1
Regression Statistics
Multiple R
0.75454
3
R Square
0.56933
5
Adjusted R
Square
0.16786
9
Standard Error
2.56274
2
⊘ This is a preview!⊘
Do you want full access?
Subscribe today to unlock all pages.
Trusted by 1+ million students worldwide
7
MARKETING ANALYTICS
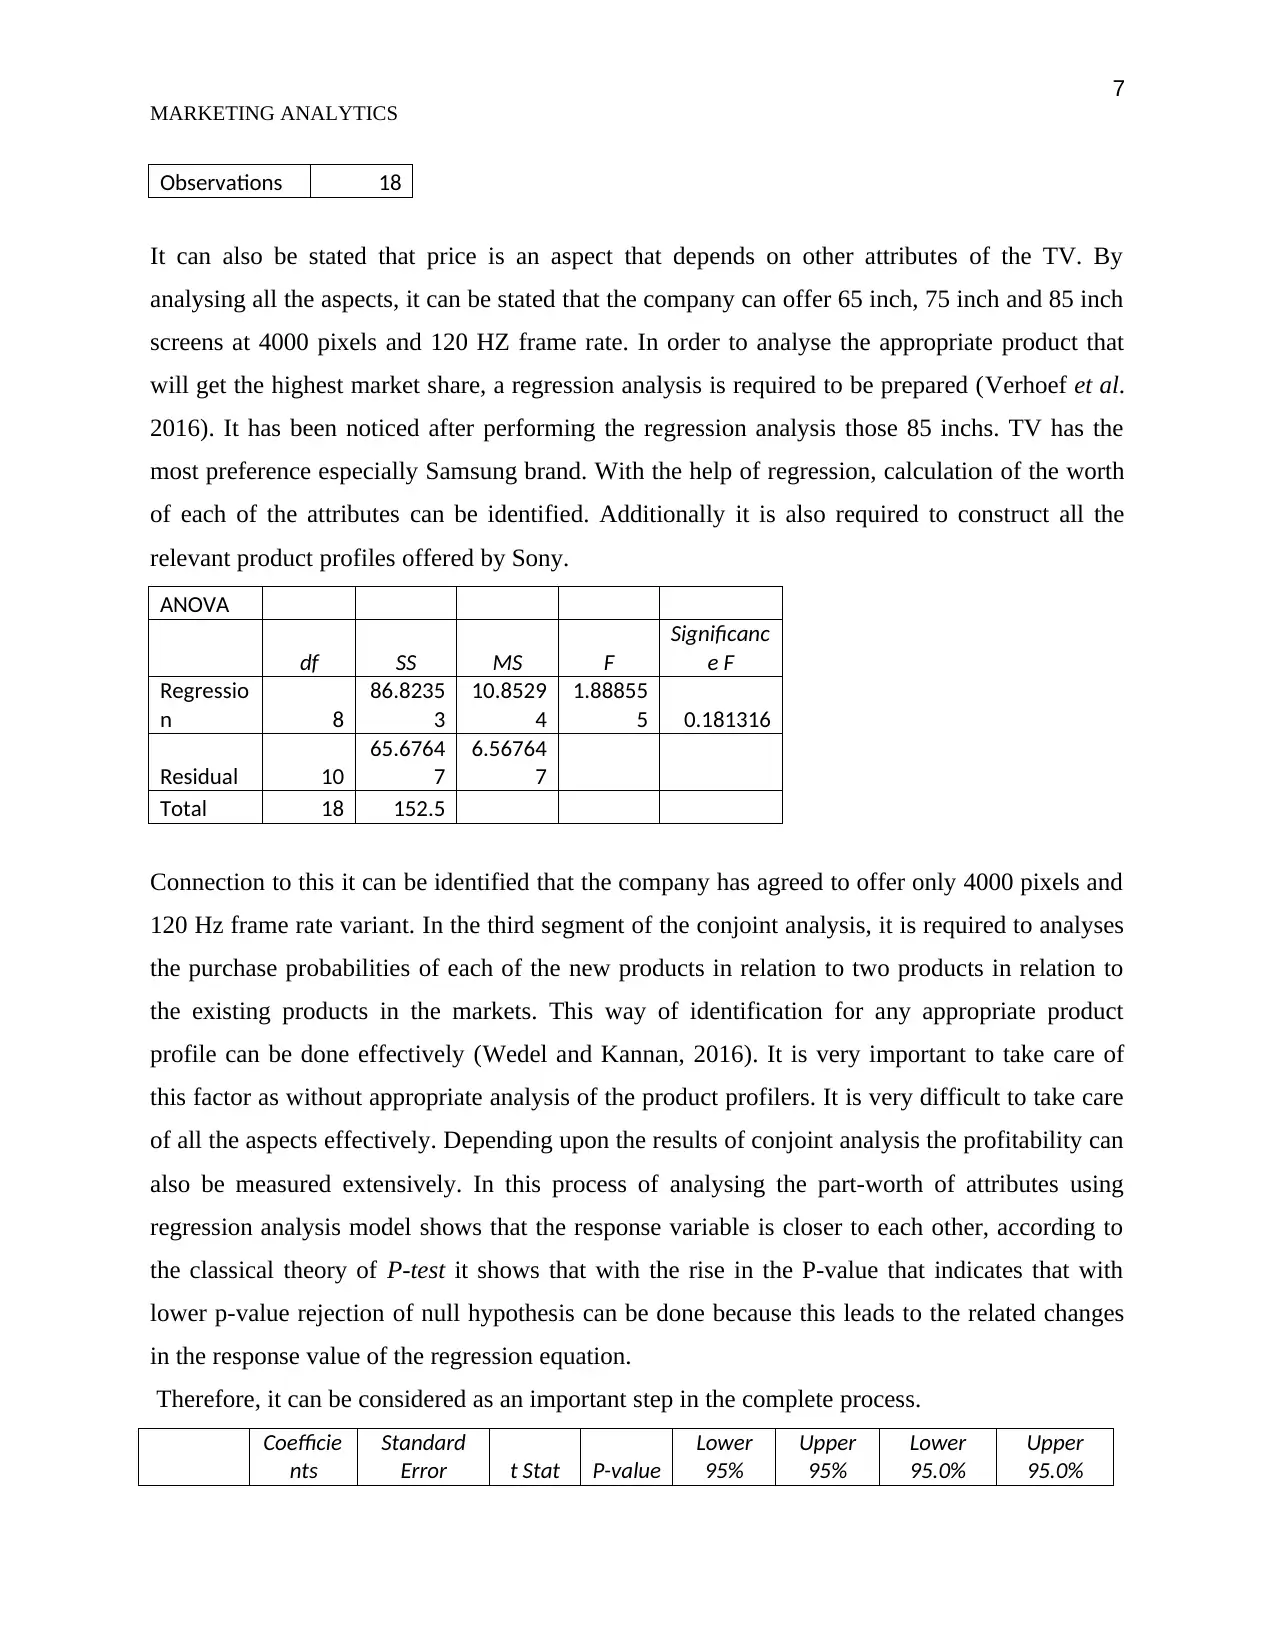
Observations 18
It can also be stated that price is an aspect that depends on other attributes of the TV. By
analysing all the aspects, it can be stated that the company can offer 65 inch, 75 inch and 85 inch
screens at 4000 pixels and 120 HZ frame rate. In order to analyse the appropriate product that
will get the highest market share, a regression analysis is required to be prepared (Verhoef et al.
2016). It has been noticed after performing the regression analysis those 85 inchs. TV has the
most preference especially Samsung brand. With the help of regression, calculation of the worth
of each of the attributes can be identified. Additionally it is also required to construct all the
relevant product profiles offered by Sony.
ANOVA
df SS MS F
Significanc
e F
Regressio
n 8
86.8235
3
10.8529
4
1.88855
5 0.181316
Residual 10
65.6764
7
6.56764
7
Total 18 152.5
Connection to this it can be identified that the company has agreed to offer only 4000 pixels and
120 Hz frame rate variant. In the third segment of the conjoint analysis, it is required to analyses
the purchase probabilities of each of the new products in relation to two products in relation to
the existing products in the markets. This way of identification for any appropriate product
profile can be done effectively (Wedel and Kannan, 2016). It is very important to take care of
this factor as without appropriate analysis of the product profilers. It is very difficult to take care
of all the aspects effectively. Depending upon the results of conjoint analysis the profitability can
also be measured extensively. In this process of analysing the part-worth of attributes using
regression analysis model shows that the response variable is closer to each other, according to
the classical theory of P-test it shows that with the rise in the P-value that indicates that with
lower p-value rejection of null hypothesis can be done because this leads to the related changes
in the response value of the regression equation.
Therefore, it can be considered as an important step in the complete process.
Coefficie
nts
Standard
Error t Stat P-value
Lower
95%
Upper
95%
Lower
95.0%
Upper
95.0%
MARKETING ANALYTICS
Observations 18
It can also be stated that price is an aspect that depends on other attributes of the TV. By
analysing all the aspects, it can be stated that the company can offer 65 inch, 75 inch and 85 inch
screens at 4000 pixels and 120 HZ frame rate. In order to analyse the appropriate product that
will get the highest market share, a regression analysis is required to be prepared (Verhoef et al.
2016). It has been noticed after performing the regression analysis those 85 inchs. TV has the
most preference especially Samsung brand. With the help of regression, calculation of the worth
of each of the attributes can be identified. Additionally it is also required to construct all the
relevant product profiles offered by Sony.
ANOVA
df SS MS F
Significanc
e F
Regressio
n 8
86.8235
3
10.8529
4
1.88855
5 0.181316
Residual 10
65.6764
7
6.56764
7
Total 18 152.5
Connection to this it can be identified that the company has agreed to offer only 4000 pixels and
120 Hz frame rate variant. In the third segment of the conjoint analysis, it is required to analyses
the purchase probabilities of each of the new products in relation to two products in relation to
the existing products in the markets. This way of identification for any appropriate product
profile can be done effectively (Wedel and Kannan, 2016). It is very important to take care of
this factor as without appropriate analysis of the product profilers. It is very difficult to take care
of all the aspects effectively. Depending upon the results of conjoint analysis the profitability can
also be measured extensively. In this process of analysing the part-worth of attributes using
regression analysis model shows that the response variable is closer to each other, according to
the classical theory of P-test it shows that with the rise in the P-value that indicates that with
lower p-value rejection of null hypothesis can be done because this leads to the related changes
in the response value of the regression equation.
Therefore, it can be considered as an important step in the complete process.
Coefficie
nts
Standard
Error t Stat P-value
Lower
95%
Upper
95%
Lower
95.0%
Upper
95.0%
Paraphrase This Document
Need a fresh take? Get an instant paraphrase of this document with our AI Paraphraser
8
MARKETING ANALYTICS
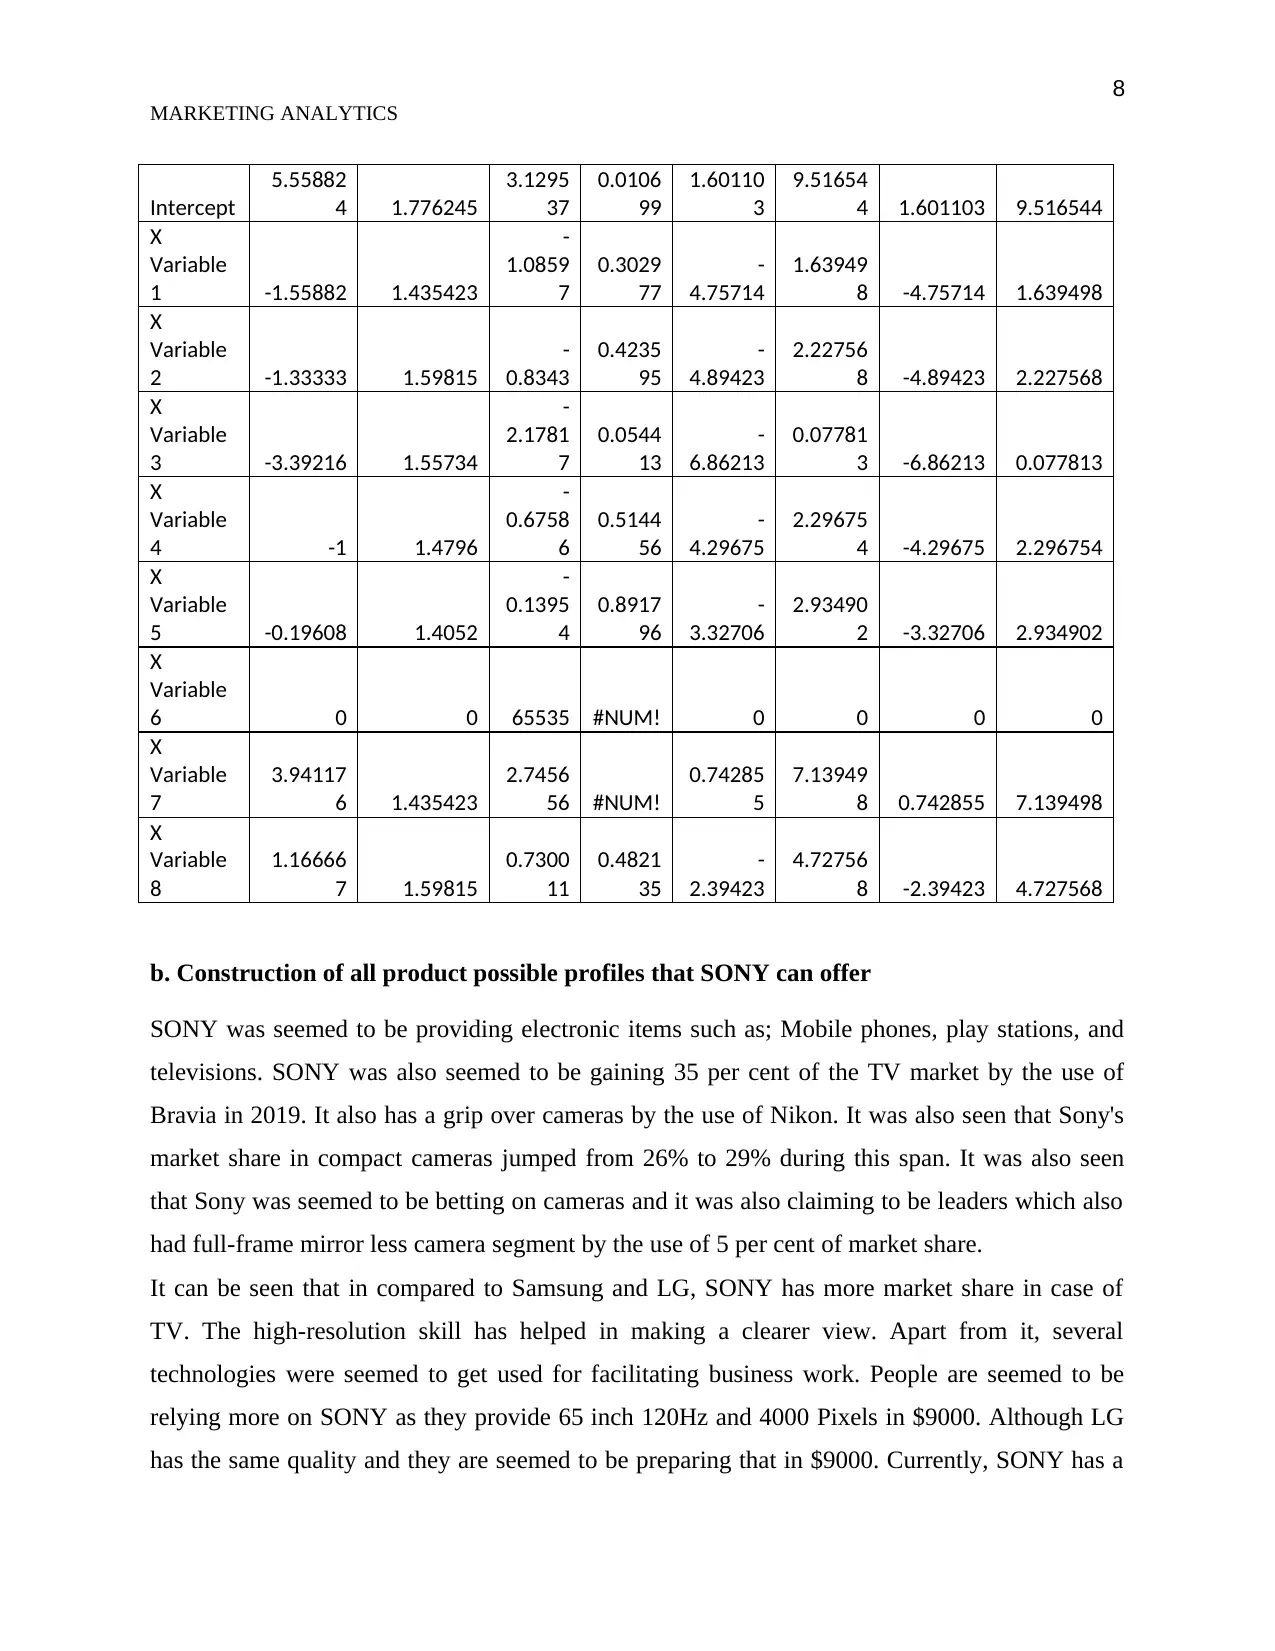
Intercept
5.55882
4 1.776245
3.1295
37
0.0106
99
1.60110
3
9.51654
4 1.601103 9.516544
X
Variable
1 -1.55882 1.435423
-
1.0859
7
0.3029
77
-
4.75714
1.63949
8 -4.75714 1.639498
X
Variable
2 -1.33333 1.59815
-
0.8343
0.4235
95
-
4.89423
2.22756
8 -4.89423 2.227568
X
Variable
3 -3.39216 1.55734
-
2.1781
7
0.0544
13
-
6.86213
0.07781
3 -6.86213 0.077813
X
Variable
4 -1 1.4796
-
0.6758
6
0.5144
56
-
4.29675
2.29675
4 -4.29675 2.296754
X
Variable
5 -0.19608 1.4052
-
0.1395
4
0.8917
96
-
3.32706
2.93490
2 -3.32706 2.934902
X
Variable
6 0 0 65535 #NUM! 0 0 0 0
X
Variable
7
3.94117
6 1.435423
2.7456
56 #NUM!
0.74285
5
7.13949
8 0.742855 7.139498
X
Variable
8
1.16666
7 1.59815
0.7300
11
0.4821
35
-
2.39423
4.72756
8 -2.39423 4.727568
b. Construction of all product possible profiles that SONY can offer
SONY was seemed to be providing electronic items such as; Mobile phones, play stations, and
televisions. SONY was also seemed to be gaining 35 per cent of the TV market by the use of
Bravia in 2019. It also has a grip over cameras by the use of Nikon. It was also seen that Sony's
market share in compact cameras jumped from 26% to 29% during this span. It was also seen
that Sony was seemed to be betting on cameras and it was also claiming to be leaders which also
had full-frame mirror less camera segment by the use of 5 per cent of market share.
It can be seen that in compared to Samsung and LG, SONY has more market share in case of
TV. The high-resolution skill has helped in making a clearer view. Apart from it, several
technologies were seemed to get used for facilitating business work. People are seemed to be
relying more on SONY as they provide 65 inch 120Hz and 4000 Pixels in $9000. Although LG
has the same quality and they are seemed to be preparing that in $9000. Currently, SONY has a
MARKETING ANALYTICS
Intercept
5.55882
4 1.776245
3.1295
37
0.0106
99
1.60110
3
9.51654
4 1.601103 9.516544
X
Variable
1 -1.55882 1.435423
-
1.0859
7
0.3029
77
-
4.75714
1.63949
8 -4.75714 1.639498
X
Variable
2 -1.33333 1.59815
-
0.8343
0.4235
95
-
4.89423
2.22756
8 -4.89423 2.227568
X
Variable
3 -3.39216 1.55734
-
2.1781
7
0.0544
13
-
6.86213
0.07781
3 -6.86213 0.077813
X
Variable
4 -1 1.4796
-
0.6758
6
0.5144
56
-
4.29675
2.29675
4 -4.29675 2.296754
X
Variable
5 -0.19608 1.4052
-
0.1395
4
0.8917
96
-
3.32706
2.93490
2 -3.32706 2.934902
X
Variable
6 0 0 65535 #NUM! 0 0 0 0
X
Variable
7
3.94117
6 1.435423
2.7456
56 #NUM!
0.74285
5
7.13949
8 0.742855 7.139498
X
Variable
8
1.16666
7 1.59815
0.7300
11
0.4821
35
-
2.39423
4.72756
8 -2.39423 4.727568
b. Construction of all product possible profiles that SONY can offer
SONY was seemed to be providing electronic items such as; Mobile phones, play stations, and
televisions. SONY was also seemed to be gaining 35 per cent of the TV market by the use of
Bravia in 2019. It also has a grip over cameras by the use of Nikon. It was also seen that Sony's
market share in compact cameras jumped from 26% to 29% during this span. It was also seen
that Sony was seemed to be betting on cameras and it was also claiming to be leaders which also
had full-frame mirror less camera segment by the use of 5 per cent of market share.
It can be seen that in compared to Samsung and LG, SONY has more market share in case of
TV. The high-resolution skill has helped in making a clearer view. Apart from it, several
technologies were seemed to get used for facilitating business work. People are seemed to be
relying more on SONY as they provide 65 inch 120Hz and 4000 Pixels in $9000. Although LG
has the same quality and they are seemed to be preparing that in $9000. Currently, SONY has a
9
MARKETING ANALYTICS
market share of 23 per cent and due to their play stations; the organizational seemed to get
popular. After conducting and analysing past researches and market share, it can be noticed that
SONY needs to develop a focus on TV and developing the camera part. SONY was also seemed
to be conducting a conjoint analysis to identify the product profile which is most likely to
succeed in the market.
Thus, participants were taken to the research so that main attributes can be managed to the
business. After identifying the attributes and their levels, SONY collected purchase intentions for
different product profiles using fractional factorial design among 20 participants who are
representative of the population of Australia. Respondents were also seemed to be giving 18
different profiled so that like hood can be developed to the business. The participants were said
to give an answer in 1 to 7 formats so that based upon their desire brands or products can be
ranked. Thus, the data collection method was said to be useful in managing and analysing the
collection of data so that data can be put on excel figure.
The model was integrated into an interactive scoring instrument that enabled the sales force to
respond to opportunities for each of the model predictors and predicted the probability that
prospects would accept a service offer. Develop an interactive tool enabling the sales force to
rapidly determine the probability of a prospective customer buying. It was also seen that in case
of LED array behind the screen, the brightness of which is not separately regulated. Secondary
data analysis helps in analysing data from previous researches. On the other hand, primary data
helps in conducting a survey so that reliable discussion can be gathered to the research. Thus
respondents were chosen and by conducting data analysing, it was seen that SONY was better
than the other two.
c. Conduct discussion on purchase probabilities of each new product with respect to two
existing products in the market
Purchase probability is the scale that gets used for conducting the survey along with analysing
buying intentions so that particular product range can be analysed. It is also seemed to get used
in predicting the actual purchase so that the rate of the population can be analysed from a sample.
In order to conduct Purchase Probability, it is necessary to conduct logistic regression model so
that areas of like hood can be analysed (Chatterjee & Hadi, 2015). People are seemed to be
relying more on SONY as they provide 65 inch 120Hz and 4000 Pixels in $9000.
⊘ This is a preview!⊘
Do you want full access?
Subscribe today to unlock all pages.
Trusted by 1+ million students worldwide
10
MARKETING ANALYTICS
0 20 40 60 80 100 120
0
5
10
15
Normal Probability Plot
Sample Percentile
Y
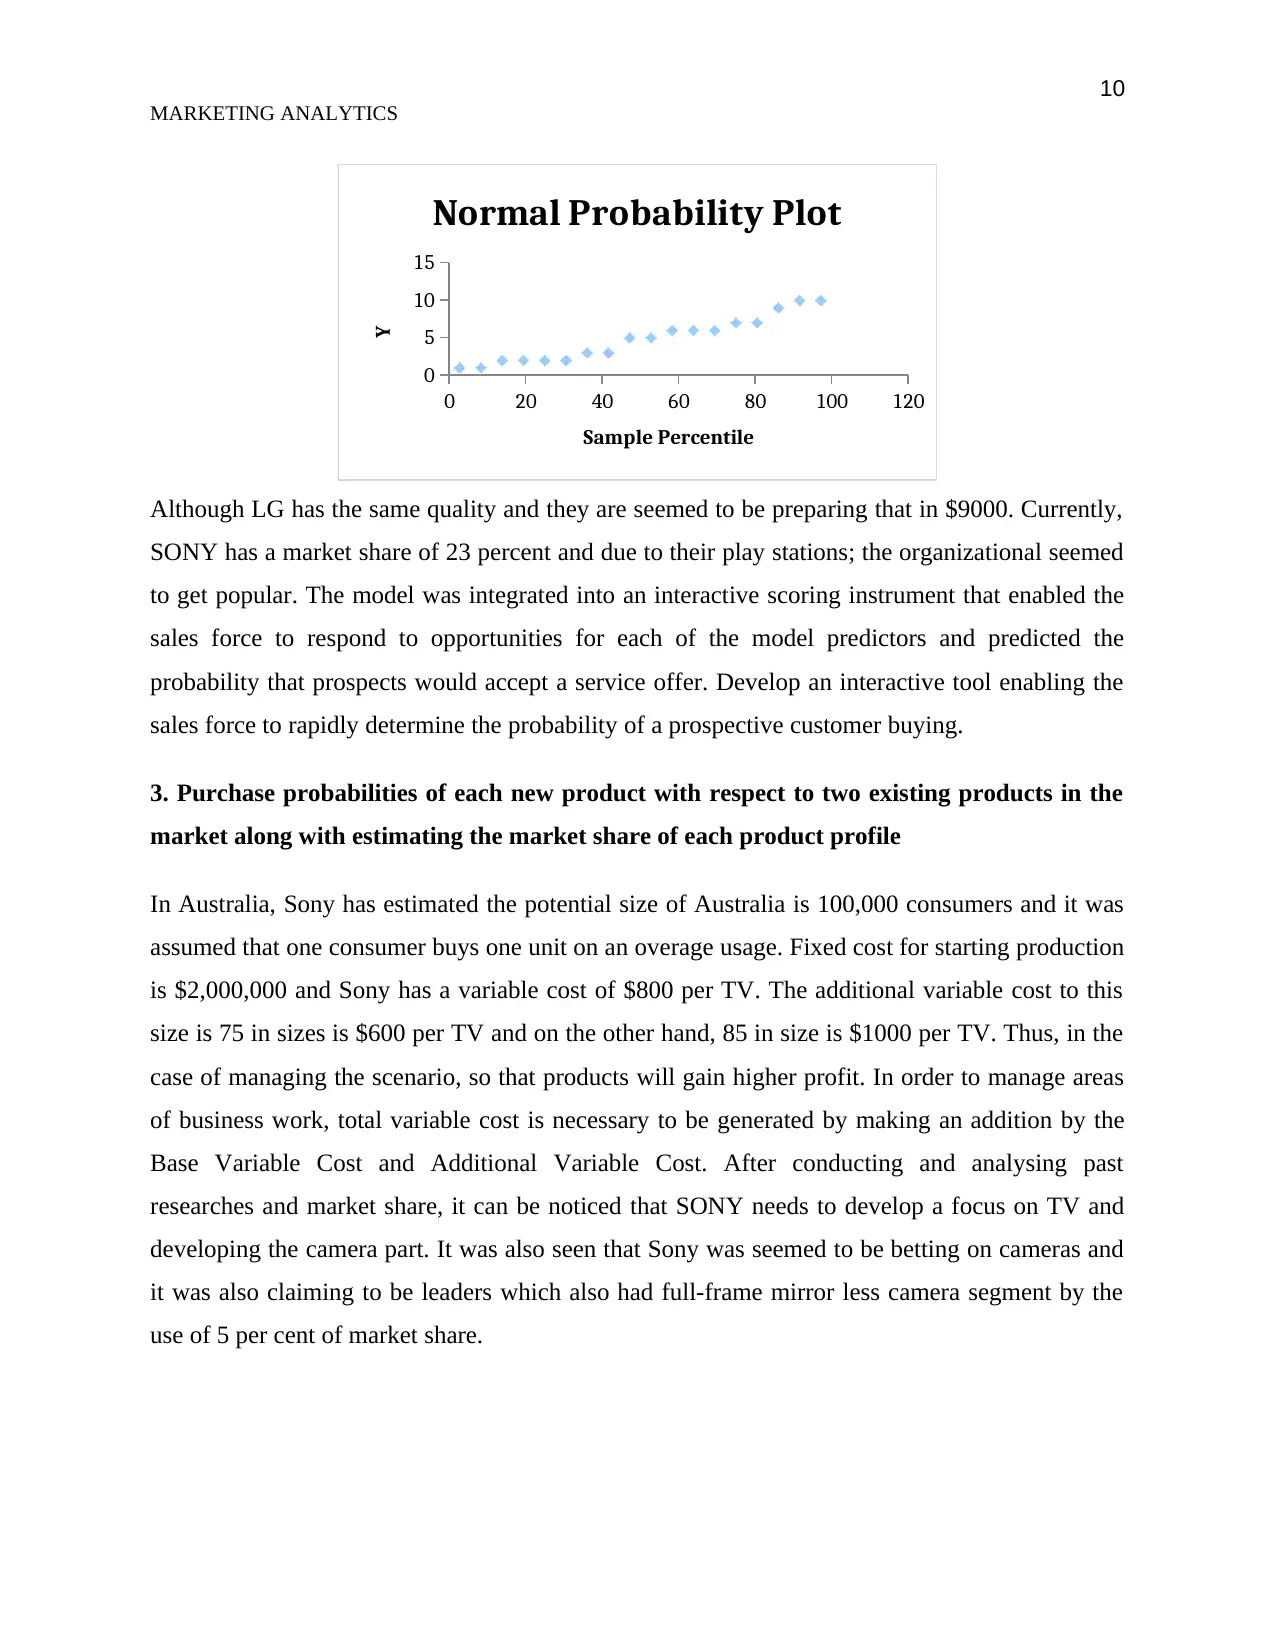
Although LG has the same quality and they are seemed to be preparing that in $9000. Currently,
SONY has a market share of 23 percent and due to their play stations; the organizational seemed
to get popular. The model was integrated into an interactive scoring instrument that enabled the
sales force to respond to opportunities for each of the model predictors and predicted the
probability that prospects would accept a service offer. Develop an interactive tool enabling the
sales force to rapidly determine the probability of a prospective customer buying.
3. Purchase probabilities of each new product with respect to two existing products in the
market along with estimating the market share of each product profile
In Australia, Sony has estimated the potential size of Australia is 100,000 consumers and it was
assumed that one consumer buys one unit on an overage usage. Fixed cost for starting production
is $2,000,000 and Sony has a variable cost of $800 per TV. The additional variable cost to this
size is 75 in sizes is $600 per TV and on the other hand, 85 in size is $1000 per TV. Thus, in the
case of managing the scenario, so that products will gain higher profit. In order to manage areas
of business work, total variable cost is necessary to be generated by making an addition by the
Base Variable Cost and Additional Variable Cost. After conducting and analysing past
researches and market share, it can be noticed that SONY needs to develop a focus on TV and
developing the camera part. It was also seen that Sony was seemed to be betting on cameras and
it was also claiming to be leaders which also had full-frame mirror less camera segment by the
use of 5 per cent of market share.
MARKETING ANALYTICS
0 20 40 60 80 100 120
0
5
10
15
Normal Probability Plot
Sample Percentile
Y
Although LG has the same quality and they are seemed to be preparing that in $9000. Currently,
SONY has a market share of 23 percent and due to their play stations; the organizational seemed
to get popular. The model was integrated into an interactive scoring instrument that enabled the
sales force to respond to opportunities for each of the model predictors and predicted the
probability that prospects would accept a service offer. Develop an interactive tool enabling the
sales force to rapidly determine the probability of a prospective customer buying.
3. Purchase probabilities of each new product with respect to two existing products in the
market along with estimating the market share of each product profile
In Australia, Sony has estimated the potential size of Australia is 100,000 consumers and it was
assumed that one consumer buys one unit on an overage usage. Fixed cost for starting production
is $2,000,000 and Sony has a variable cost of $800 per TV. The additional variable cost to this
size is 75 in sizes is $600 per TV and on the other hand, 85 in size is $1000 per TV. Thus, in the
case of managing the scenario, so that products will gain higher profit. In order to manage areas
of business work, total variable cost is necessary to be generated by making an addition by the
Base Variable Cost and Additional Variable Cost. After conducting and analysing past
researches and market share, it can be noticed that SONY needs to develop a focus on TV and
developing the camera part. It was also seen that Sony was seemed to be betting on cameras and
it was also claiming to be leaders which also had full-frame mirror less camera segment by the
use of 5 per cent of market share.
Paraphrase This Document
Need a fresh take? Get an instant paraphrase of this document with our AI Paraphraser
11
MARKETING ANALYTICS
References List
Chatterjee, S., & Hadi, A. S. (2015). Regression analysis by example. John Wiley & Sons.
https://books.google.co.in/books?
hl=en&lr=&id=zyjWBgAAQBAJ&oi=fnd&pg=PP1&dq=regression+analysis&ots=OZg
FeV0ShV&sig=TmJ-ju9FD5R_dIW9Ppe9SGaQ3zE
Deng, L., Gao, J. and Vuppalapati, C., 2015, March. Building a big data analytics service
framework for mobile advertising and marketing. In 2015 IEEE First International
Conference on Big Data Computing Service and Applications 256-266. IEEE.
Erevelles, S., Fukawa, N. and Swayne, L. 2016. Big Data consumer analytics and the
transformation of marketing. Journal of Business Research, 69(2), pp.897-904.
Klaiman, K., Ortega, D. L., & Garnache, C. (2016). Consumer preferences and demand for
packaging material and recyclability. Resources, Conservation and Recycling, 115, 1-8.
https://pdfs.semanticscholar.org/7ba8/466e6d11e51629fb0818e0bf93c5e978183e.pdf
Nair, H. S., Misra, S., Hornbuckle IV, W. J., Mishra, R., & Acharya, A. (2017). Big data and
marketing analytics in gaming: Combining empirical models and field
experimentation. Marketing Science, 36(5), pp.699-725.
Stephen, A. T. (2016). The role of digital and social media marketing in consumer behavior.
Current Opinion in Psychology, 10, 17-21.
http://eureka.sbs.ox.ac.uk/5851/1/Stephen_CurrentOpinionPsych_101215.pdf
Verhoef, P.C., Kooge, E. and A. Walk, N., 2016. Creating value with big data analytics: Making
smarter marketing decisions. Routledge.
Wedel, M., and Kannan, P. K. 2016. Marketing analytics for data-rich environments. Journal of
Marketing, 80(6), (pp.97-121).
1 out of 11
Related Documents


Your All-in-One AI-Powered Toolkit for Academic Success.
+13062052269
info@desklib.com
Available 24*7 on WhatsApp / Email
![[object Object]](/_next/static/media/star-bottom.7253800d.svg)
Unlock your academic potential
Copyright © 2020–2026 A2Z Services. All Rights Reserved. Developed and managed by ZUCOL.