Marketing and Management Assignment: Cost, Volume, Profit Analysis
VerifiedAdded on 2023/01/19
|14
|2069
|94
Homework Assignment
AI Summary
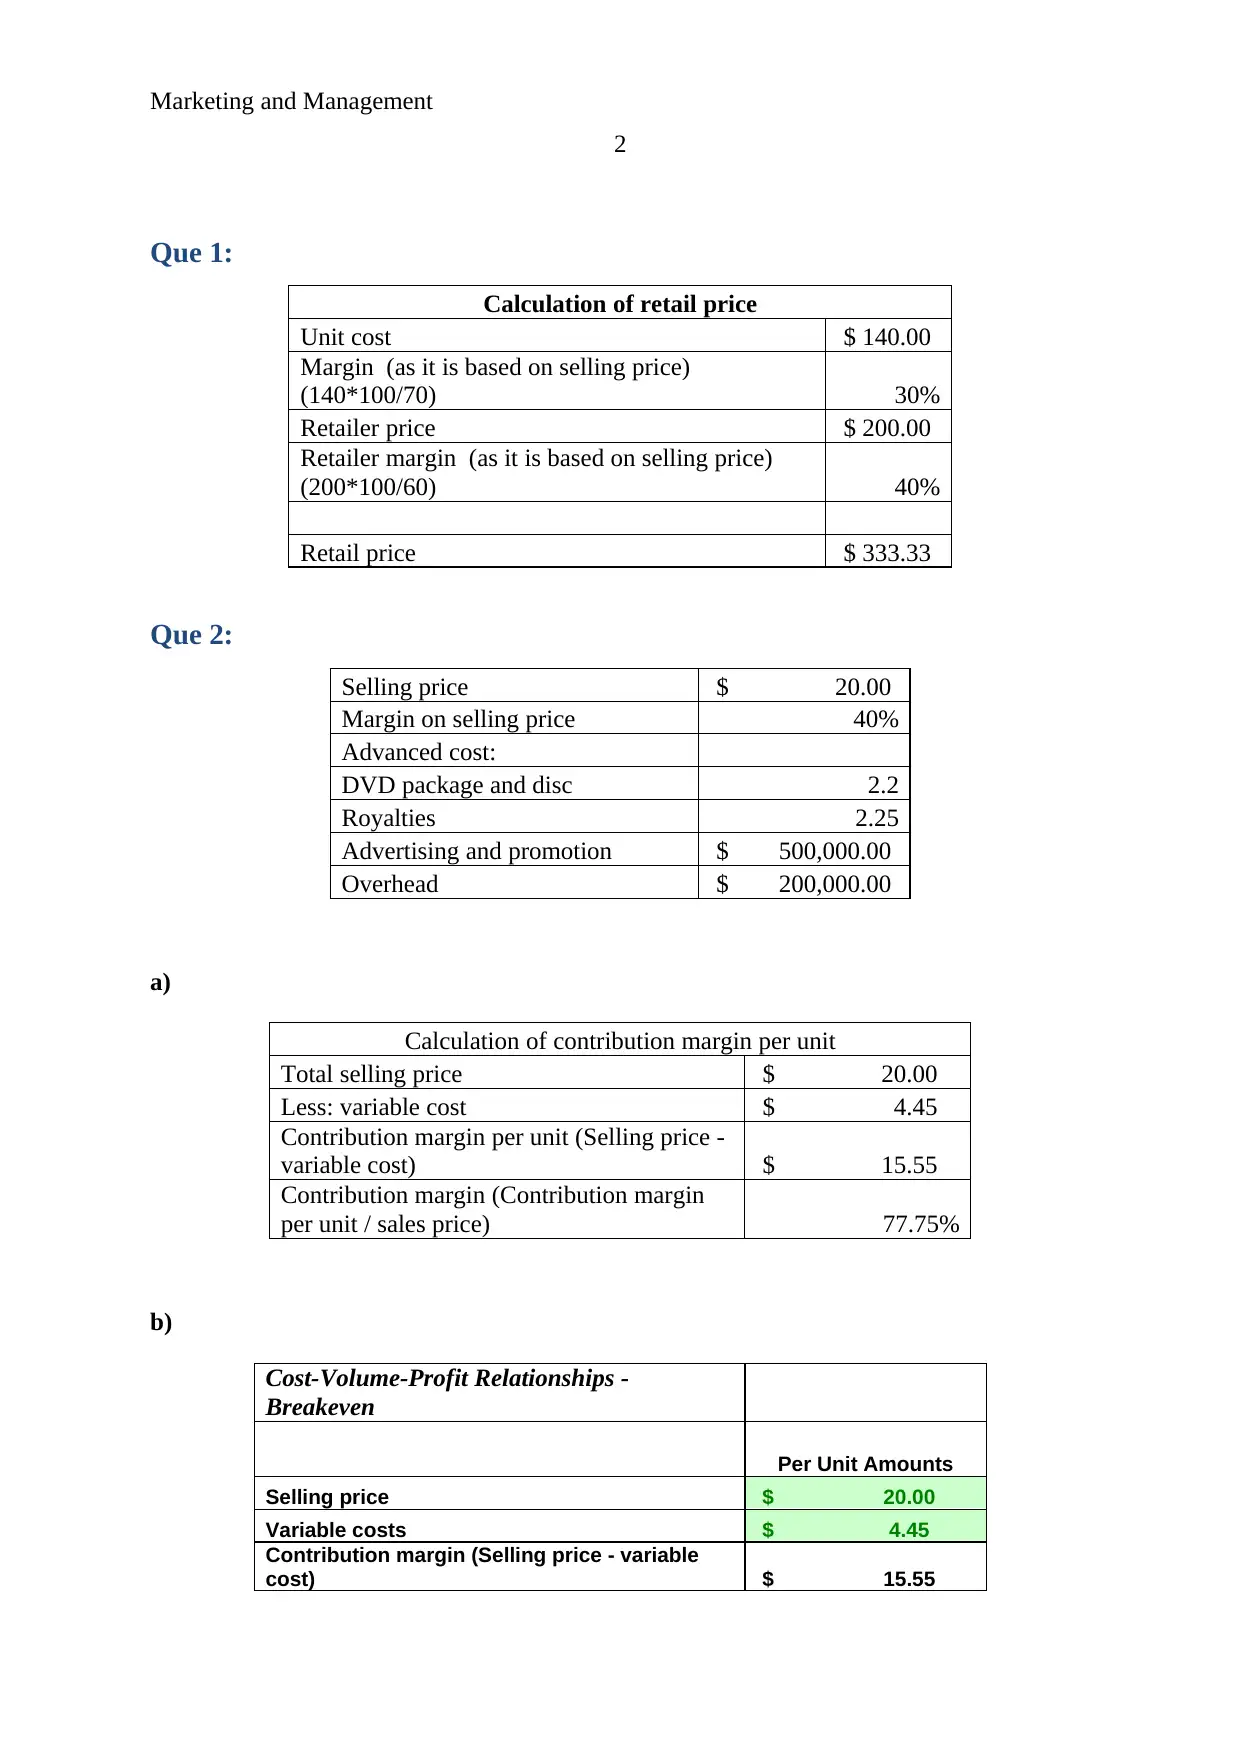
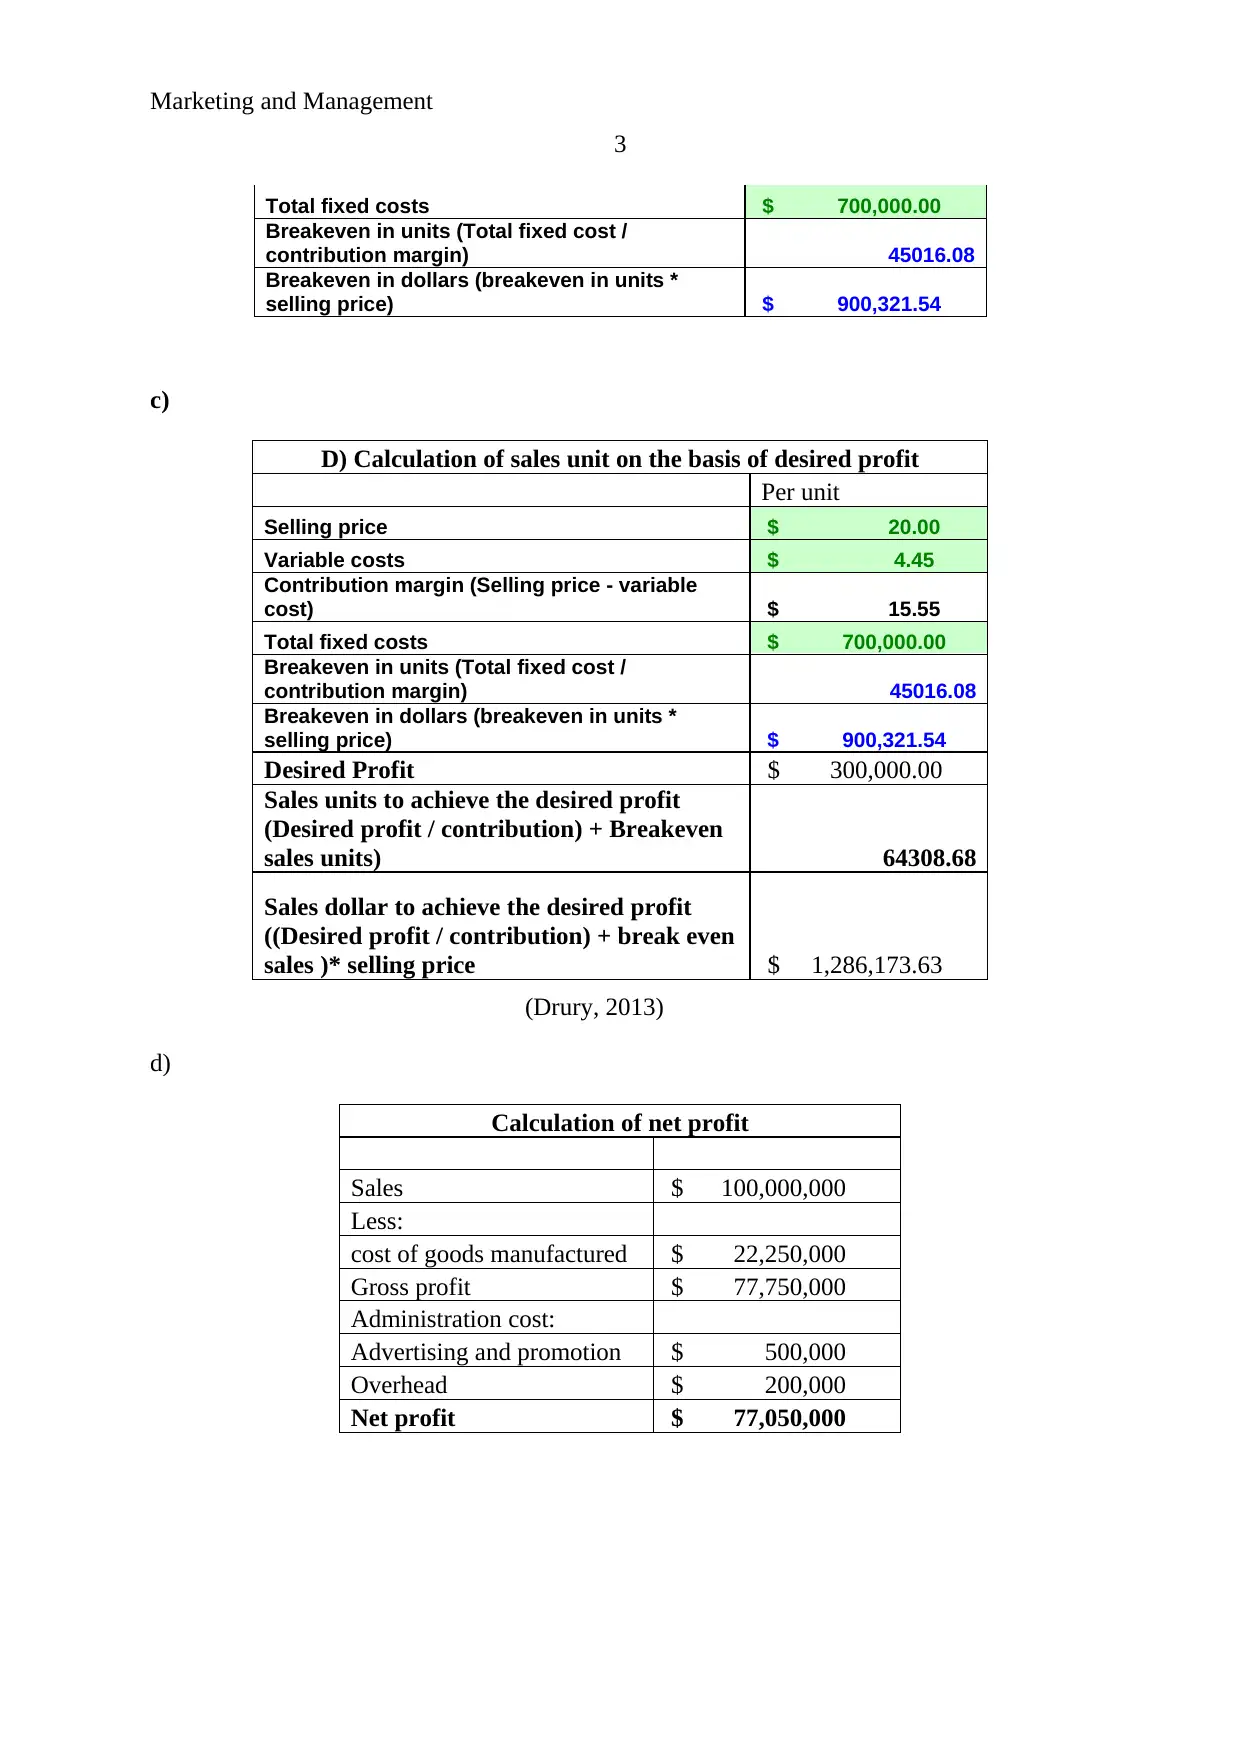
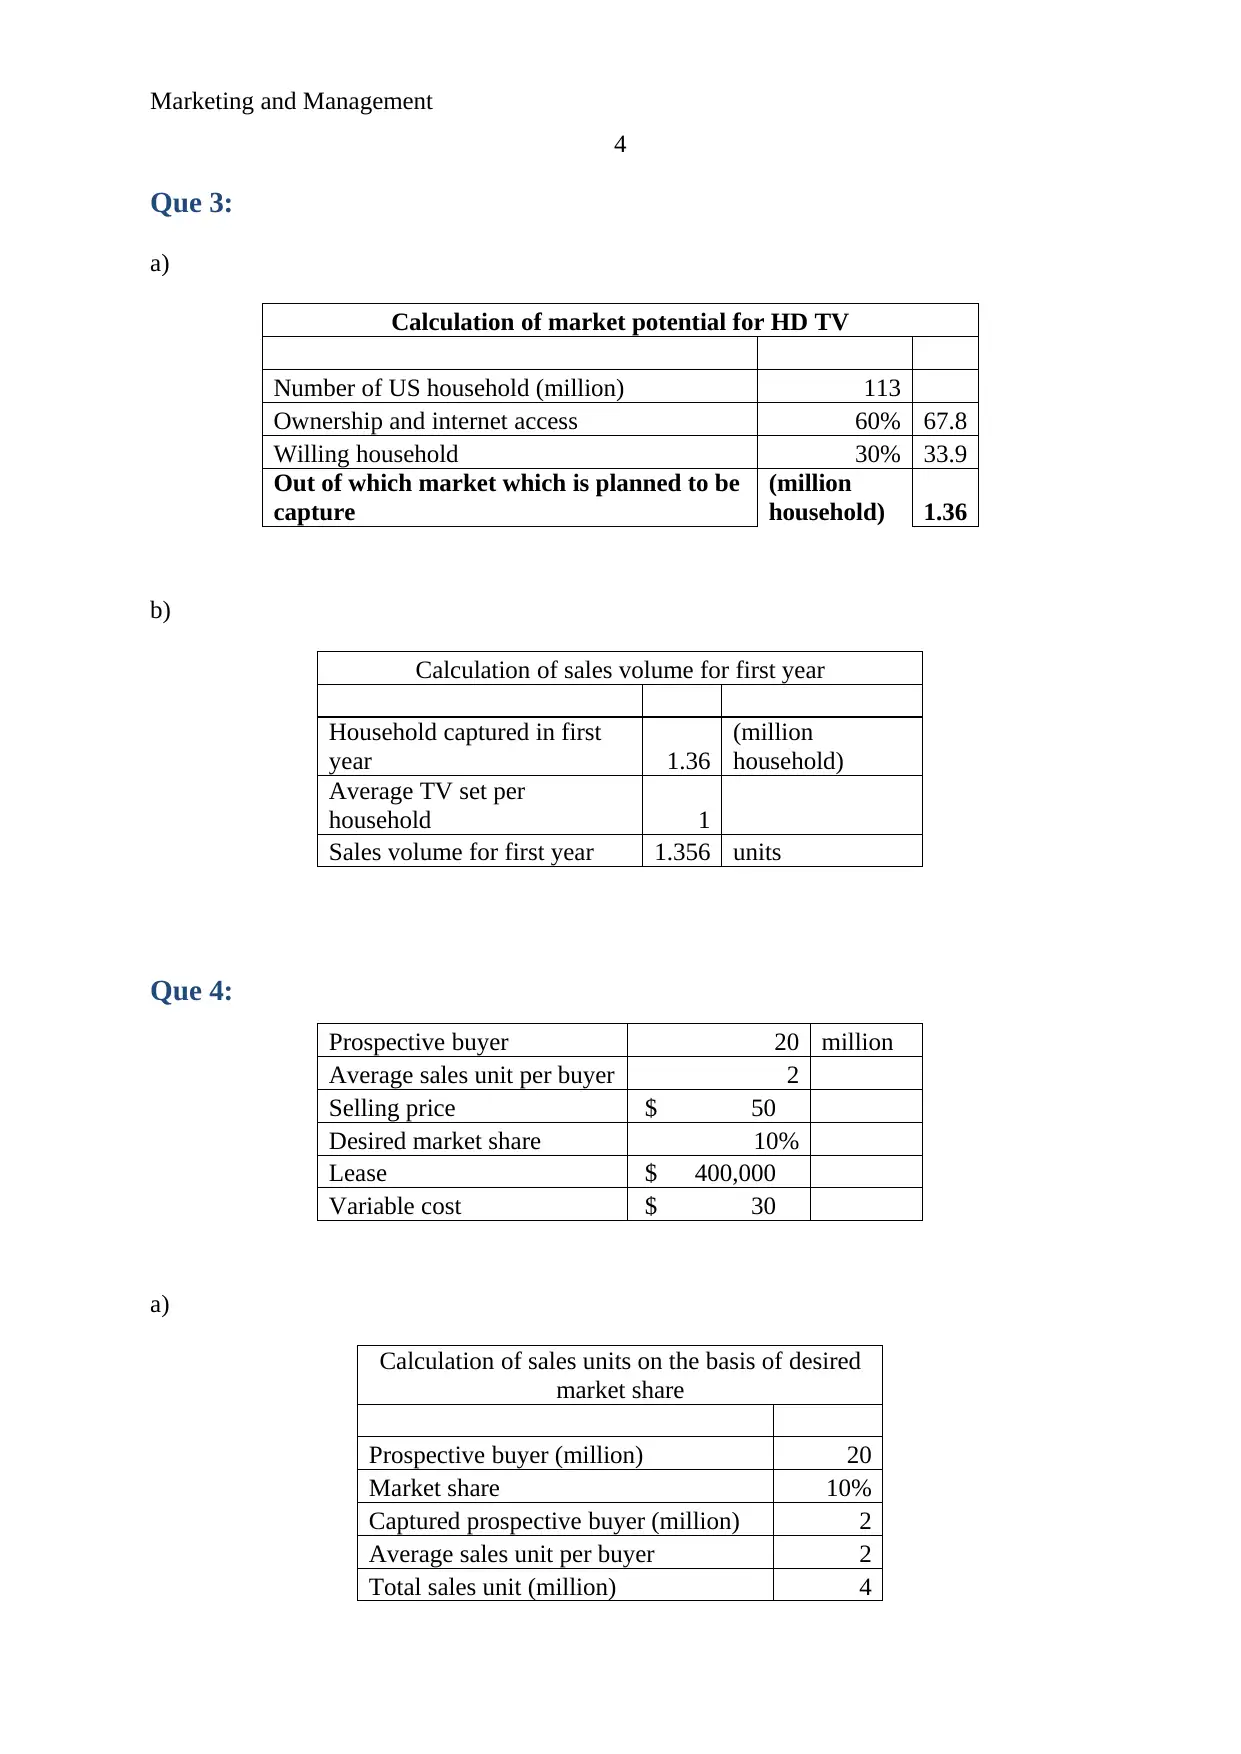
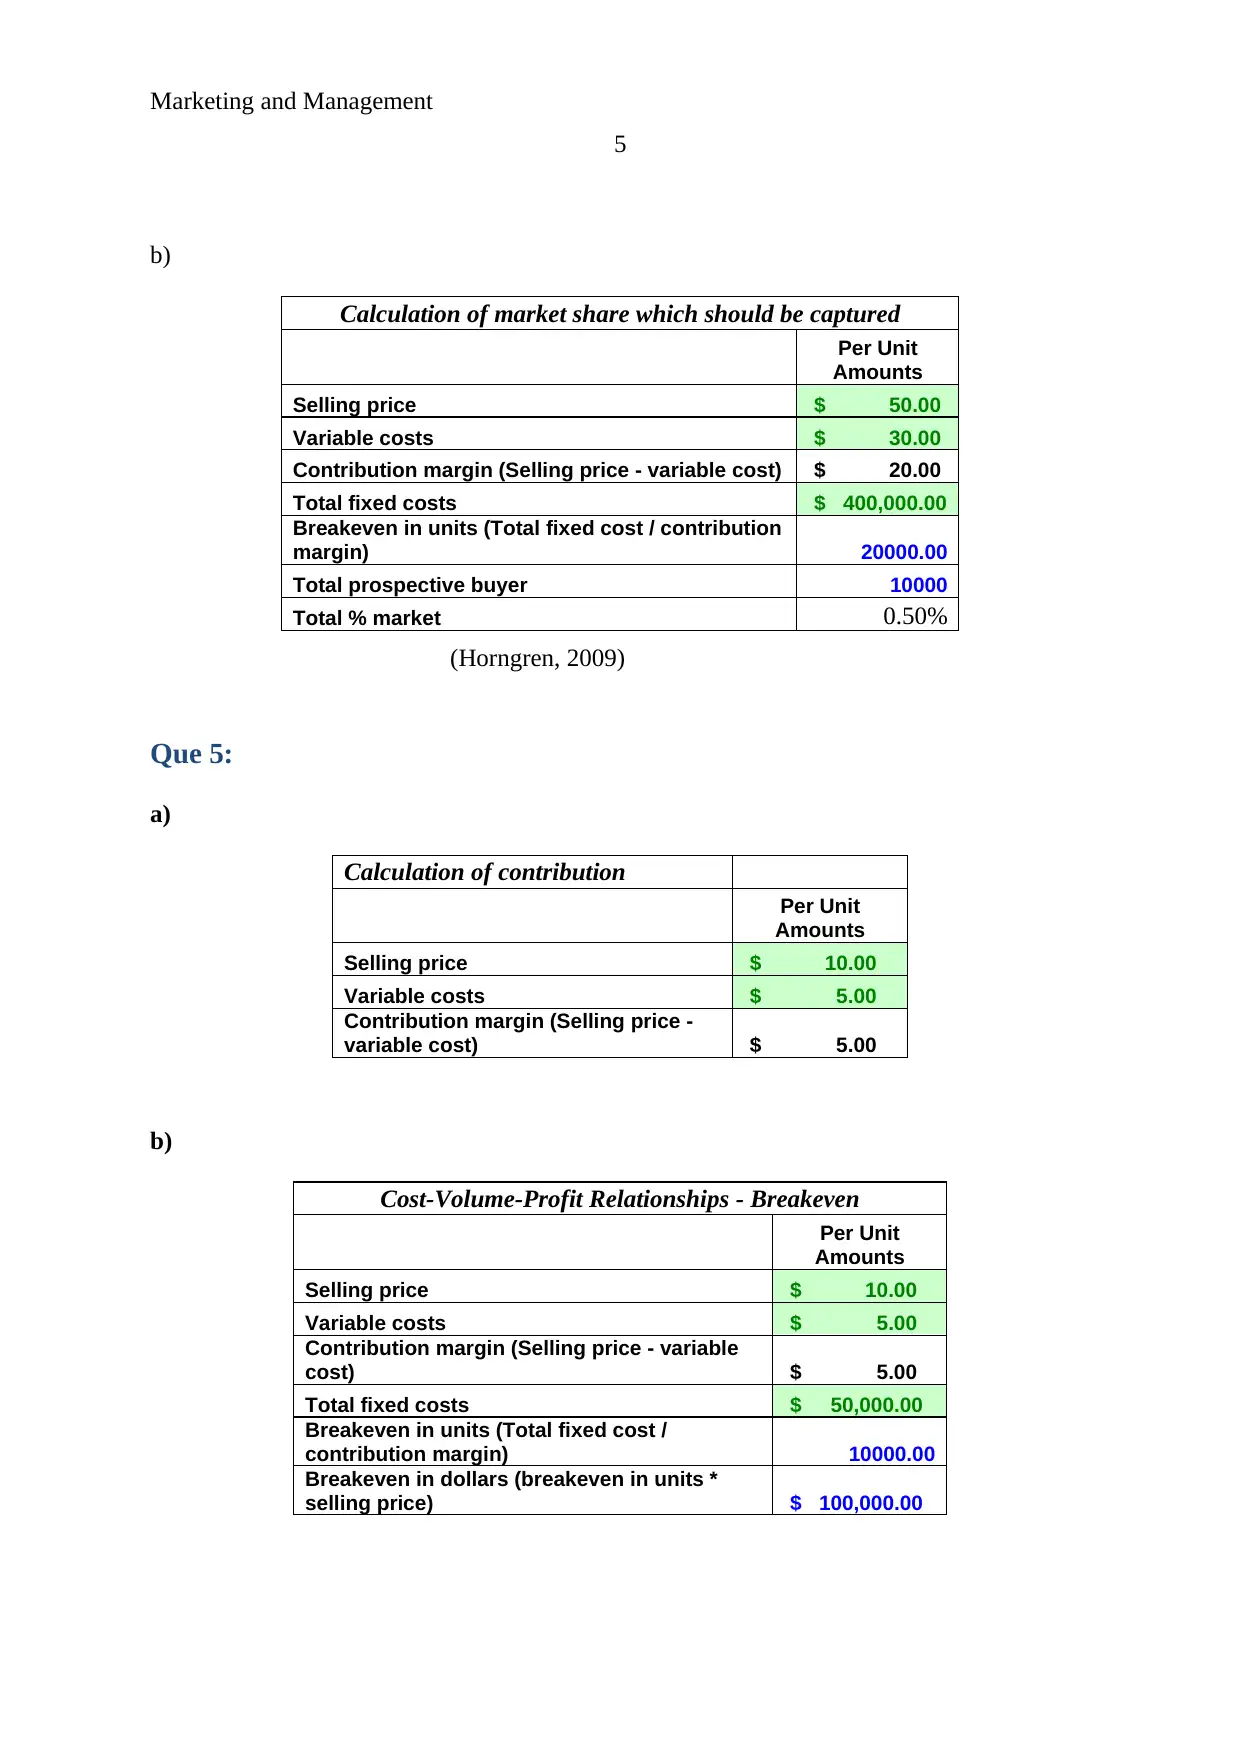
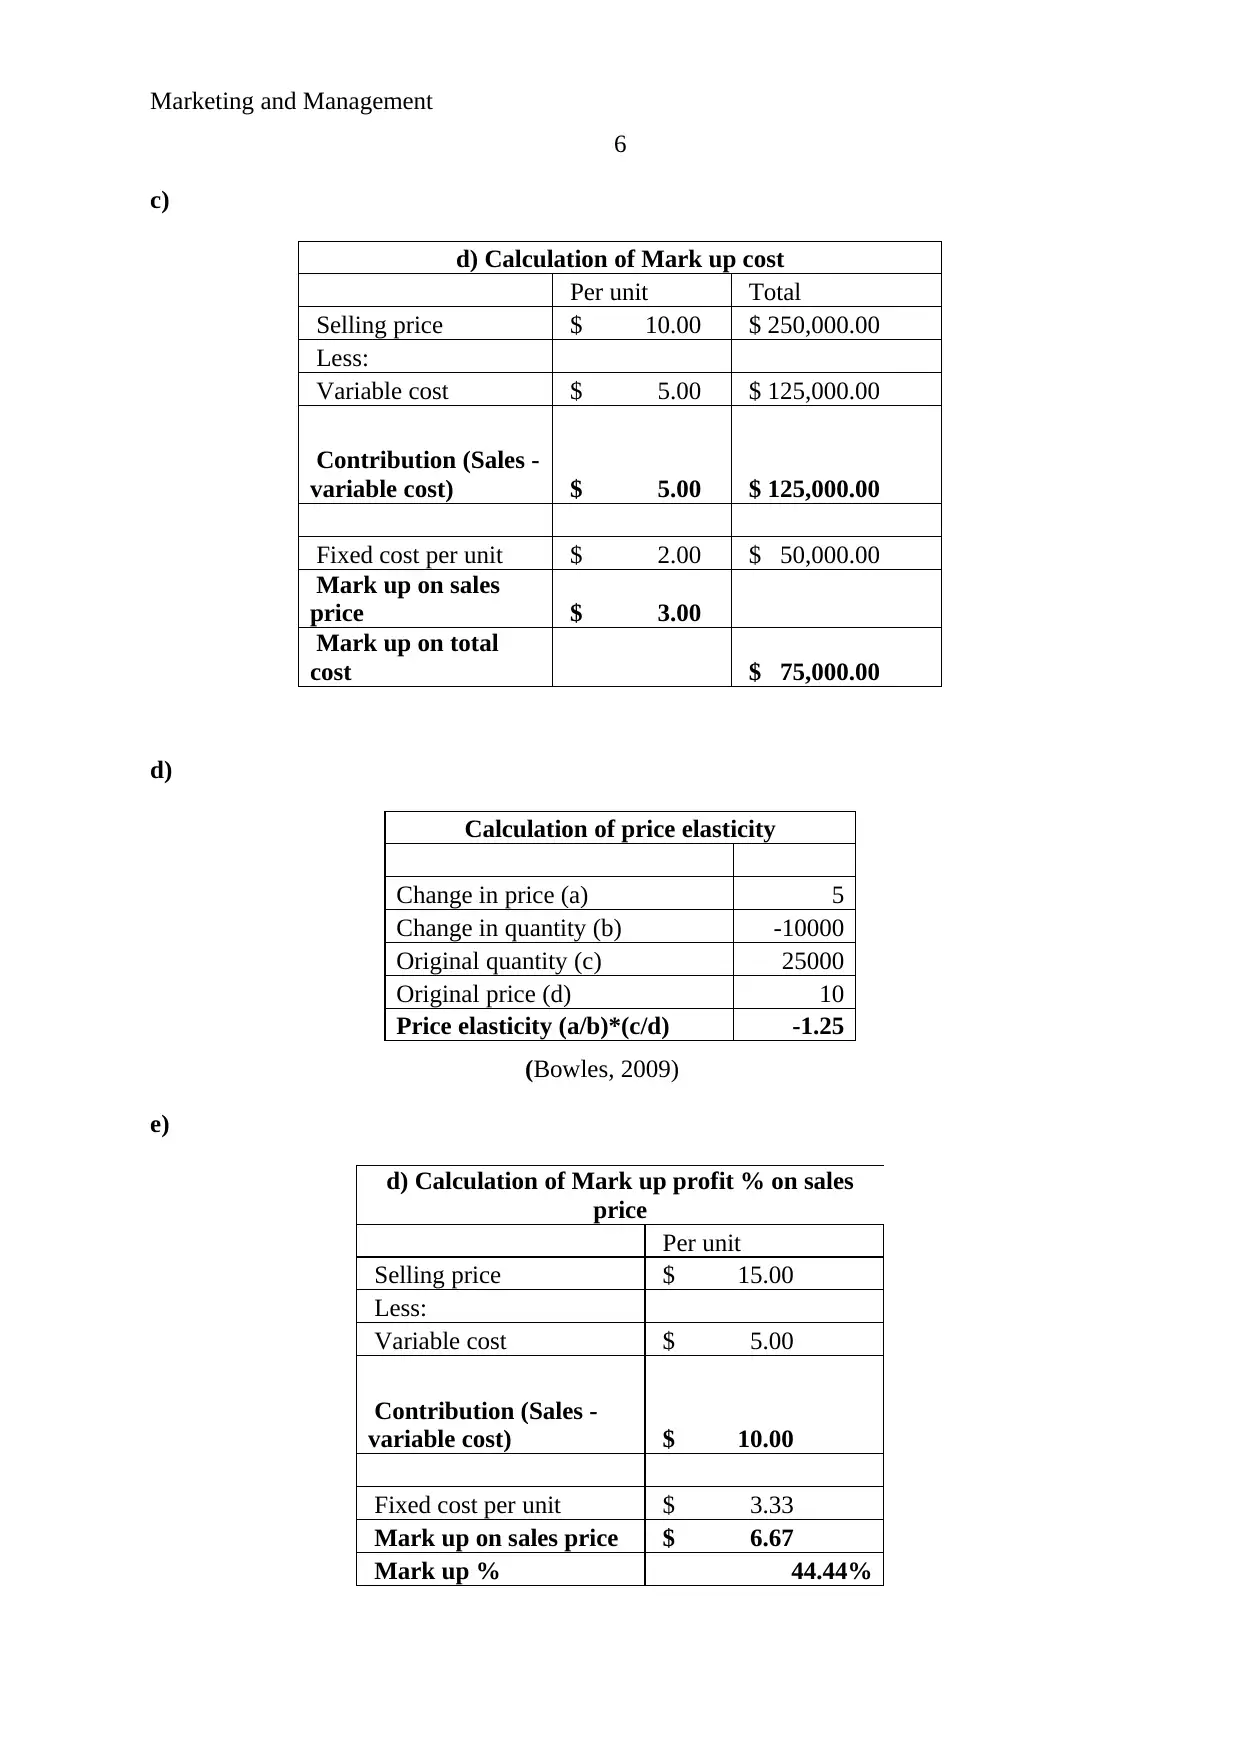
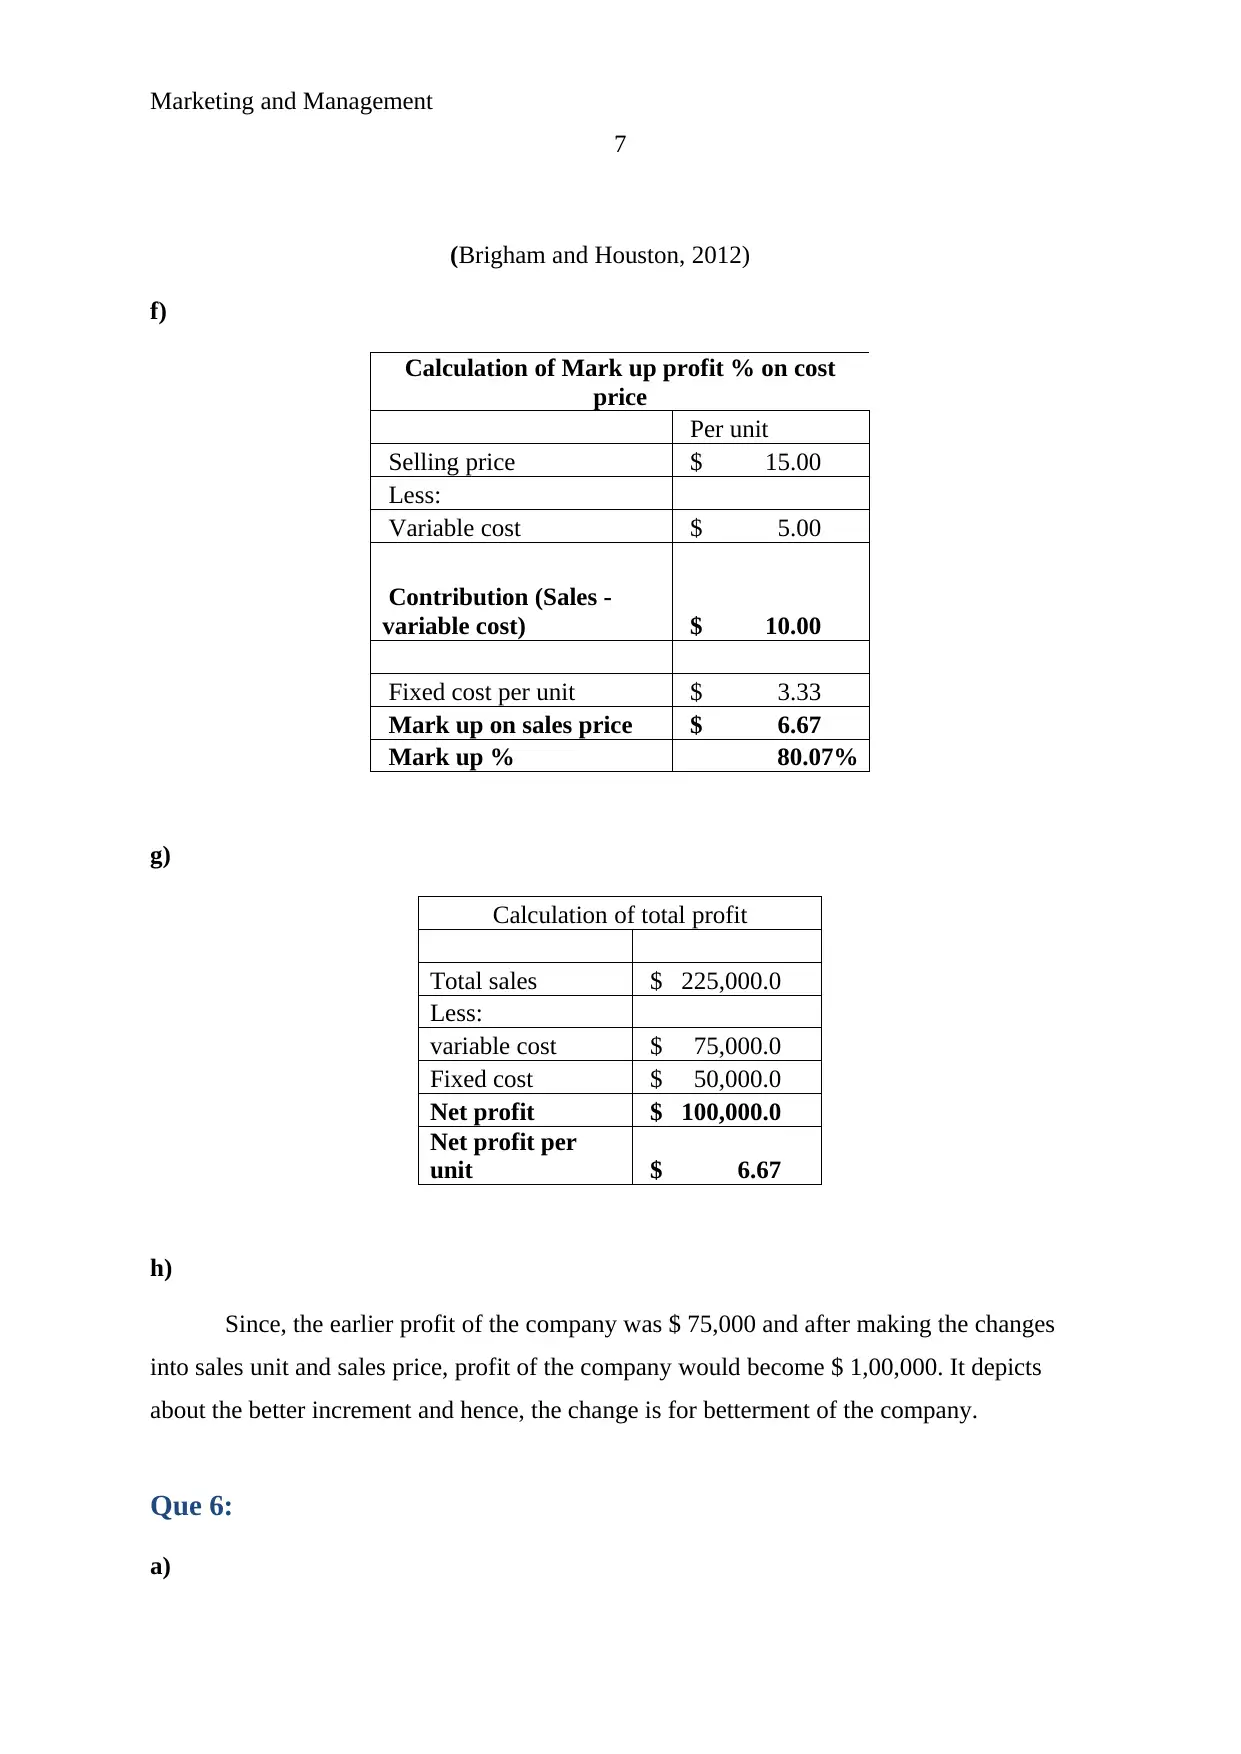
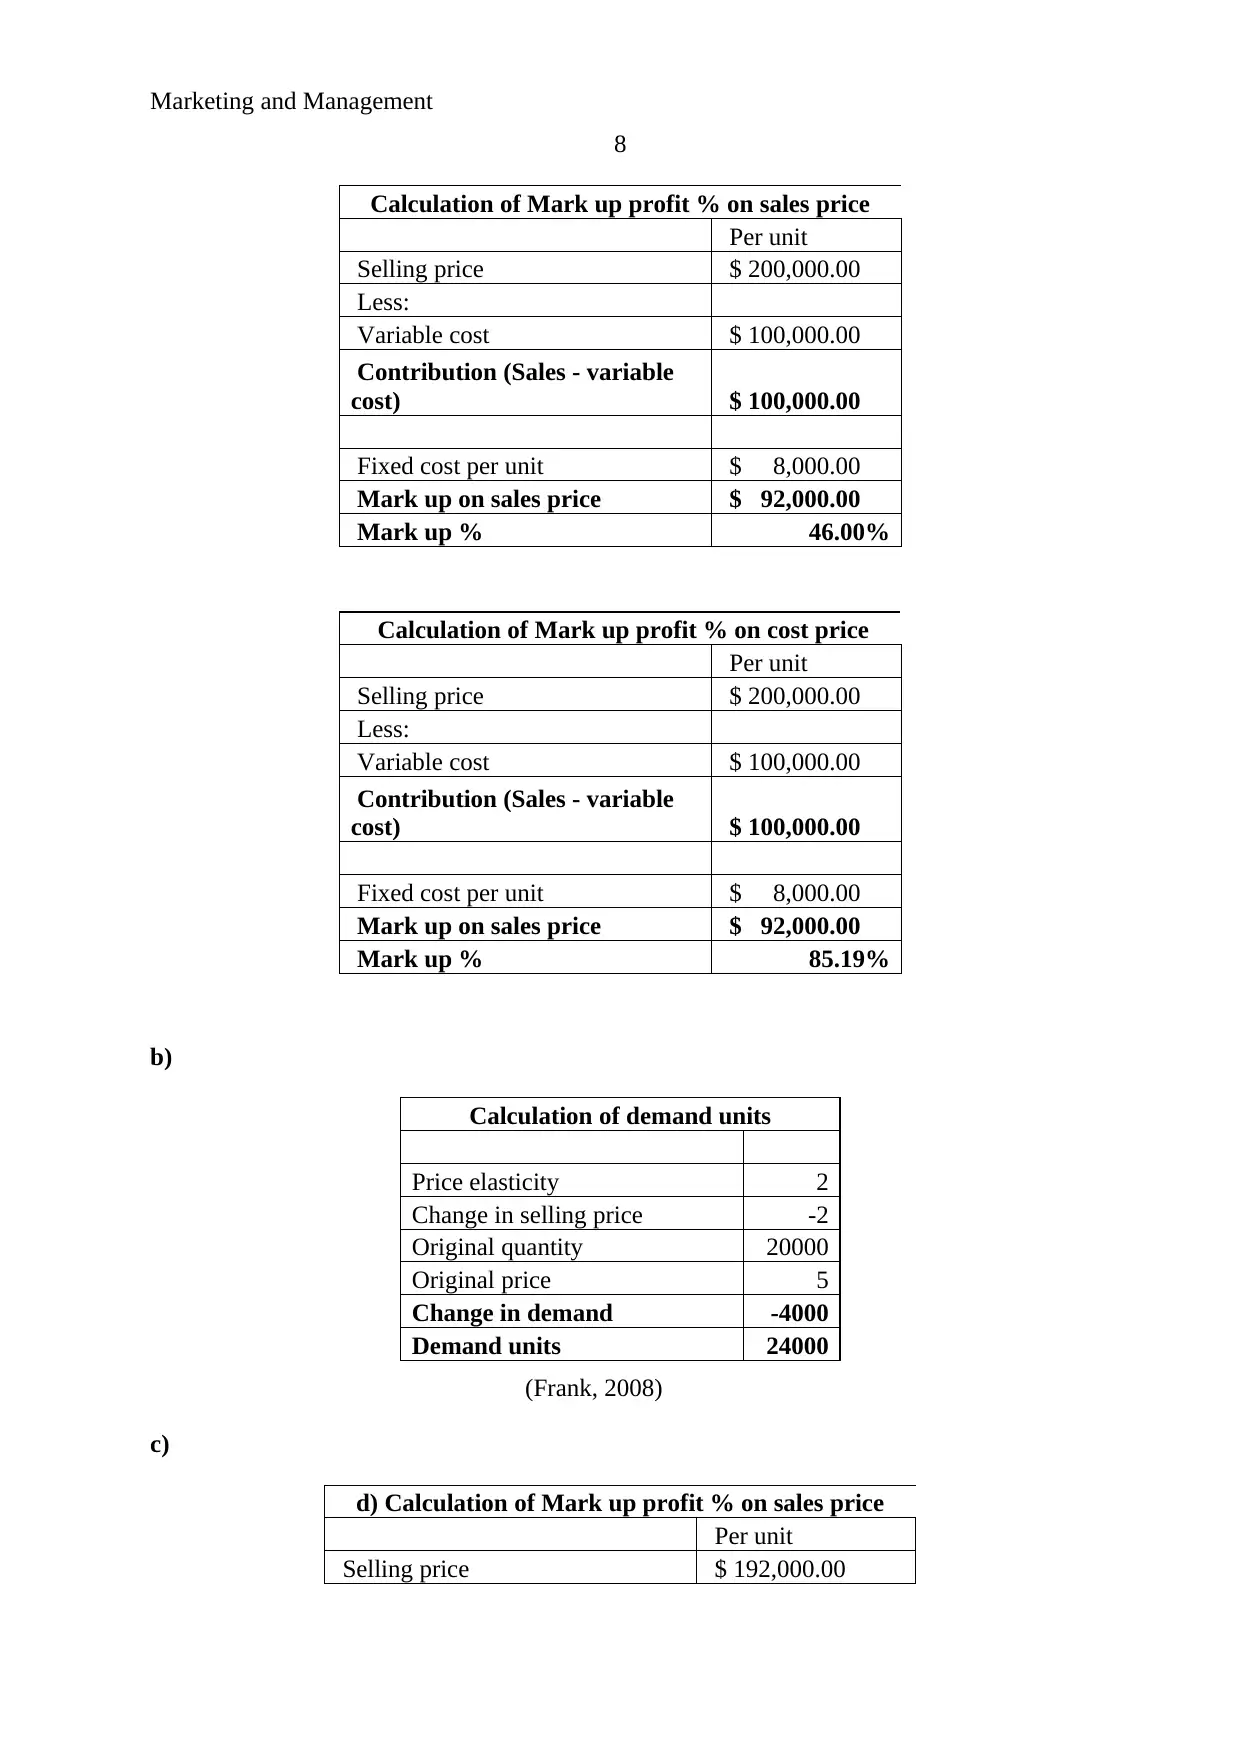
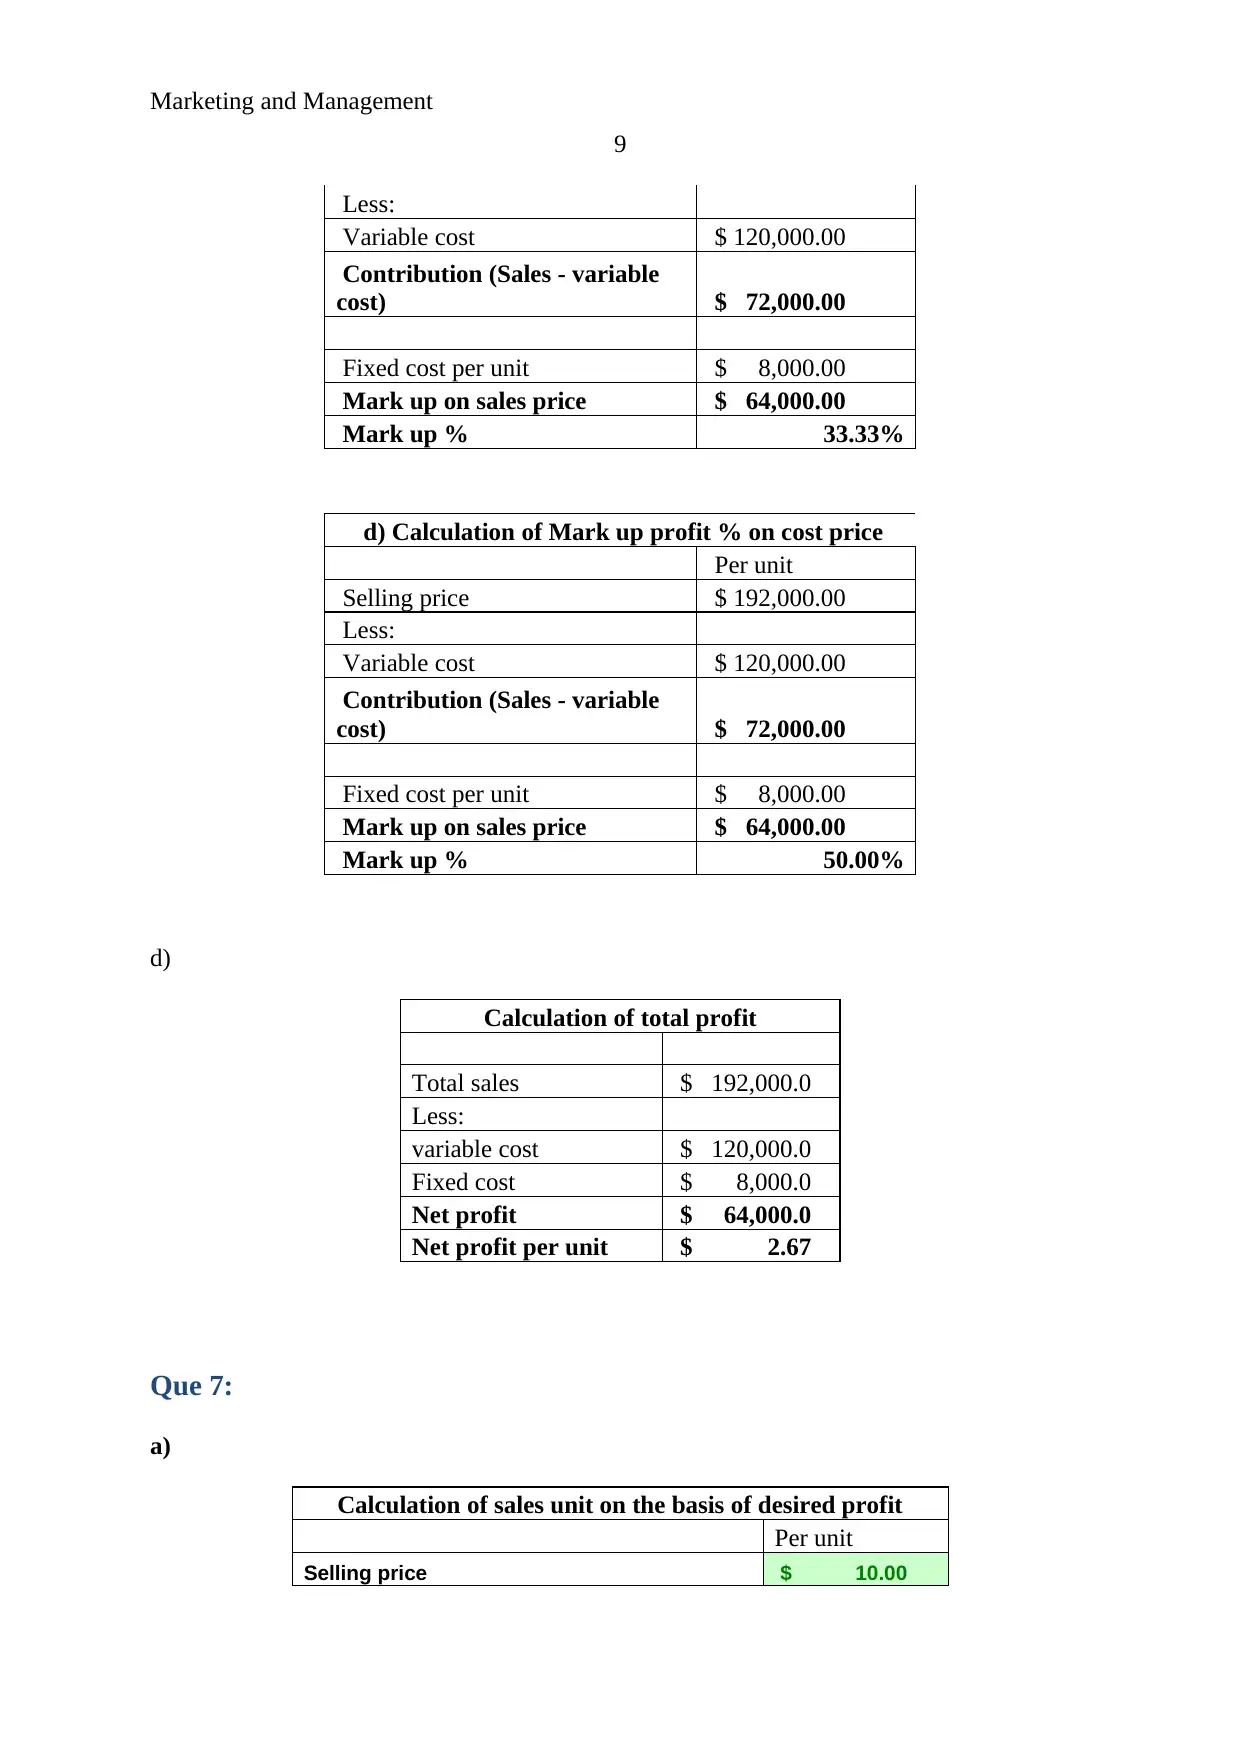
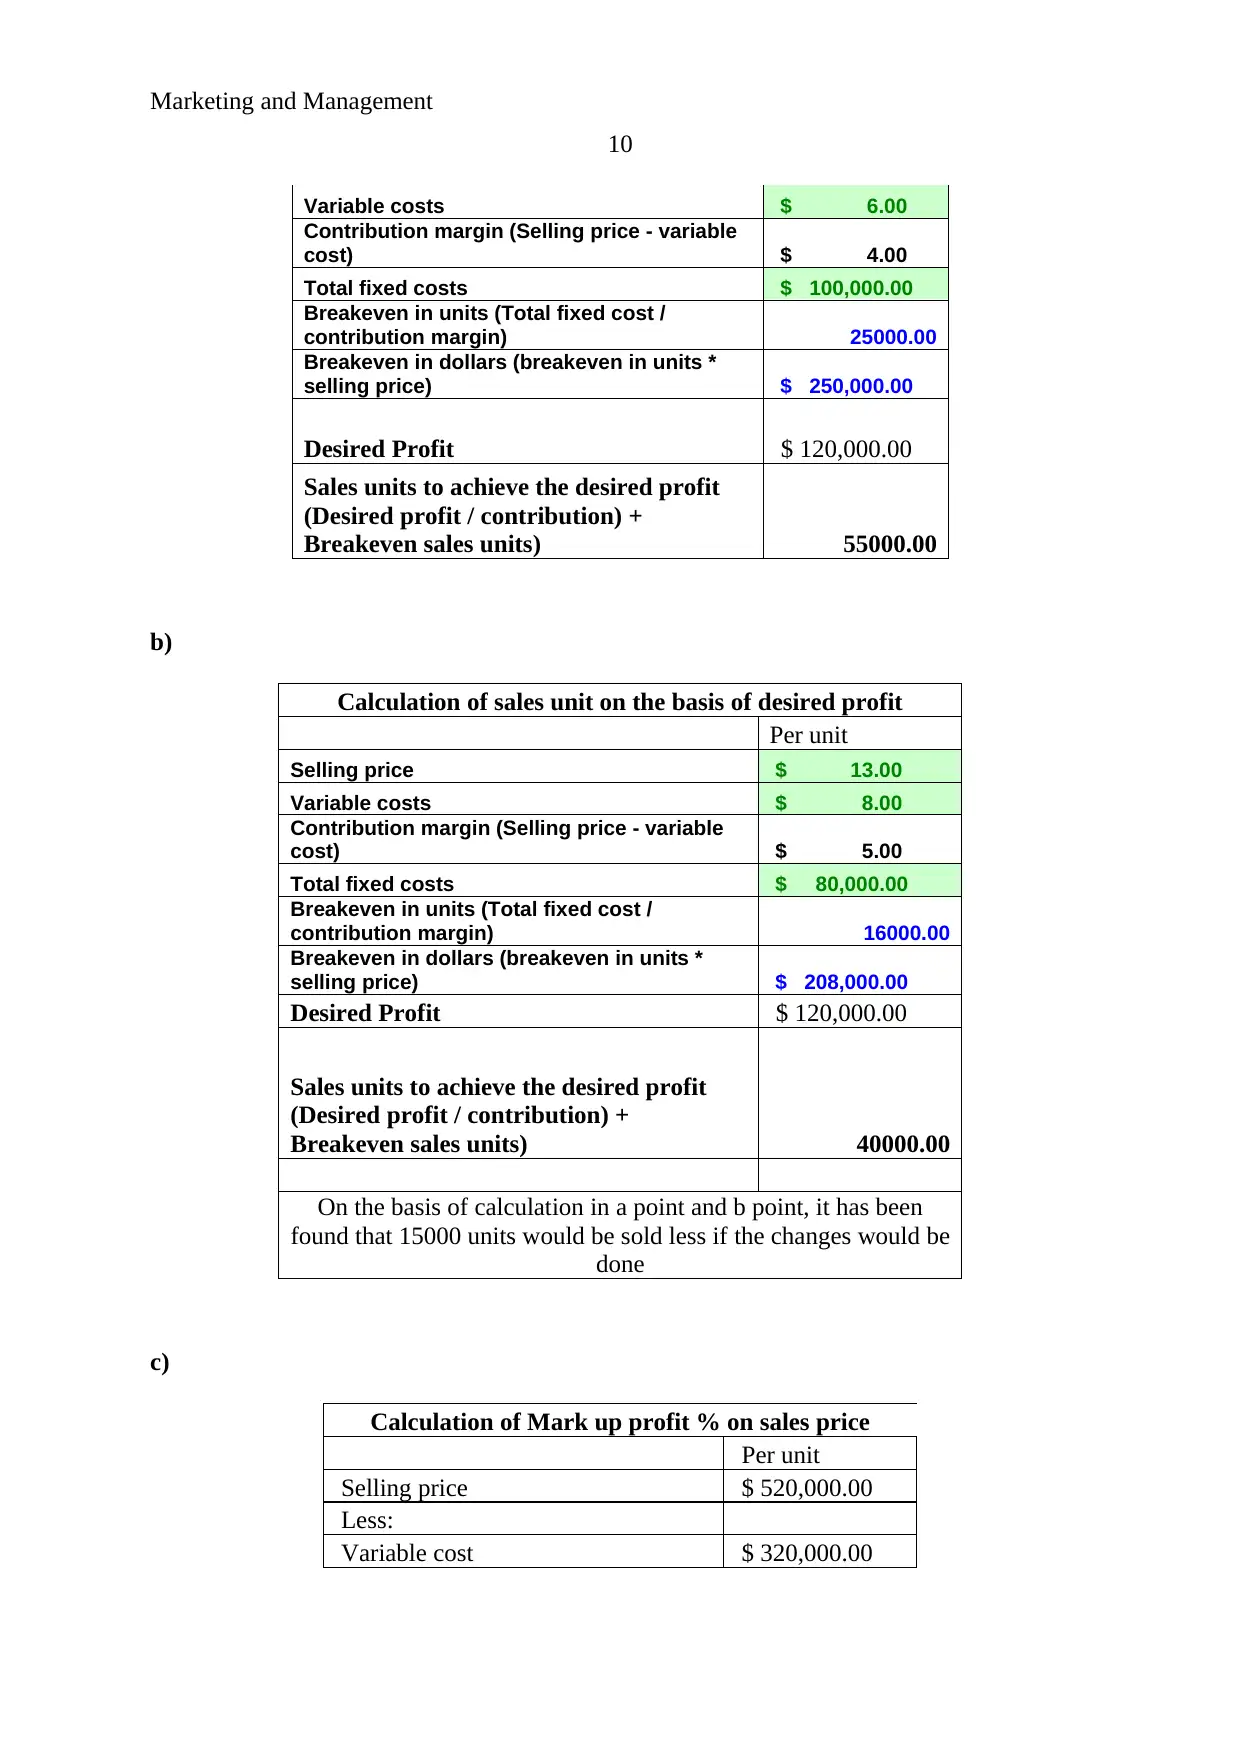
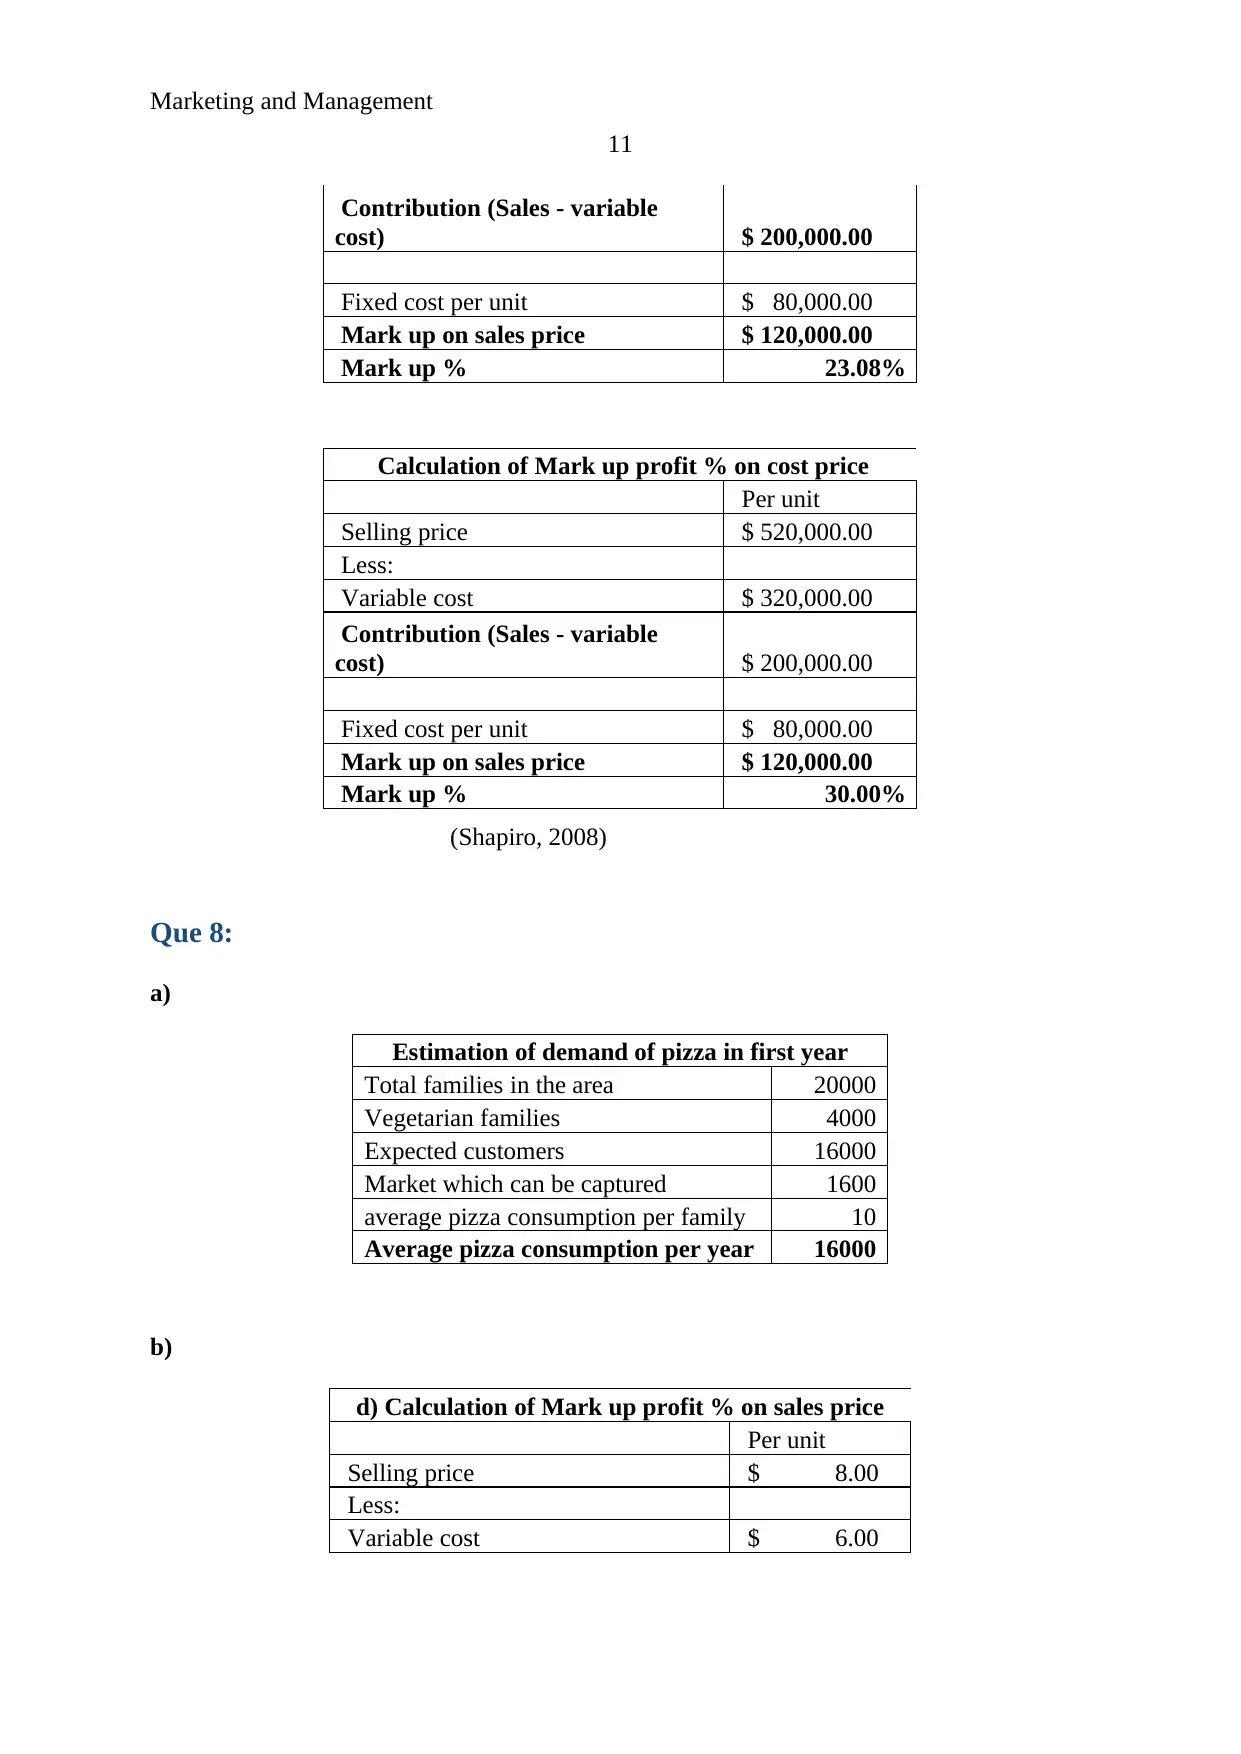
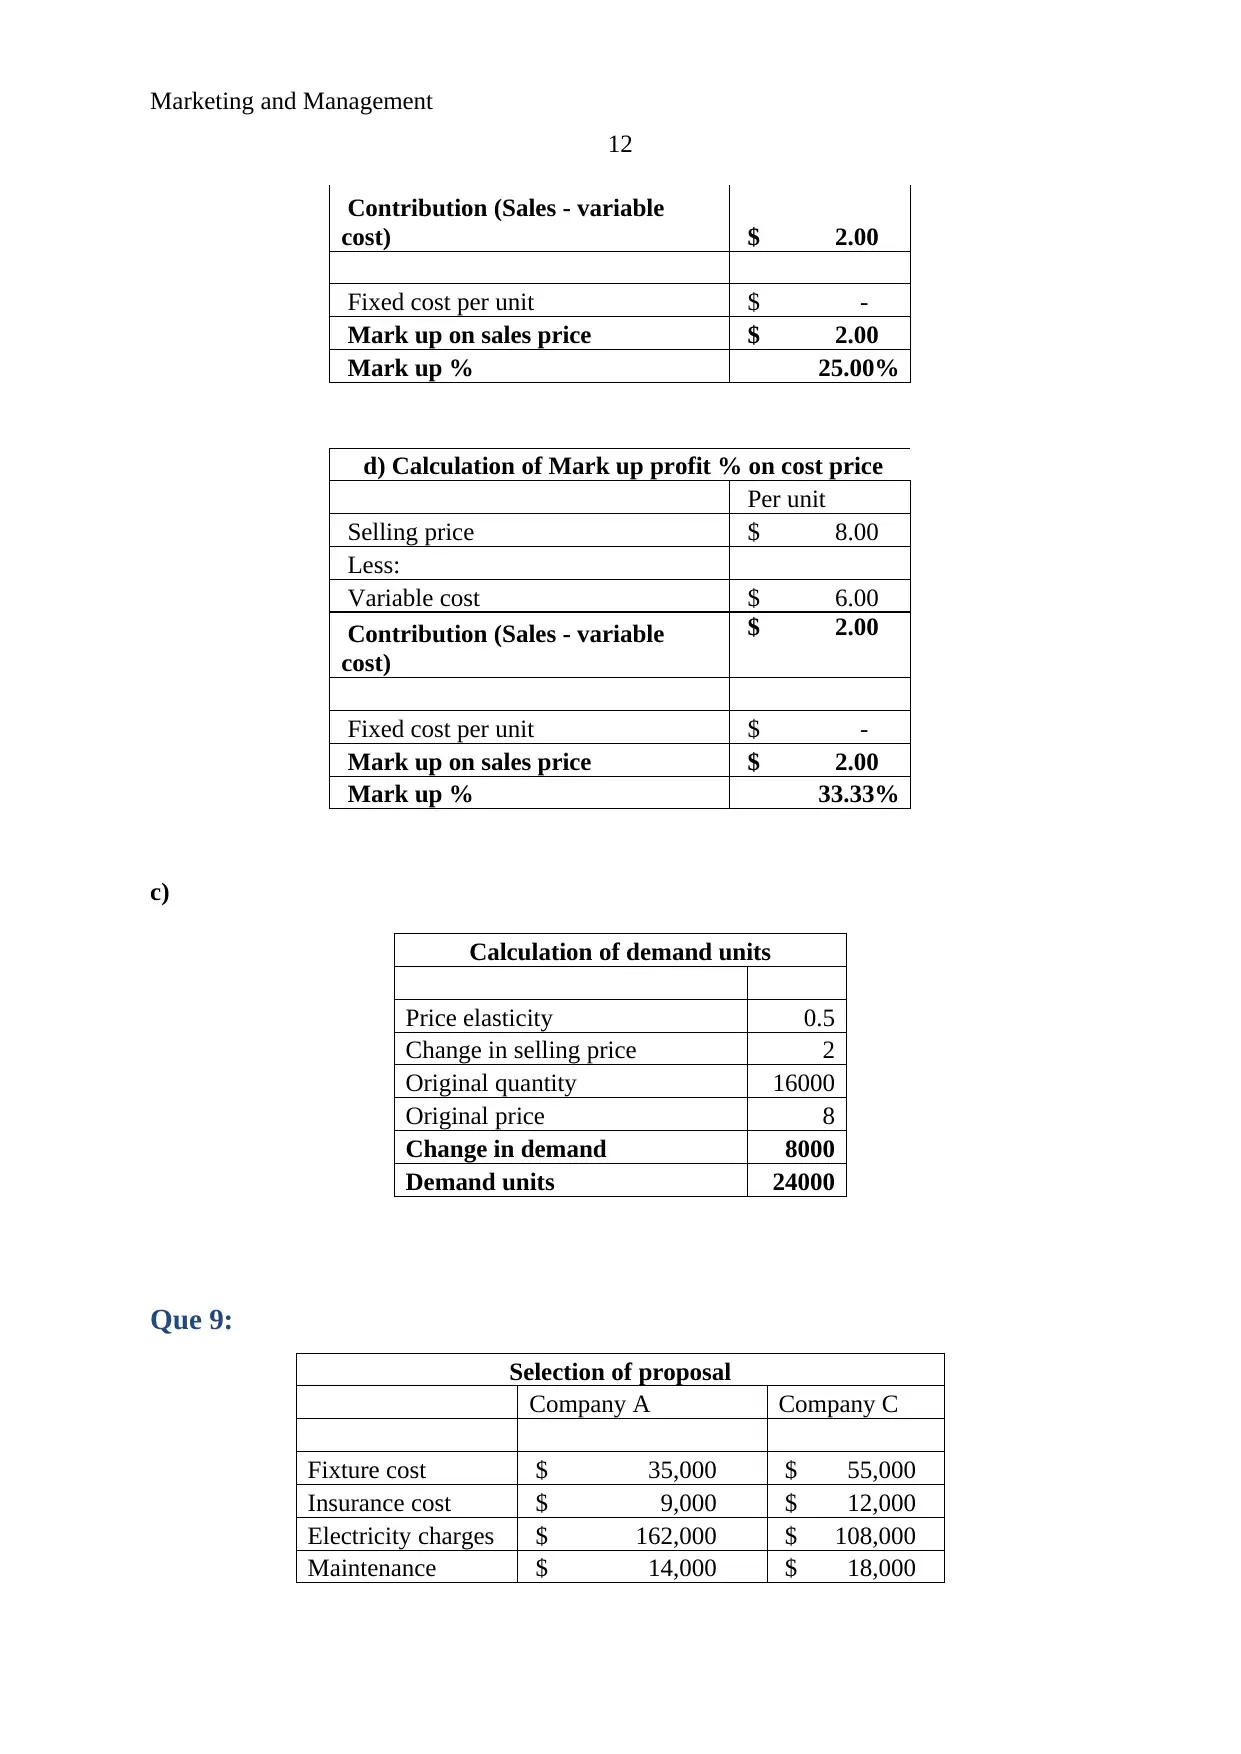
This assignment report provides detailed solutions to a marketing math problem set. The problems cover a range of topics including retail price calculations, margin analysis, and cost-volume-profit relationships. The first question involves calculating retail price and retailer margins given unit costs and desired margins. The second question delves into calculating contribution margin, breakeven points (in units and dollars), and the sales volume needed to achieve a specific profit target for a DVD manufacturer. Further questions explore market potential, sales volume, and market share calculations. The assignment also addresses markups, price elasticity, and profit analysis. The final sections include calculations of markups on sales and cost prices and an assessment of the impact of sales changes on profit. The report provides detailed calculations and analyses to demonstrate an understanding of marketing and management principles.
Contribute Materials
Your contribution can guide someone’s learning journey. Share your
documents today.

Running Head: Marketing and Management
1
Project Report: Marketing and Management
1
Project Report: Marketing and Management
Secure Best Marks with AI Grader
Need help grading? Try our AI Grader for instant feedback on your assignments.

Marketing and Management
2
Que 1:
Calculation of retail price
Unit cost $ 140.00
Margin (as it is based on selling price)
(140*100/70) 30%
Retailer price $ 200.00
Retailer margin (as it is based on selling price)
(200*100/60) 40%
Retail price $ 333.33
Que 2:
Selling price $ 20.00
Margin on selling price 40%
Advanced cost:
DVD package and disc 2.2
Royalties 2.25
Advertising and promotion $ 500,000.00
Overhead $ 200,000.00
a)
Calculation of contribution margin per unit
Total selling price $ 20.00
Less: variable cost $ 4.45
Contribution margin per unit (Selling price -
variable cost) $ 15.55
Contribution margin (Contribution margin
per unit / sales price) 77.75%
b)
Cost-Volume-Profit Relationships -
Breakeven
Per Unit Amounts
Selling price $ 20.00
Variable costs $ 4.45
Contribution margin (Selling price - variable
cost) $ 15.55

Marketing and Management
3
Total fixed costs $ 700,000.00
Breakeven in units (Total fixed cost /
contribution margin) 45016.08
Breakeven in dollars (breakeven in units *
selling price) $ 900,321.54
c)
D) Calculation of sales unit on the basis of desired profit
Per unit
Selling price $ 20.00
Variable costs $ 4.45
Contribution margin (Selling price - variable
cost) $ 15.55
Total fixed costs $ 700,000.00
Breakeven in units (Total fixed cost /
contribution margin) 45016.08
Breakeven in dollars (breakeven in units *
selling price) $ 900,321.54
Desired Profit $ 300,000.00
Sales units to achieve the desired profit
(Desired profit / contribution) + Breakeven
sales units) 64308.68
Sales dollar to achieve the desired profit
((Desired profit / contribution) + break even
sales )* selling price $ 1,286,173.63
(Drury, 2013)
d)
Calculation of net profit
Sales $ 100,000,000
Less:
cost of goods manufactured $ 22,250,000
Gross profit $ 77,750,000
Administration cost:
Advertising and promotion $ 500,000
Overhead $ 200,000
Net profit $ 77,050,000

Marketing and Management
4
Que 3:
a)
Calculation of market potential for HD TV
Number of US household (million) 113
Ownership and internet access 60% 67.8
Willing household 30% 33.9
Out of which market which is planned to be
capture
(million
household) 1.36
b)
Calculation of sales volume for first year
Household captured in first
year 1.36
(million
household)
Average TV set per
household 1
Sales volume for first year 1.356 units
Que 4:
Prospective buyer 20 million
Average sales unit per buyer 2
Selling price $ 50
Desired market share 10%
Lease $ 400,000
Variable cost $ 30
a)
Calculation of sales units on the basis of desired
market share
Prospective buyer (million) 20
Market share 10%
Captured prospective buyer (million) 2
Average sales unit per buyer 2
Total sales unit (million) 4
Secure Best Marks with AI Grader
Need help grading? Try our AI Grader for instant feedback on your assignments.

Marketing and Management
5
b)
Calculation of market share which should be captured
Per Unit
Amounts
Selling price $ 50.00
Variable costs $ 30.00
Contribution margin (Selling price - variable cost) $ 20.00
Total fixed costs $ 400,000.00
Breakeven in units (Total fixed cost / contribution
margin) 20000.00
Total prospective buyer 10000
Total % market 0.50%
(Horngren, 2009)
Que 5:
a)
Calculation of contribution
Per Unit
Amounts
Selling price $ 10.00
Variable costs $ 5.00
Contribution margin (Selling price -
variable cost) $ 5.00
b)
Cost-Volume-Profit Relationships - Breakeven
Per Unit
Amounts
Selling price $ 10.00
Variable costs $ 5.00
Contribution margin (Selling price - variable
cost) $ 5.00
Total fixed costs $ 50,000.00
Breakeven in units (Total fixed cost /
contribution margin) 10000.00
Breakeven in dollars (breakeven in units *
selling price) $ 100,000.00

Marketing and Management
6
c)
d) Calculation of Mark up cost
Per unit Total
Selling price $ 10.00 $ 250,000.00
Less:
Variable cost $ 5.00 $ 125,000.00
Contribution (Sales -
variable cost) $ 5.00 $ 125,000.00
Fixed cost per unit $ 2.00 $ 50,000.00
Mark up on sales
price $ 3.00
Mark up on total
cost $ 75,000.00
d)
Calculation of price elasticity
Change in price (a) 5
Change in quantity (b) -10000
Original quantity (c) 25000
Original price (d) 10
Price elasticity (a/b)*(c/d) -1.25
(Bowles, 2009)
e)
d) Calculation of Mark up profit % on sales
price
Per unit
Selling price $ 15.00
Less:
Variable cost $ 5.00
Contribution (Sales -
variable cost) $ 10.00
Fixed cost per unit $ 3.33
Mark up on sales price $ 6.67
Mark up % 44.44%

Marketing and Management
7
(Brigham and Houston, 2012)
f)
Calculation of Mark up profit % on cost
price
Per unit
Selling price $ 15.00
Less:
Variable cost $ 5.00
Contribution (Sales -
variable cost) $ 10.00
Fixed cost per unit $ 3.33
Mark up on sales price $ 6.67
Mark up % 80.07%
g)
Calculation of total profit
Total sales $ 225,000.0
Less:
variable cost $ 75,000.0
Fixed cost $ 50,000.0
Net profit $ 100,000.0
Net profit per
unit $ 6.67
h)
Since, the earlier profit of the company was $ 75,000 and after making the changes
into sales unit and sales price, profit of the company would become $ 1,00,000. It depicts
about the better increment and hence, the change is for betterment of the company.
Que 6:
a)
Paraphrase This Document
Need a fresh take? Get an instant paraphrase of this document with our AI Paraphraser

Marketing and Management
8
Calculation of Mark up profit % on sales price
Per unit
Selling price $ 200,000.00
Less:
Variable cost $ 100,000.00
Contribution (Sales - variable
cost) $ 100,000.00
Fixed cost per unit $ 8,000.00
Mark up on sales price $ 92,000.00
Mark up % 46.00%
Calculation of Mark up profit % on cost price
Per unit
Selling price $ 200,000.00
Less:
Variable cost $ 100,000.00
Contribution (Sales - variable
cost) $ 100,000.00
Fixed cost per unit $ 8,000.00
Mark up on sales price $ 92,000.00
Mark up % 85.19%
b)
Calculation of demand units
Price elasticity 2
Change in selling price -2
Original quantity 20000
Original price 5
Change in demand -4000
Demand units 24000
(Frank, 2008)
c)
d) Calculation of Mark up profit % on sales price
Per unit
Selling price $ 192,000.00

Marketing and Management
9
Less:
Variable cost $ 120,000.00
Contribution (Sales - variable
cost) $ 72,000.00
Fixed cost per unit $ 8,000.00
Mark up on sales price $ 64,000.00
Mark up % 33.33%
d) Calculation of Mark up profit % on cost price
Per unit
Selling price $ 192,000.00
Less:
Variable cost $ 120,000.00
Contribution (Sales - variable
cost) $ 72,000.00
Fixed cost per unit $ 8,000.00
Mark up on sales price $ 64,000.00
Mark up % 50.00%
d)
Calculation of total profit
Total sales $ 192,000.0
Less:
variable cost $ 120,000.0
Fixed cost $ 8,000.0
Net profit $ 64,000.0
Net profit per unit $ 2.67
Que 7:
a)
Calculation of sales unit on the basis of desired profit
Per unit
Selling price $ 10.00

Marketing and Management
10
Variable costs $ 6.00
Contribution margin (Selling price - variable
cost) $ 4.00
Total fixed costs $ 100,000.00
Breakeven in units (Total fixed cost /
contribution margin) 25000.00
Breakeven in dollars (breakeven in units *
selling price) $ 250,000.00
Desired Profit $ 120,000.00
Sales units to achieve the desired profit
(Desired profit / contribution) +
Breakeven sales units) 55000.00
b)
Calculation of sales unit on the basis of desired profit
Per unit
Selling price $ 13.00
Variable costs $ 8.00
Contribution margin (Selling price - variable
cost) $ 5.00
Total fixed costs $ 80,000.00
Breakeven in units (Total fixed cost /
contribution margin) 16000.00
Breakeven in dollars (breakeven in units *
selling price) $ 208,000.00
Desired Profit $ 120,000.00
Sales units to achieve the desired profit
(Desired profit / contribution) +
Breakeven sales units) 40000.00
On the basis of calculation in a point and b point, it has been
found that 15000 units would be sold less if the changes would be
done
c)
Calculation of Mark up profit % on sales price
Per unit
Selling price $ 520,000.00
Less:
Variable cost $ 320,000.00
Secure Best Marks with AI Grader
Need help grading? Try our AI Grader for instant feedback on your assignments.

Marketing and Management
11
Contribution (Sales - variable
cost) $ 200,000.00
Fixed cost per unit $ 80,000.00
Mark up on sales price $ 120,000.00
Mark up % 23.08%
Calculation of Mark up profit % on cost price
Per unit
Selling price $ 520,000.00
Less:
Variable cost $ 320,000.00
Contribution (Sales - variable
cost) $ 200,000.00
Fixed cost per unit $ 80,000.00
Mark up on sales price $ 120,000.00
Mark up % 30.00%
(Shapiro, 2008)
Que 8:
a)
Estimation of demand of pizza in first year
Total families in the area 20000
Vegetarian families 4000
Expected customers 16000
Market which can be captured 1600
average pizza consumption per family 10
Average pizza consumption per year 16000
b)
d) Calculation of Mark up profit % on sales price
Per unit
Selling price $ 8.00
Less:
Variable cost $ 6.00

Marketing and Management
12
Contribution (Sales - variable
cost) $ 2.00
Fixed cost per unit $ -
Mark up on sales price $ 2.00
Mark up % 25.00%
d) Calculation of Mark up profit % on cost price
Per unit
Selling price $ 8.00
Less:
Variable cost $ 6.00
Contribution (Sales - variable
cost)
$ 2.00
Fixed cost per unit $ -
Mark up on sales price $ 2.00
Mark up % 33.33%
c)
Calculation of demand units
Price elasticity 0.5
Change in selling price 2
Original quantity 16000
Original price 8
Change in demand 8000
Demand units 24000
Que 9:
Selection of proposal
Company A Company C
Fixture cost $ 35,000 $ 55,000
Insurance cost $ 9,000 $ 12,000
Electricity charges $ 162,000 $ 108,000
Maintenance $ 14,000 $ 18,000

Marketing and Management
13
charges
Supply cost $ 27,000 $ 30,000
Labour rate $ 9,000 $ 15,000
Total cost $ 256,000 $ 238,000
Above table indicates that the total cost of company A and company B would be $
2,56,000 and $ 2,38,000 respectively. Hence, it is recommended to the company to accept the
proposal of company C because of lesser cost (Higgins, 2012).
Que 10:
Statement of profit and loss a/c
(Amt in
millions)
Sales $ 20.00
Less: Cost of goods sold $ 8.00
Gross profit $ 12.00
Less:
Marketing expenses
Sales salaries $ 3.00
Sales commission $ 1.00
Advertising cost $ 3.00
Freight cost $ 2.00 $ 9.00
Other cost $ 5.00
Net profit -$ 2.00
Cost-Volume-Profit Relationships -
Breakeven
Per Unit
Amounts
Selling price $ 20.00
Variable costs $ 11.00
Contribution margin (Selling price -
variable cost) $ 9.00
Total fixed costs $ 11.00
Breakeven in units (Total fixed cost /
contribution margin) 1.22
Breakeven in dollars (breakeven in
units * selling price) $ 24.44
Paraphrase This Document
Need a fresh take? Get an instant paraphrase of this document with our AI Paraphraser

Marketing and Management
14
References:
Bowles, S., 2009. Microeconomics: behavior, institutions, and evolution. Princeton
University Press.
Brigham, E.F. and Houston, J.F., 2012. Fundamentals of financial management. Cengage
Learning.
DRURY, C.M., 2013. Management and cost accounting. Springer.
Frank, R.H., 2008. Microeconomics and behavior. Boston: McGraw-Hill Irwin,.
Higgins, R.C., 2012. Analysis for financial management. McGraw-Hill/Irwin.
Horngren, C.T., 2009. Cost accounting: A managerial emphasis, 13/e. Pearson Education
India.
Shapiro, A.C., 2008. Multinational financial management. John Wiley & Sons.
1 out of 14
Related Documents

Your All-in-One AI-Powered Toolkit for Academic Success.
+13062052269
info@desklib.com
Available 24*7 on WhatsApp / Email
Unlock your academic potential
© 2024 | Zucol Services PVT LTD | All rights reserved.