Marketing Analytics Assignment: Analysis of Customer Behavior and CLV
VerifiedAdded on 2023/01/17
|7
|2082
|97
Homework Assignment
AI Summary
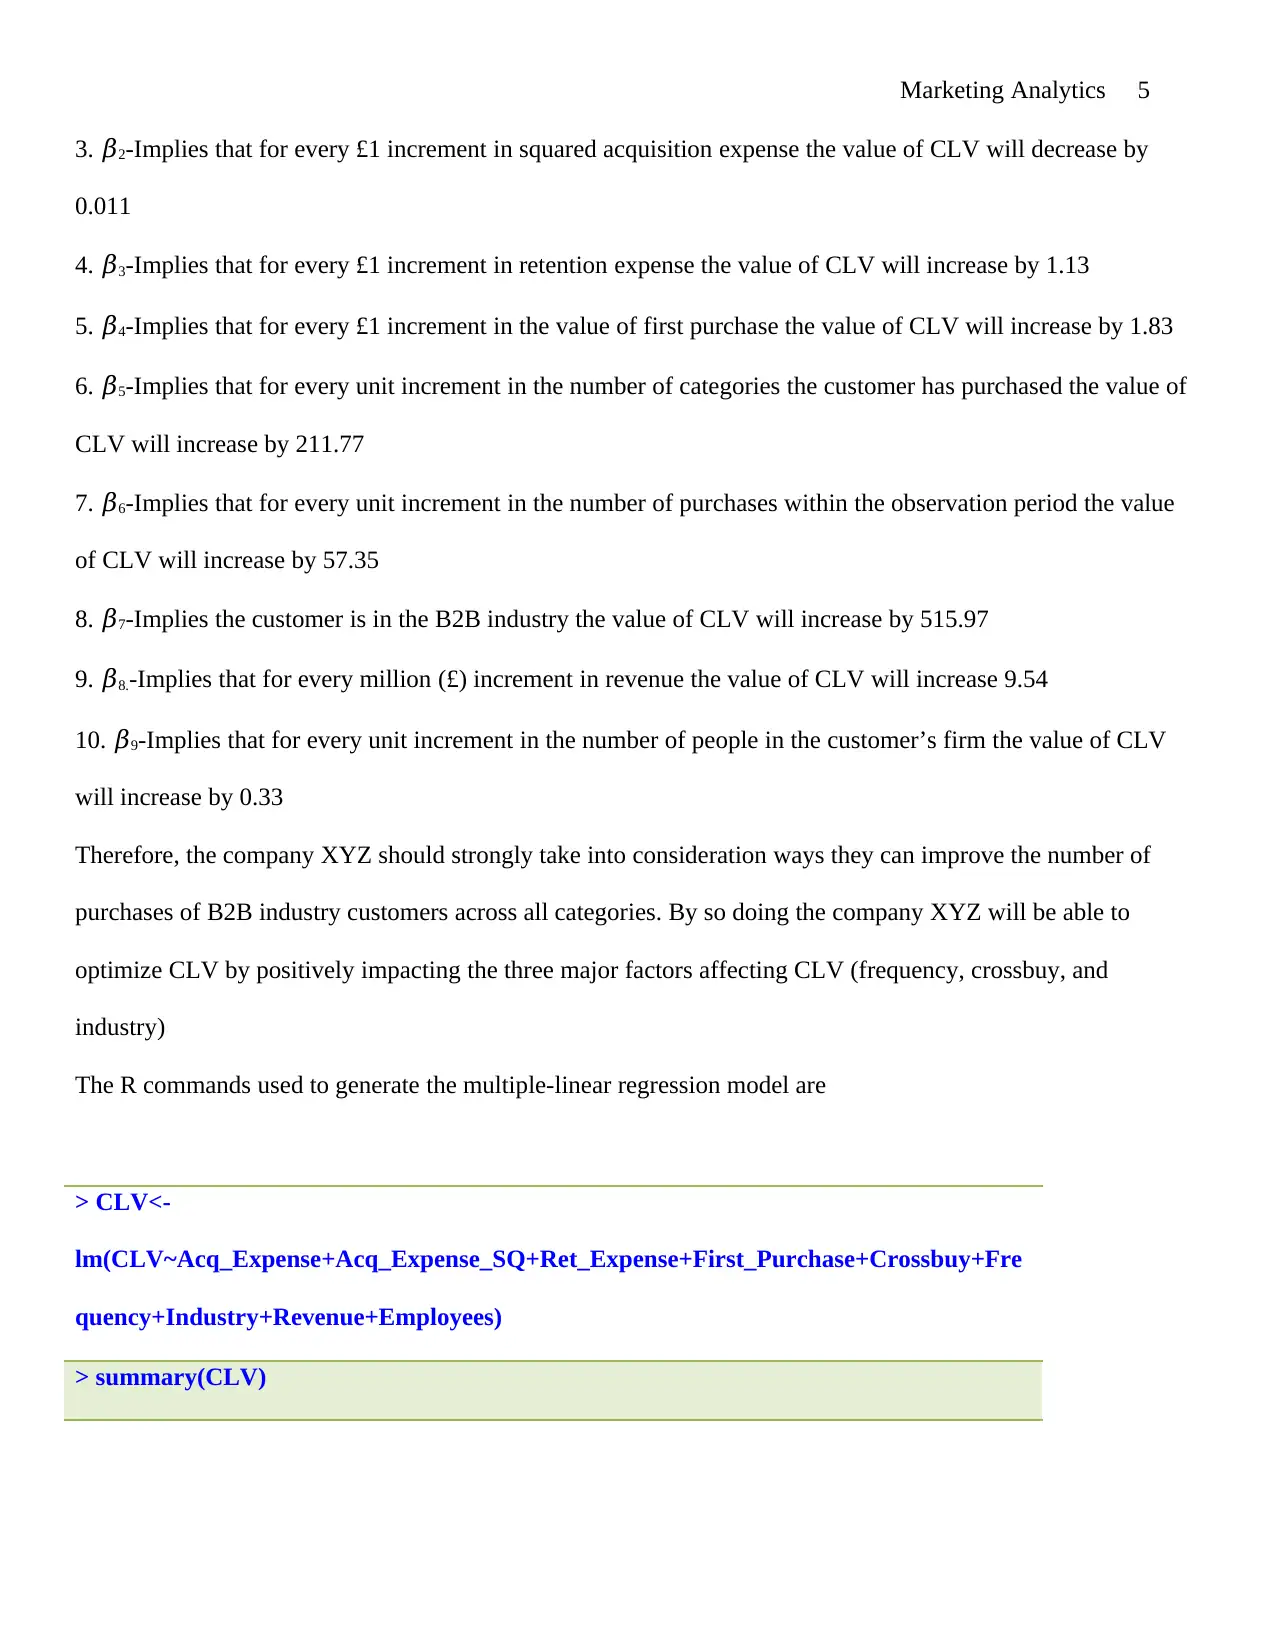
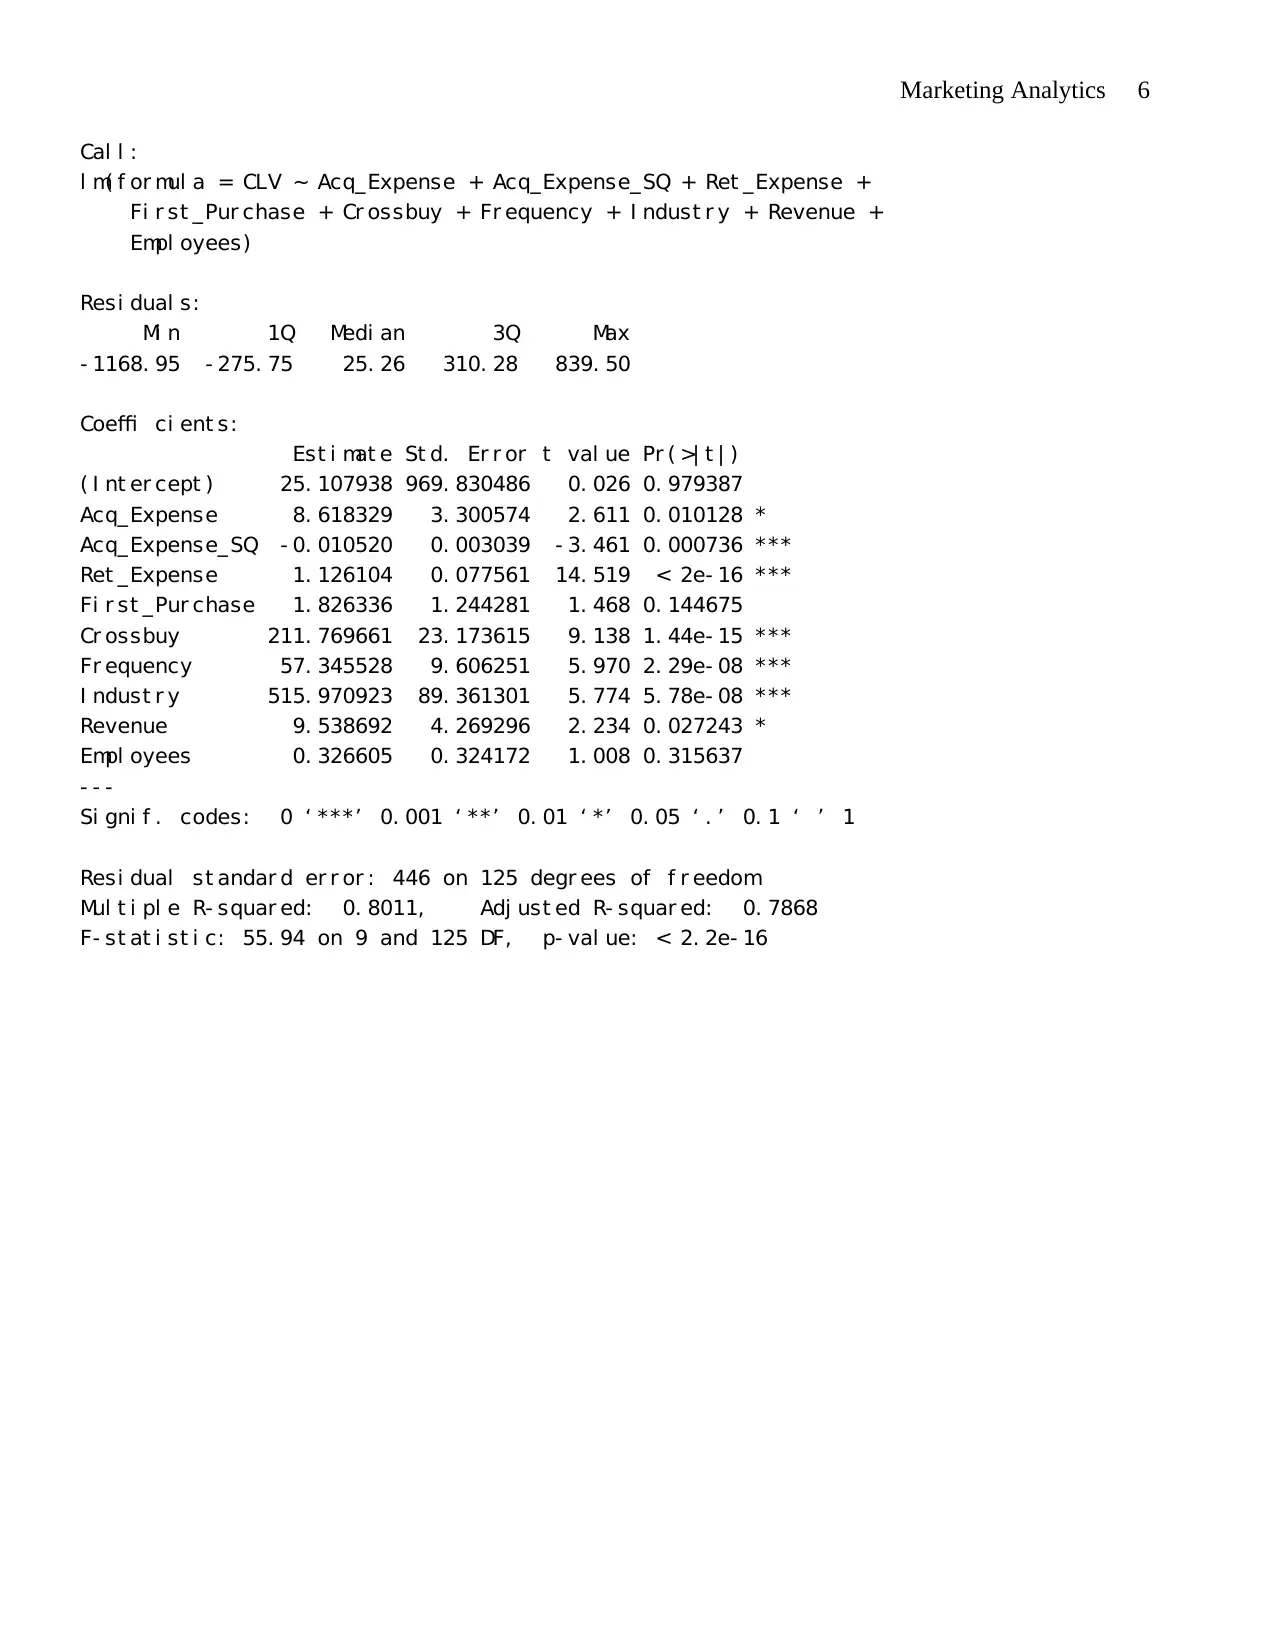
This marketing analytics assignment addresses key questions regarding the value of marketing analytics, analyzes customer behavior in an online travel context, and develops a linear regression model for Customer Lifetime Value (CLV). The assignment begins by critically evaluating the statement that "Marketing Analytics is just a hype, and does not necessarily create value for the firm," using examples from real-world companies like Walmart, Netflix, and Kodak to demonstrate its significance in understanding market trends, customer preferences, and competitive landscapes. The second part of the assignment focuses on analyzing data from an online travel company to determine which hotel types customers are likely to book, employing observation techniques to filter and categorize hotel types based on booking patterns. Finally, the assignment constructs a multiple linear regression model to predict CLV, using variables such as acquisition expense, retention expense, and customer purchase frequency. The model's coefficients are interpreted to provide actionable insights for a company, recommending strategies to optimize CLV through improvements in factors like customer purchase frequency, cross-buying behavior, and industry focus.

Marketing Analytics 1
MARKETING ANALYTICS
By (Name)
The Name of the Class (Course)
Professor (Tutor)
The Name of the School (University)
The City and State where it is located
The Date
MARKETING ANALYTICS
By (Name)
The Name of the Class (Course)
Professor (Tutor)
The Name of the School (University)
The City and State where it is located
The Date
Paraphrase This Document
Need a fresh take? Get an instant paraphrase of this document with our AI Paraphraser

Marketing Analytics 2
Marketing Analytics
Question 1
“Marketing Analytics is just a hype, and does not necessarily create value for the firm.”
Marketing analytics refers to a technology-centric and model-sensitive approach towards the collection and
evaluation of market and customer data for the purpose of decision making in business. Therefore, marketing
analytic seeks to enhance the customer experience from the moment the product/service is introduced to
potential buyers to the final stage when the customer makes the purchase. Marketing analytics has been
employed in businesses throughout history. However, the technological boom of the 20th century created big
data that has lead to the need for specialized knowledge and personnel in matters of marketing analytics. In the
modern world of business, marketing analytics is a critical determinant of success for any organization in a
competitive marketplace. A business needs to understand its niche in the market, customer wants, market size,
market segmentation, and purchasing patterns of consumers; and, the only way a business can gather such
information is through market analytics. As a result, marketing analytics is a value adding proponent for any
business (France & Ghose, 2019).
Marketing analytics has a lot of application in the realm of business strategies and development. An
organization like Walmart employs market analytics to gather intelligence on sales transactions, as a means to
determine which products are enjoying high purchase volume and which products are not being procured by
consumers. Based on historical purchasing trends gathered by Walmart, the organization is able to make
projections on how they should stock their stores to increase revenue based on location, demographics, and
average income of people. Moreover, market analytics allows Walmart to send promotional offers to customers
based on items they have purchased in the past and products they have shown preference towards. Online video
streaming service providers like Netflix and Hulu utilize marketing analytics techniques to gather information
on the movies to recommend to their subscribers based on their viewing history and trending films and TV
series. For example, when a person views a movie on Hulu, he/she automatically get suggestions to view its
sequel or similar films (same genre, subject, director, country, or actors/actresses) (Hauser, 2007).

Marketing Analytics 3
Marketing analytics is recommended for organizations in extremely competitive markets as a way for them to
recognize gaps and exploit shortcoming in service provision. For example, the drive-through service at fast food
restaurant chains was introduced to facilitate the need by customers to procure food without having to search for
parking or leaving their vehicles. Marketing analytics was used to gather information on how customers would
feel about procuring their food without leaving their vehicles. Marketing analytics techniques are also
appropriate for organizations facing limited competition as it allows them to optimize their business models and
services to better their sales revenue. Firm performance is highly dependent on customers; therefore
understanding the changes in customer preference will safeguard the going concern of an organization. For
example, Kodak was not able to recognize the shift in consumer preference towards digital picture and they
ended up losing millions in sales, market share, and brand loyalty (Corrigan, 2014).
Question 2
Hotel Type that Customers will Book
The problem being investigated here is the determination of the hotel type that a customer is likely to book out
of the 100 using qualitative data exploratory techniques. The qualitative data exploratory method that will be
used is observation: this involves the sorting, filtering, and counting of hotels types that are regularly booked by
the customers. The assumption is that the online travel company will be able to better their services to
customers if they are able to determine the hotel types that are booked by customers. The data was loaded into
Microsoft Excel and transformed by applying filters to the package and hotel type columns. Packages were
filtered with regard to a value of 1 and then the hotel types that were filtered out were recorded. Looking at the
data we are able to see that out of the 100 hotel types only two were filtered out when booked was set as
requirement for inclusion. The two hotel types are 38 and 60; hence this two can be removed from the catalogue
as a way to improve the results (Akinci & Sadler-Smith, 2012). The most booked hotel type is 65. Therefore,
customers are most likely to book hotel type 65 because it has been booked by the most people (55). With the
exception of 38 and 60 we expect that customers will be willing to book any of the remaining 98 hotel types.
With regard to the number of children and adults involved the customer is most likely to book hotel 28 if he/she
⊘ This is a preview!⊘
Do you want full access?
Subscribe today to unlock all pages.

Trusted by 1+ million students worldwide

Marketing Analytics 4
does not indicate the number of children (0) and adults (0) that will be traveling. If a single adult is taking the
trip (with or without children) then he/she is most likely to choose hotel type 91. If there are 2, 3, or 4 adults
(with or without children) they are most likely to book hotel type 65, 1, and 87 respectively.
Question 3
Linear Regression Model for Customer Lifetime Value (CLV)
𝐶𝐿𝑉𝑖 = 𝛽0 + 𝛽1 × 𝐴𝑐𝑞_𝐸𝑥𝑝𝑒𝑛𝑠𝑒𝑖 + 𝛽2 × 𝐴𝑐𝑞_𝐸𝑥𝑝𝑒𝑛𝑠𝑒_𝑆𝑄𝑖 + 𝛽3 × 𝑅𝑒𝑡_𝐸𝑥𝑝𝑒𝑛𝑠𝑒𝑖 + 𝛽4
× 𝐹𝑖𝑟𝑠𝑡_𝑃𝑢𝑟𝑐ℎ𝑎𝑠𝑒𝑖 + 𝛽5 × 𝐶𝑟𝑜𝑠𝑠𝑏𝑢𝑦𝑖 + 𝛽6 × 𝐹𝑟𝑒𝑞𝑢𝑒𝑛𝑐𝑦𝑖 + 𝛽7 × 𝐼𝑛𝑑𝑢𝑠𝑡𝑟𝑦𝑖
+ 𝛽8 × 𝑅𝑒𝑣𝑒𝑛𝑢𝑒𝑖 + 𝛽9 × 𝐸𝑚𝑝𝑙𝑜𝑦𝑒𝑒𝑠𝑖 + 𝜀𝑖
The multiple linear regression model about will be run in Rstudio. The regression output will then be interpreted
for the purpose of assessing the implications for XYZ Company. From the regression results indicated below
the model. Can be presented as follows
𝐶𝐿𝑉𝑖 = 25.11 + 8.62 𝐴𝑐𝑞_𝐸𝑥𝑝𝑒𝑛𝑠𝑒𝑖 -0.011 𝐴𝑐𝑞_𝐸𝑥𝑝𝑒𝑛𝑠𝑒_𝑆𝑄𝑖 + 1.13 𝑅𝑒𝑡_𝐸𝑥𝑝𝑒𝑛𝑠𝑒𝑖 + 1.83
𝐹𝑖𝑟𝑠𝑡_𝑃𝑢𝑟𝑐ℎ𝑎𝑠𝑒𝑖 + 211.77 𝐶𝑟𝑜𝑠𝑠𝑏𝑢𝑦𝑖 + 57.35 𝐹𝑟𝑒𝑞𝑢𝑒𝑛𝑐𝑦𝑖 + 515.97 𝐼𝑛𝑑𝑢𝑠𝑡𝑟𝑦𝑖 + 9.54
𝑅𝑒𝑣𝑒𝑛𝑢𝑒𝑖 + 0.33 𝐸𝑚𝑝𝑙𝑜𝑦𝑒𝑒𝑠𝑖
The model is significant at an alpha level of 0.05 this implies that company XYZ can conclude there is a
relationship between the dependent variable (CLV) and the independent variables. The adjusted r-squared is
0.7868 this means that 78.68% of the change in the dependent variable can be explained by the independent
variables. Therefore, the model is a good fit for the data. Nevertheless there are three coefficients that are not
significant at an alpha level of 0.05. These three coefficients are the constant (𝛽0), the coefficient for first
purchase (𝛽4) and the coefficient for employees (𝛽9). The fact that these coefficients are not significant means
that first purchase and employee variables can be omitted from the model as a way of improving the ability of
the model to predict CLV (Golberg & Cho, 2010). The coefficients can be interpreted as follows:
1. 𝛽0-Implies that when all the variables are zero the value of CLV will be 25.11
2. 𝛽1-Impplies that for every £1 increment in acquisition expense the value of CLV will increase by 8.62
Paraphrase This Document
Need a fresh take? Get an instant paraphrase of this document with our AI Paraphraser

Marketing Analytics 5
3. 𝛽2-Implies that for every £1 increment in squared acquisition expense the value of CLV will decrease by
0.011
4. 𝛽3-Implies that for every £1 increment in retention expense the value of CLV will increase by 1.13
5. 𝛽4-Implies that for every £1 increment in the value of first purchase the value of CLV will increase by 1.83
6. 𝛽5-Implies that for every unit increment in the number of categories the customer has purchased the value of
CLV will increase by 211.77
7. 𝛽6-Implies that for every unit increment in the number of purchases within the observation period the value
of CLV will increase by 57.35
8. 𝛽7-Implies the customer is in the B2B industry the value of CLV will increase by 515.97
9. 𝛽8.-Implies that for every million (£) increment in revenue the value of CLV will increase 9.54
10. 𝛽9-Implies that for every unit increment in the number of people in the customer’s firm the value of CLV
will increase by 0.33
Therefore, the company XYZ should strongly take into consideration ways they can improve the number of
purchases of B2B industry customers across all categories. By so doing the company XYZ will be able to
optimize CLV by positively impacting the three major factors affecting CLV (frequency, crossbuy, and
industry)
The R commands used to generate the multiple-linear regression model are
> CLV<-
lm(CLV~Acq_Expense+Acq_Expense_SQ+Ret_Expense+First_Purchase+Crossbuy+Fre
quency+Industry+Revenue+Employees)
> summary(CLV)

Marketing Analytics 6
Cal l :
l m( f or mul a = CLV ~ Acq_Expense + Acq_Expense_SQ + Ret _Expense +
Fi r st _ Pur chase + Cr ossbuy + Fr equency + I ndust r y + Revenue +
Empl oyees)
Resi dual s:
Mi n 1Q Medi an 3Q Max
- 1168. 95 - 275. 75 25. 26 310. 28 839. 50
Coeffi ci ent s:
Est i mat e St d. Er r or t val ue Pr ( >| t | )
( I nt er cept ) 25. 107938 969. 830486 0. 026 0. 979387
Acq_Expense 8. 618329 3. 300574 2. 611 0. 010128 *
Acq_Expense_ SQ - 0. 010520 0. 003039 - 3. 461 0. 000736 * **
Ret _Expense 1. 126104 0. 077561 14. 519 < 2e- 16 * **
Fi r st _Pur chase 1. 826336 1. 244281 1. 468 0. 144675
Cr ossbuy 211. 769661 23. 173615 9. 138 1. 44e- 15 * **
Fr equency 57. 345528 9. 606251 5. 970 2. 29e- 08 * **
I ndust r y 515. 970923 89. 361301 5. 774 5. 78e- 08 * **
Revenue 9. 538692 4. 269296 2. 234 0. 027243 *
Empl oyees 0. 326605 0. 324172 1. 008 0. 315637
- - -
Si gni f . codes: 0 ‘ ***’ 0. 001 ‘ **’ 0. 01 ‘ *’ 0. 05 ‘ . ’ 0. 1 ‘ ’ 1
Resi dual st andar d er r or : 446 on 125 degr ees of f r eedom
Mul t i pl e R- squar ed: 0. 8011, Adj ust ed R- squar ed: 0. 7868
F- st at i st i c: 55. 94 on 9 and 125 DF, p- val ue: < 2. 2e- 16
⊘ This is a preview!⊘
Do you want full access?
Subscribe today to unlock all pages.

Trusted by 1+ million students worldwide

Marketing Analytics 7
References
Akinci, C., & Sadler-Smith, E. 2012. Intuition in management research: A historical review. International .
Journal of Management Reviews , 14 (1), pp104-122.
Corrigan, D. 2014. Big Data Integration -What It Is and Why You Need It. (D. Pittman, Interviewer)
France, S., & Ghose, S., 2019. Marketing Analytics: Methods, Practice, Implementation, and Links to Other
Fields. Epxert Systems with Applications , pp 456-475.
Golberg, M., & Cho, H. A. 2010. Introduction to Regression Analysis (2nd Edition ed.). Ashurst, United
Kingdom: Wessex Institute of Technology, WIT press.
Hauser, J. 2007. Marketing analytics: The evolution of marketing research in the twenty-first century. Direct
Marketing An International Journal , pp38-54.
1 out of 7
Related Documents

Your All-in-One AI-Powered Toolkit for Academic Success.
+13062052269
info@desklib.com
Available 24*7 on WhatsApp / Email
Unlock your academic potential
Copyright © 2020–2025 A2Z Services. All Rights Reserved. Developed and managed by ZUCOL.