Customer Churn Analysis in Online Gaming: A Marketing Project
VerifiedAdded on 2020/04/07
|10
|3500
|214
Project
AI Summary
This project investigates customer churn in the online gaming and betting industry, a sector experiencing rapid growth and increasing competition. The study focuses on a case company expanding its services to include various online games and tournaments. The research aims to identify key factors influencing customer churn and predict player disengagement using decision trees and the RFM (Recency, Frequency, Monetary) model, both data mining techniques. The analysis seeks to answer questions such as which player types have higher churn rates, the profiles of high-churn players, and the effectiveness of the analytical methods. A literature review highlights the importance of measuring player engagement metrics and the use of predictive modeling techniques. The methodology involves constructing a decision tree model using the C&R (Classification and Regression) tree method in IBM SPSS and developing an RFM model in Microsoft Excel. The results, including the model summary, independent variables included, number of nodes and terminal nodes, and the decision tree diagram, are discussed, along with a comparison of the two models, to provide strategic recommendations for the case company to improve customer retention and make evidence-based decisions.
Marketing Analytics
1.1 Introduction and problem definition
Online gaming and betting is one of most growing sectors in recent years. With rapid innovation
in information technology and communication devices the online gaming and betting industry is
becoming popular day by day. However with many new players are entering in the virtual
gaming and betting business which has increase competition and the exiting players are not able
to grasp the market share as before. With increase in the new players, competition in acquisition
of players has increase and the total revenue have declined(McCarty & Hastak, 2007; Xie,
Devlin, & Kudenko, 2016). In such scenario the CPM (customer relationship management) has
become a vital part for ever gaming companies to make the business profitable.
In this research also the selected company has expand its business. Earlier it was only involved
in the betting business. However over the period of time the market for gaming was increasing at
very fast rate, so the case company decided to expand business and start offering other services
also; such as soft games, casino games and poker along with the sports betting. Currently the
case company is offering more than 1000 online games and casino tournaments also. Now with
increasing competition the case company is worried about the increasing disengagement of the
players.
Given the customer retention problem for the case company this research is aimed to find the
most important factors affecting the online gaming behavior its customers and predict the
customers churn. This will help the case company to make strategies which are more effective
and also provide scope for evidence based decision. For the analysis decisions trees and the
RFM model will be used. These methods are part of data mining which has become very popular
for business research.
This research is aimed to answer following questions:
1) Which types of players have more churn rate in online gaming?
2) What is the profile of the players, who have high churn rate?
3) What is the difference between the previous and the new method for studying player’s
behavior? Which one is more effective?
Paraphrase This Document
Need a fresh take? Get an instant paraphrase of this document with our AI Paraphraser
1.2 Literature review
Every business organizations in the online gaming industry are interested in the measuring the
behavior metric of the player engagement (Mahlmann, Drachen, Canossa, & Yannakakis, 2010).
To predict the behavior of the players the gaming analyst are using the predictive modeling
techniques, which helps to mitigate risk using different statistical models. According to (El-
Nasr, Drachen, & Canossa, 2013) gaming analytics helps to discover important patterns in the
gaming metric which helps in the decision making process.
Churn prediction
Churn is defined as the “trend of leaving game’ by the players and there has been many previous
studies who tried to predict the churn(Runge, Gao, Garcin, & Faltings, 2014). According to the
(Coussement & De Bock, 2013) churn prediction is the process to identify the players who have
probability of leaving the game on the basis of previous behavior.
There are different analytics techniques which can be used for predictive modeling in gaming
analytics. Some of the most used methods are discussed below:
a) Decision tree
As the name suggest a decision tree has similar structure as the standard tree which has different
nodes and branches and the leave follows the standard strategy of divide and conquer.
Researchers argue that decision tree is one of the most relevant techniques which are easy to
interpret(Delfabbro, King, & Griffiths, 2012; Mahlmann et al., 2010). Also using the decision
tree the hidden links between the various leaves can be interpreted. Analyzing data using the
decision tree is a two step process. The first step is to select the important explanatory variables
from all the input variables and split the observations in the small subsets which have similar
pattern or values. In the second step the model is generated and the rules identified in the first
step are used to classify all the items into different groups. On the basis of this final groups
business entities can prepare their strategies(Linof & Berry, 2011).
b) Regression Model
Regression models are used to find which independent variables have significant impacts on the
dependent/target variable. In case of the less number of independent variable with large number
of observation, regression models are most appropriate. Similarly regression model is able to
predict the change in the dependent variable when the independent variables are changed,
however the casual relationship the dependent variable and the independent variable is required.
Among the various regression models the logistic regression model is the most used model for
predictive analytics(Armstrong, 2012).
c) Clustering analysis
Another popular technique for predictive modeling in gaming analytics is the clustering analysis.
Cluster analysis helps to divide into different clusters, subsets of the group of the clusters from
the observations which have similar characteristics. There have are many clustering models
developed, however k means clustering is the most used clustering method(Correa, González,
Nieto, & Amezquita, 2012).
1.3 Methodology and empirical review
For this research to predict the customer churn decision tree model has been developed. In
decision tree also there are various option which one can use for binary classification. In this
case the classification and Regression (C&R) tree method has been followed. In C&R method
the training data is split into different segments using the recursive partitioning. In this case the
C&R model was developed in IBM SPSS using the following procedure.
The training data was used to build the C&R tree model, which has 2000 observations for the
time period February 2005 to January 2007. There are total 10 variables in the data sets, however
the data for customer ID was not used in decision tree model. Out of the 9 remaining variable the
churn was used as the dependent variable, which takes the value 1 for churner and 0 for non-
churner. Other variables in the data set were used as the independent variables. The main process
is to set rules for decision tree using the training data and apply those rules in test data to predict
the churn rate.
Evaluation criteria
The minimum threshold to decide the nodes has been taken as 0.5 (50%). In other words to for
prediction only those metric will be used whether the churn percentage is 50 % or more.
Similarly minimum number of sample size has been defined as 100 for parent node and 50 for
child node. The maximum number of level for decision tree has been set as 5, which is most
appropriated for the C&R tree. In case of CHAID only three levels are used. In terms of
orientation the top down orientation was used to construct the decision tree. Similarly for
impurity measure the Gini technique was used.
RFM Model
In the second part of the analysis another model was constructed using the traditional RFM
( recency, frequency and monetary) model. The RFM model was performed in the Microsoft
excel using the same training data. In the RFM model initially the recency score, frequency
score and the monetary score was calculated on the basis of given data.
Methodology:
Firstly we need to aggregate the data at customer level & get these three important variables.
⊘ This is a preview!⊘
Do you want full access?
Subscribe today to unlock all pages.
Trusted by 1+ million students worldwide
For each series, using quintile method we ranked them from 1-5, 1 being lowest & 5 being
highest. For recency, lower the value higher will be the rank. For frequency & monetary value
higher the value more rank it will get. Once we get recency, frequency & monetary score, we
concatenate for the final RFM score. Recency is given more weightage, then frequency &
monetary value respectively.
Based on the business requirement, the total customer base can be divided into different groups
using RFM score.
Champions Customer
Loyal Customers
Potential Loyalist
New Customer etc.
1.4 Results and discussion
In the first section results from the binary classification using the C&R tree has been discussed
followed by the results from the RFM model. Lastly the comparison has been done for two
different models.
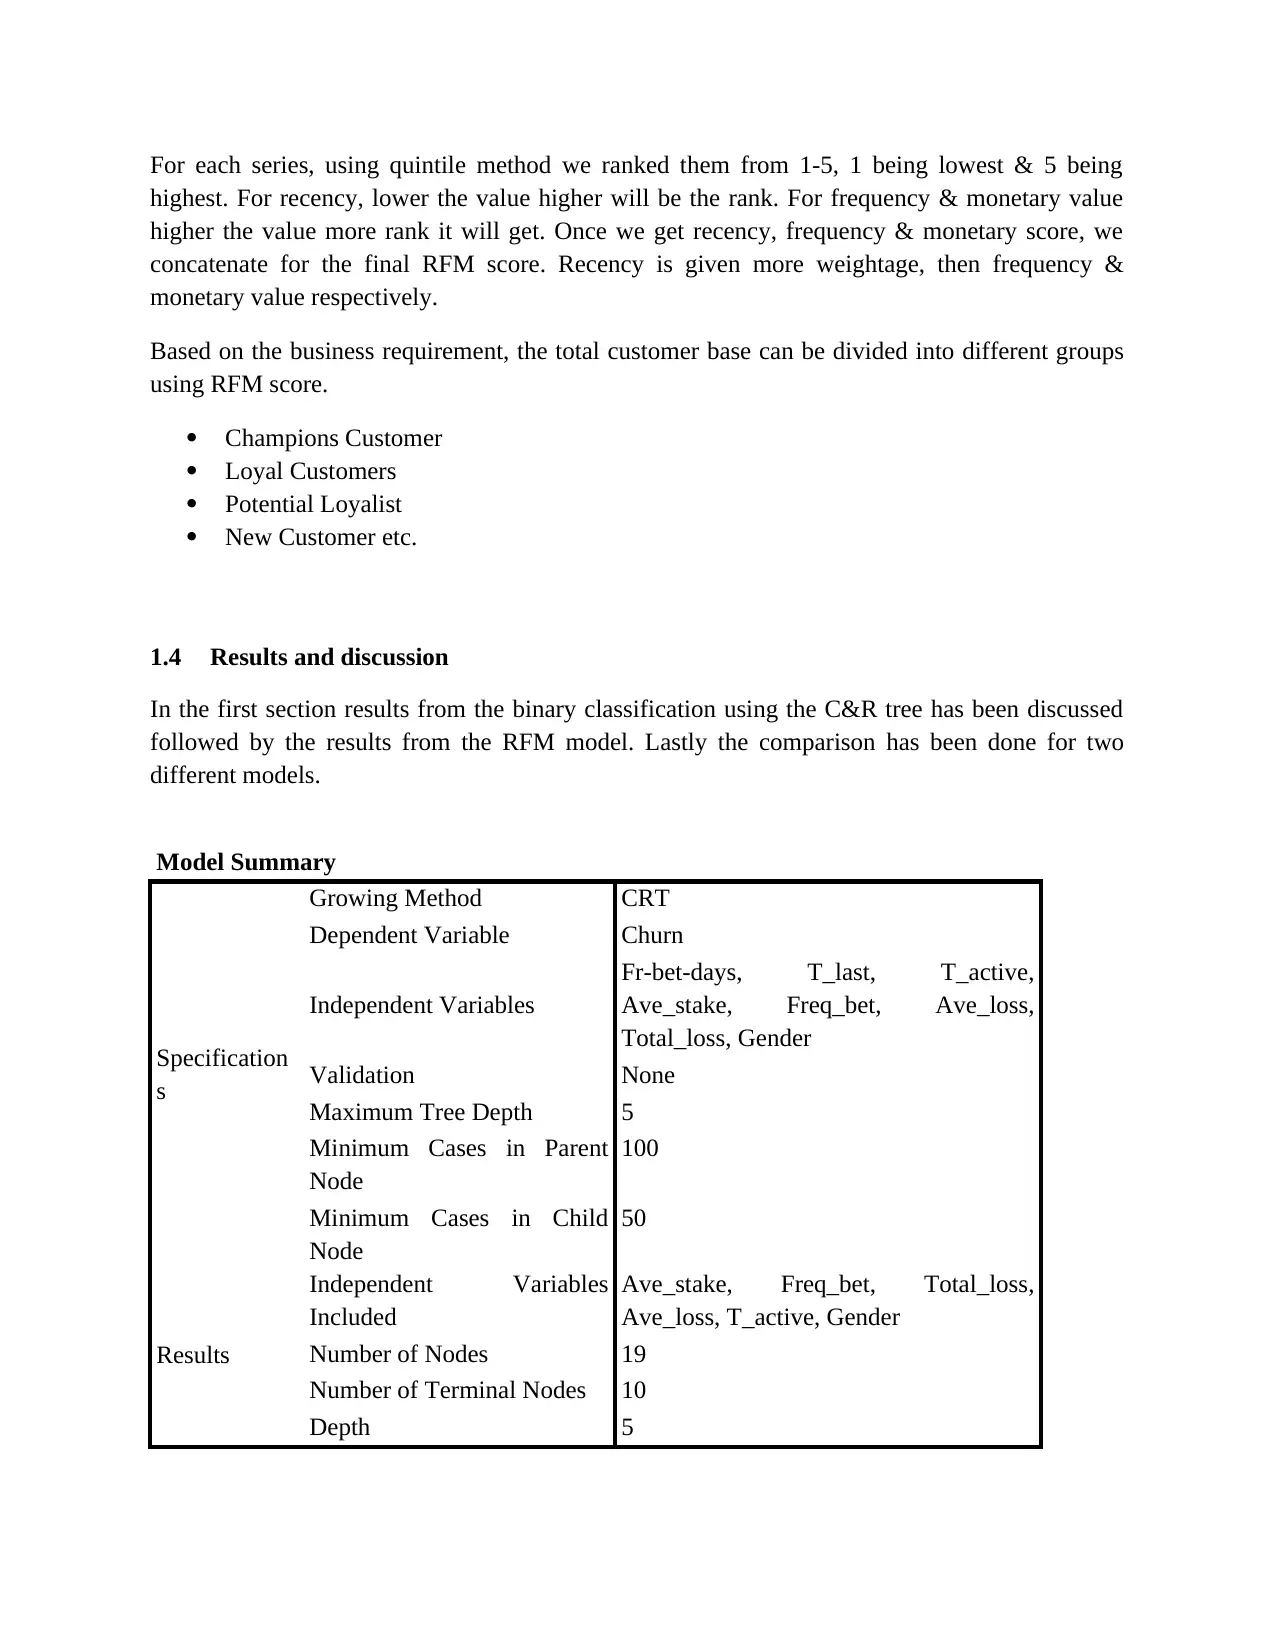
Model Summary
Specification
s
Growing Method CRT
Dependent Variable Churn
Independent Variables
Fr-bet-days, T_last, T_active,
Ave_stake, Freq_bet, Ave_loss,
Total_loss, Gender
Validation None
Maximum Tree Depth 5
Minimum Cases in Parent
Node
100
Minimum Cases in Child
Node
50
Results
Independent Variables
Included
Ave_stake, Freq_bet, Total_loss,
Ave_loss, T_active, Gender
Number of Nodes 19
Number of Terminal Nodes 10
Depth 5
highest. For recency, lower the value higher will be the rank. For frequency & monetary value
higher the value more rank it will get. Once we get recency, frequency & monetary score, we
concatenate for the final RFM score. Recency is given more weightage, then frequency &
monetary value respectively.
Based on the business requirement, the total customer base can be divided into different groups
using RFM score.
Champions Customer
Loyal Customers
Potential Loyalist
New Customer etc.
1.4 Results and discussion
In the first section results from the binary classification using the C&R tree has been discussed
followed by the results from the RFM model. Lastly the comparison has been done for two
different models.
Model Summary
Specification
s
Growing Method CRT
Dependent Variable Churn
Independent Variables
Fr-bet-days, T_last, T_active,
Ave_stake, Freq_bet, Ave_loss,
Total_loss, Gender
Validation None
Maximum Tree Depth 5
Minimum Cases in Parent
Node
100
Minimum Cases in Child
Node
50
Results
Independent Variables
Included
Ave_stake, Freq_bet, Total_loss,
Ave_loss, T_active, Gender
Number of Nodes 19
Number of Terminal Nodes 10
Depth 5
Paraphrase This Document
Need a fresh take? Get an instant paraphrase of this document with our AI Paraphraser
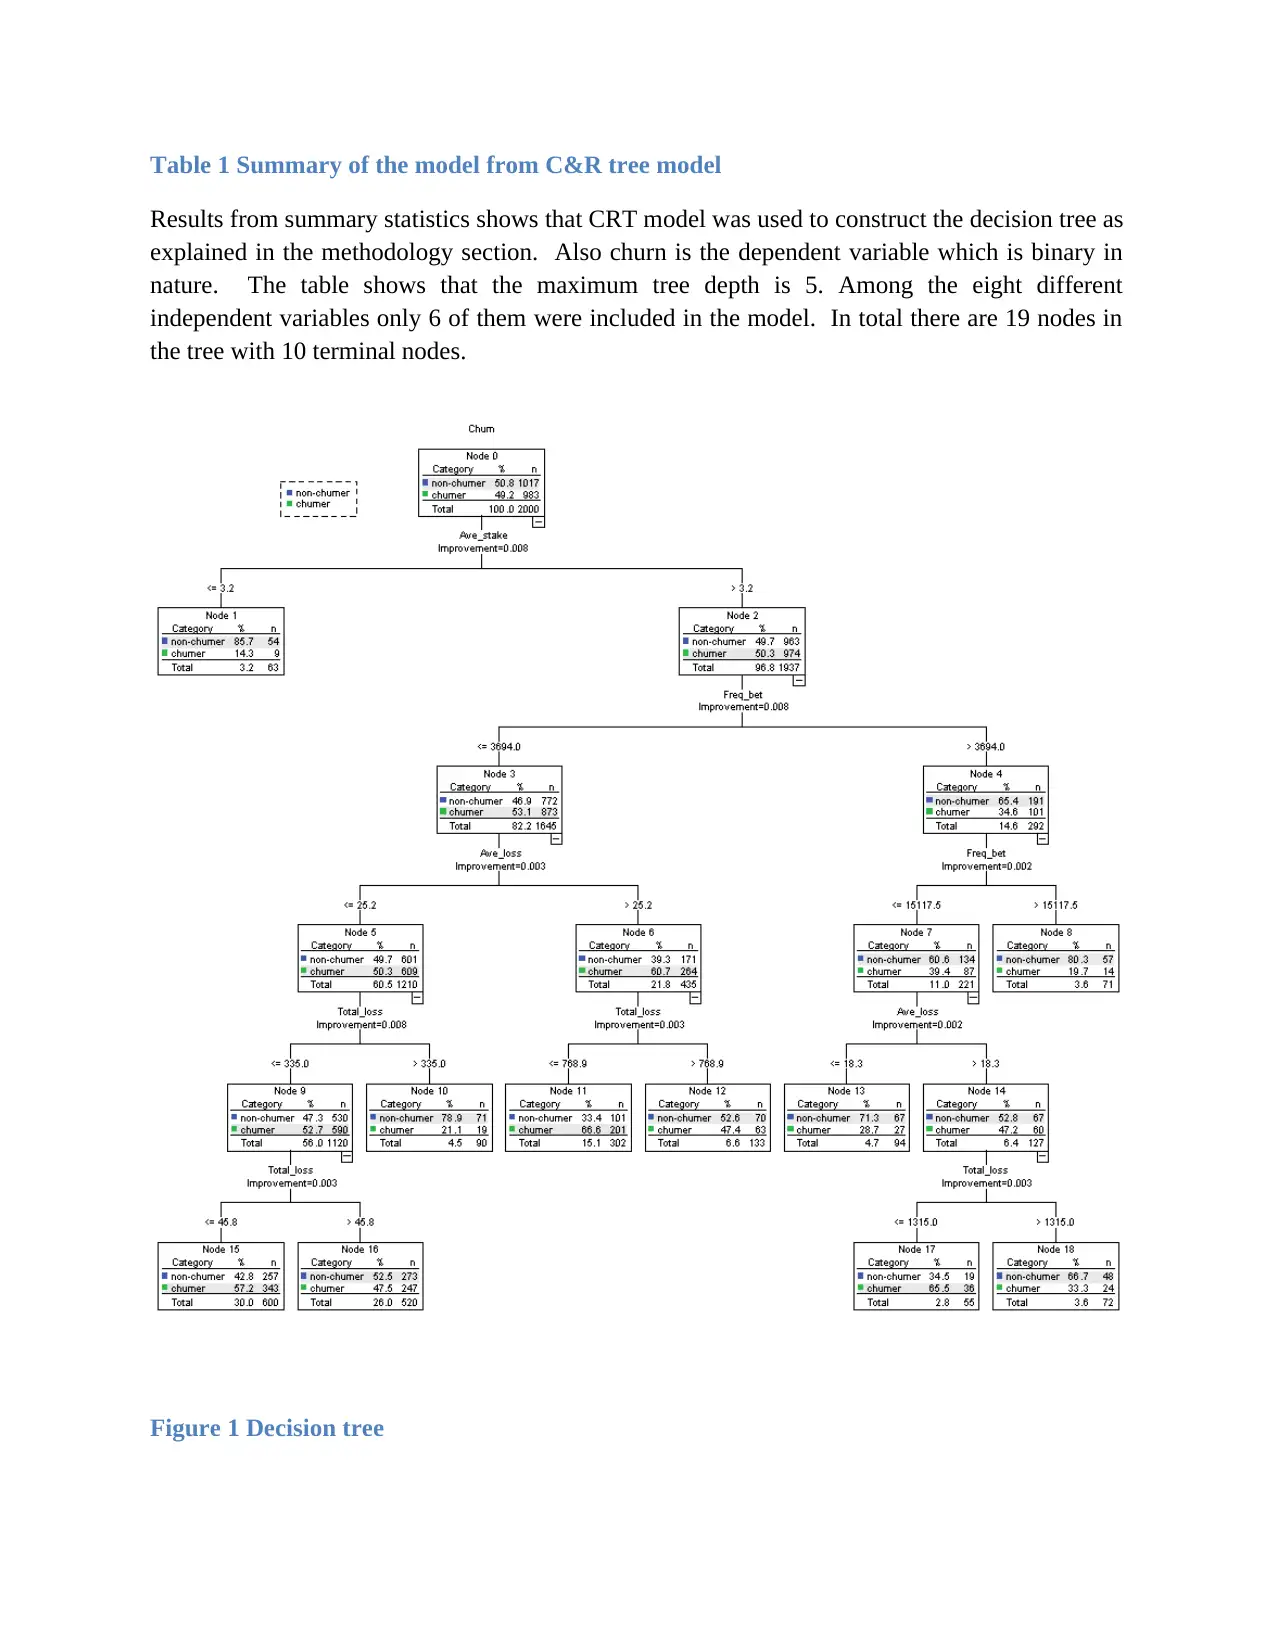
Table 1 Summary of the model from C&R tree model
Results from summary statistics shows that CRT model was used to construct the decision tree as
explained in the methodology section. Also churn is the dependent variable which is binary in
nature. The table shows that the maximum tree depth is 5. Among the eight different
independent variables only 6 of them were included in the model. In total there are 19 nodes in
the tree with 10 terminal nodes.
Figure 1 Decision tree

On the basis of given criteria mentioned in the methodology section the decision tree has been
constructed and is presented in the above figure. The first node from the tree shows that 50.8 %
of the players in the data set are non-churners whereas 49.2 % are churners. The main task is to
find the nodes which have highest percentage of churn; so that their behavior can be analyzed
and required strategies can be implemented to reduce the churn rate.
As the figure shows the average stake was the first independent variable on the basis of which
the classification is done. This shows that if the average stake value is less than or equal to 3.2
then the churn percentage is quite low (14.3 %), however if the average stake is more than 3.2
then the churn percentage do not change much from the original churn. So the node for average
stake value of 3.2 or less is ended there only as the churn percentage is low there.
Now in the second level where the churn rate is more than 3.2, then the classification is done on
the basis of the frequency. So, second important variable is the frequency, which shows the total
number of bets during the observation period. Node 3 and Node 4 are created on the basis of this
frequency variable. Node 3 shows that if the frequency is less than or equal to 3694 then the
churn rate increase to 53.1 % whereas if the frequency is more than 3694 then the churn rate
decrease to 346 %. This shows that with increase in the number of bets the engagement of the
players increases.
Now again classifying the Node 3 on the basis of average loss, shows that churn rate and non-
churn rate are almost equal if average loss is less than or equal to 25.2. On the other hand the
churn rate increases if average loss is greater than 25.2. So, if the players are losing less money
they continue to play the game or are expected to return in the game. However with higher loss
the most of the players do not return. In case of Node 4, the child nodes do not show higher
churn rate thereafter. The high churn rate is shown at Node 17, however the frequency is low.
So, one can ignore it.
In the next level the classification variable is total loss. In the results Node 9, shows that players
whose average loss is 25.2 or less have high churn rate if the total loss is less than or equal to
335. On the other hand if total loss is greater than 335 then churn rate comes down. This is may
be due to the reason that, once high amount of money is lost, players continue to play to recover
the loss. All the nodes and the classifiers independent variable are shown in the decision tree
above.
Among all the nodes in the tree the most interesting nodes for this research are Node 11 and
Node 15. In case of Node 11 the churn rate is 66.6 % with sample size of 201. Similarly in Node
15 the churn rate is 57.2 % with sample size of 343. So these two nodes have been selected to
decide the rule for the test data.
So to reach Node 11 following filters were applied in the test data to predict the churn rate.
-filter the data using average stake (less than or equal to 3.2 and more than 3.2)
⊘ This is a preview!⊘
Do you want full access?
Subscribe today to unlock all pages.
Trusted by 1+ million students worldwide
-if average stake is less than 3.2 then filter that using the frequency bet (less than or equal to
3694 and more than 3694)
- if frequency is less than 3694, then filter that using average loss ( less than or equal to 25.2 or
greater than 25.2)
-if average loss is greater than 25.2 then filter that using total loss (less than or equal to 768.9 and
more than 768.9)
_ so Node 11 is, if the total loss is less than or equal to 768.9
Similarly the rules for Node 15 can also be identified. The identified filter and the rules for filter
were used in the test data and churn rate was predicted. Similarly the players who are included in
Node 11 were coded 1 and others as 0. Results for the churn rate and predicted churn are shown
in the excel sheet.
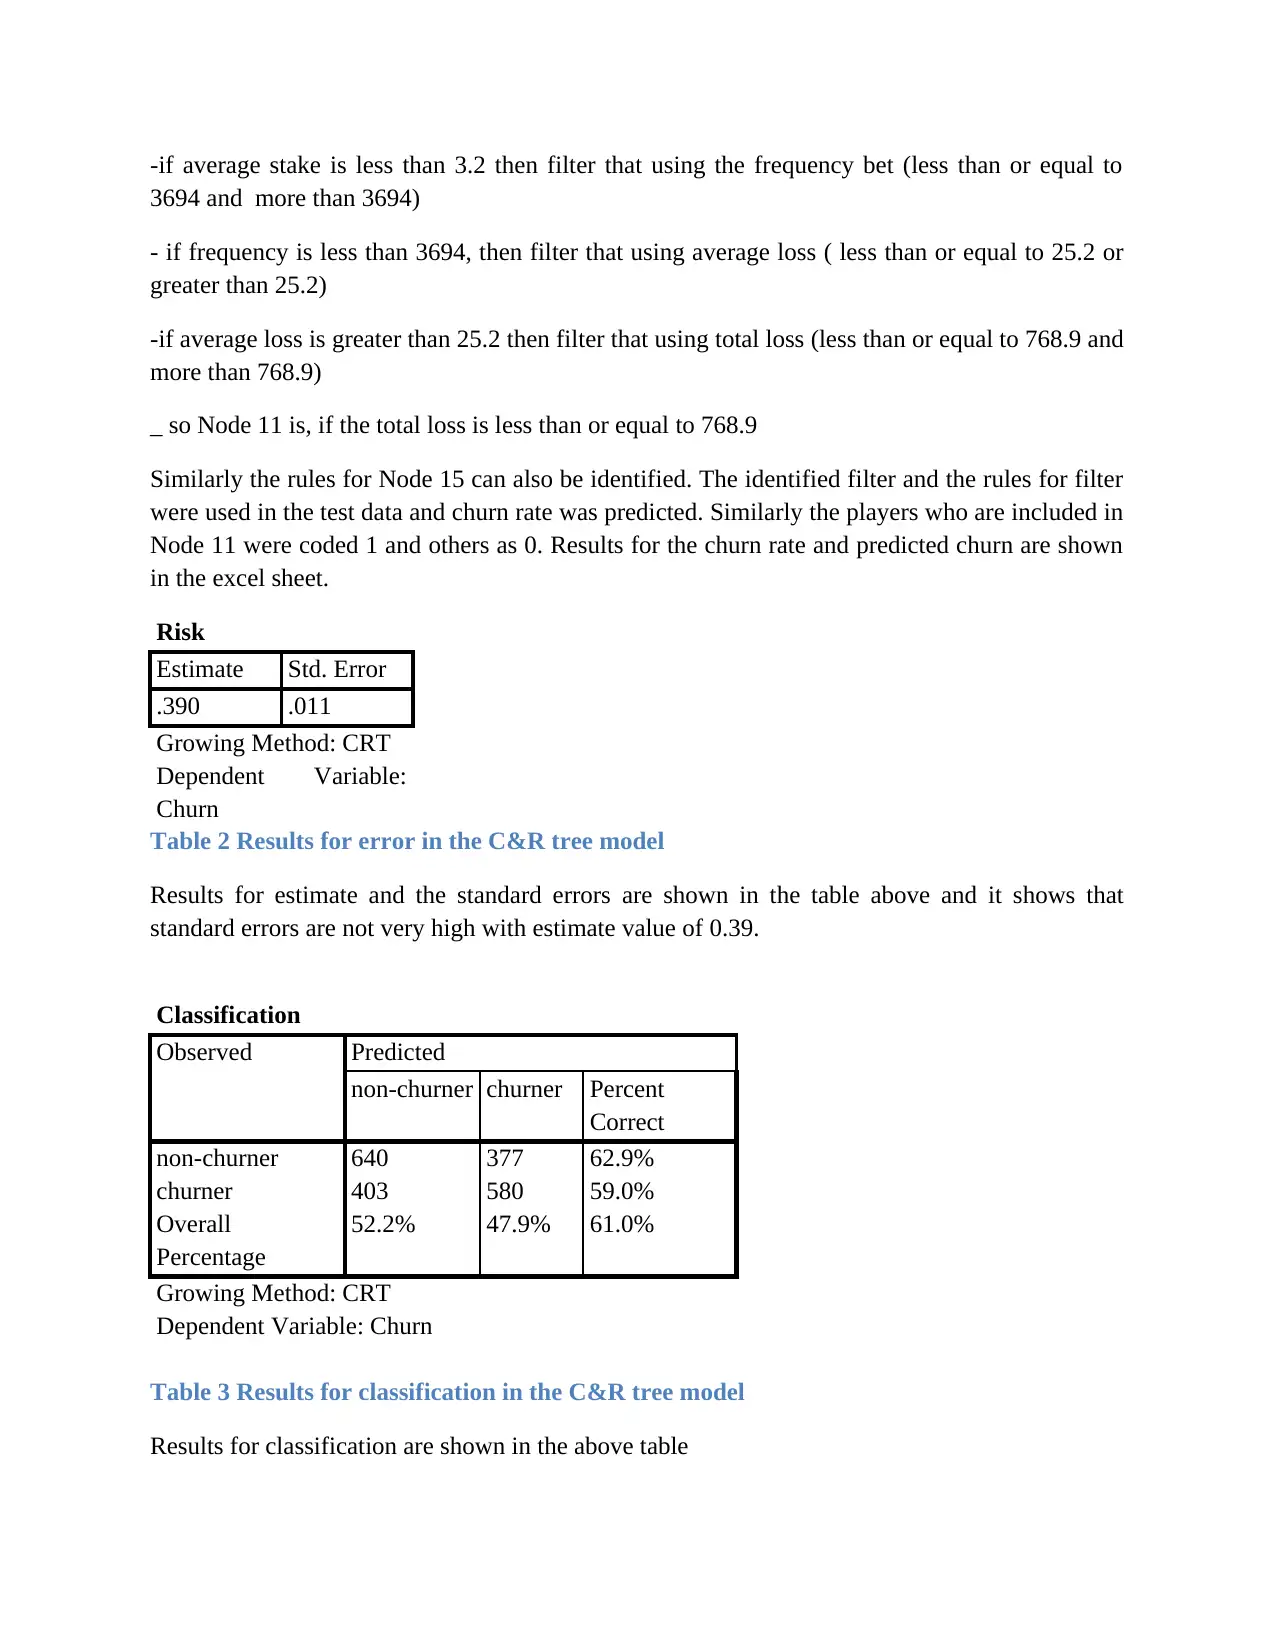
Risk
Estimate Std. Error
.390 .011
Growing Method: CRT
Dependent Variable:
Churn
Table 2 Results for error in the C&R tree model
Results for estimate and the standard errors are shown in the table above and it shows that
standard errors are not very high with estimate value of 0.39.
Classification
Observed Predicted
non-churner churner Percent
Correct
non-churner 640 377 62.9%
churner 403 580 59.0%
Overall
Percentage
52.2% 47.9% 61.0%
Growing Method: CRT
Dependent Variable: Churn
Table 3 Results for classification in the C&R tree model
Results for classification are shown in the above table
3694 and more than 3694)
- if frequency is less than 3694, then filter that using average loss ( less than or equal to 25.2 or
greater than 25.2)
-if average loss is greater than 25.2 then filter that using total loss (less than or equal to 768.9 and
more than 768.9)
_ so Node 11 is, if the total loss is less than or equal to 768.9
Similarly the rules for Node 15 can also be identified. The identified filter and the rules for filter
were used in the test data and churn rate was predicted. Similarly the players who are included in
Node 11 were coded 1 and others as 0. Results for the churn rate and predicted churn are shown
in the excel sheet.
Risk
Estimate Std. Error
.390 .011
Growing Method: CRT
Dependent Variable:
Churn
Table 2 Results for error in the C&R tree model
Results for estimate and the standard errors are shown in the table above and it shows that
standard errors are not very high with estimate value of 0.39.
Classification
Observed Predicted
non-churner churner Percent
Correct
non-churner 640 377 62.9%
churner 403 580 59.0%
Overall
Percentage
52.2% 47.9% 61.0%
Growing Method: CRT
Dependent Variable: Churn
Table 3 Results for classification in the C&R tree model
Results for classification are shown in the above table
Paraphrase This Document
Need a fresh take? Get an instant paraphrase of this document with our AI Paraphraser
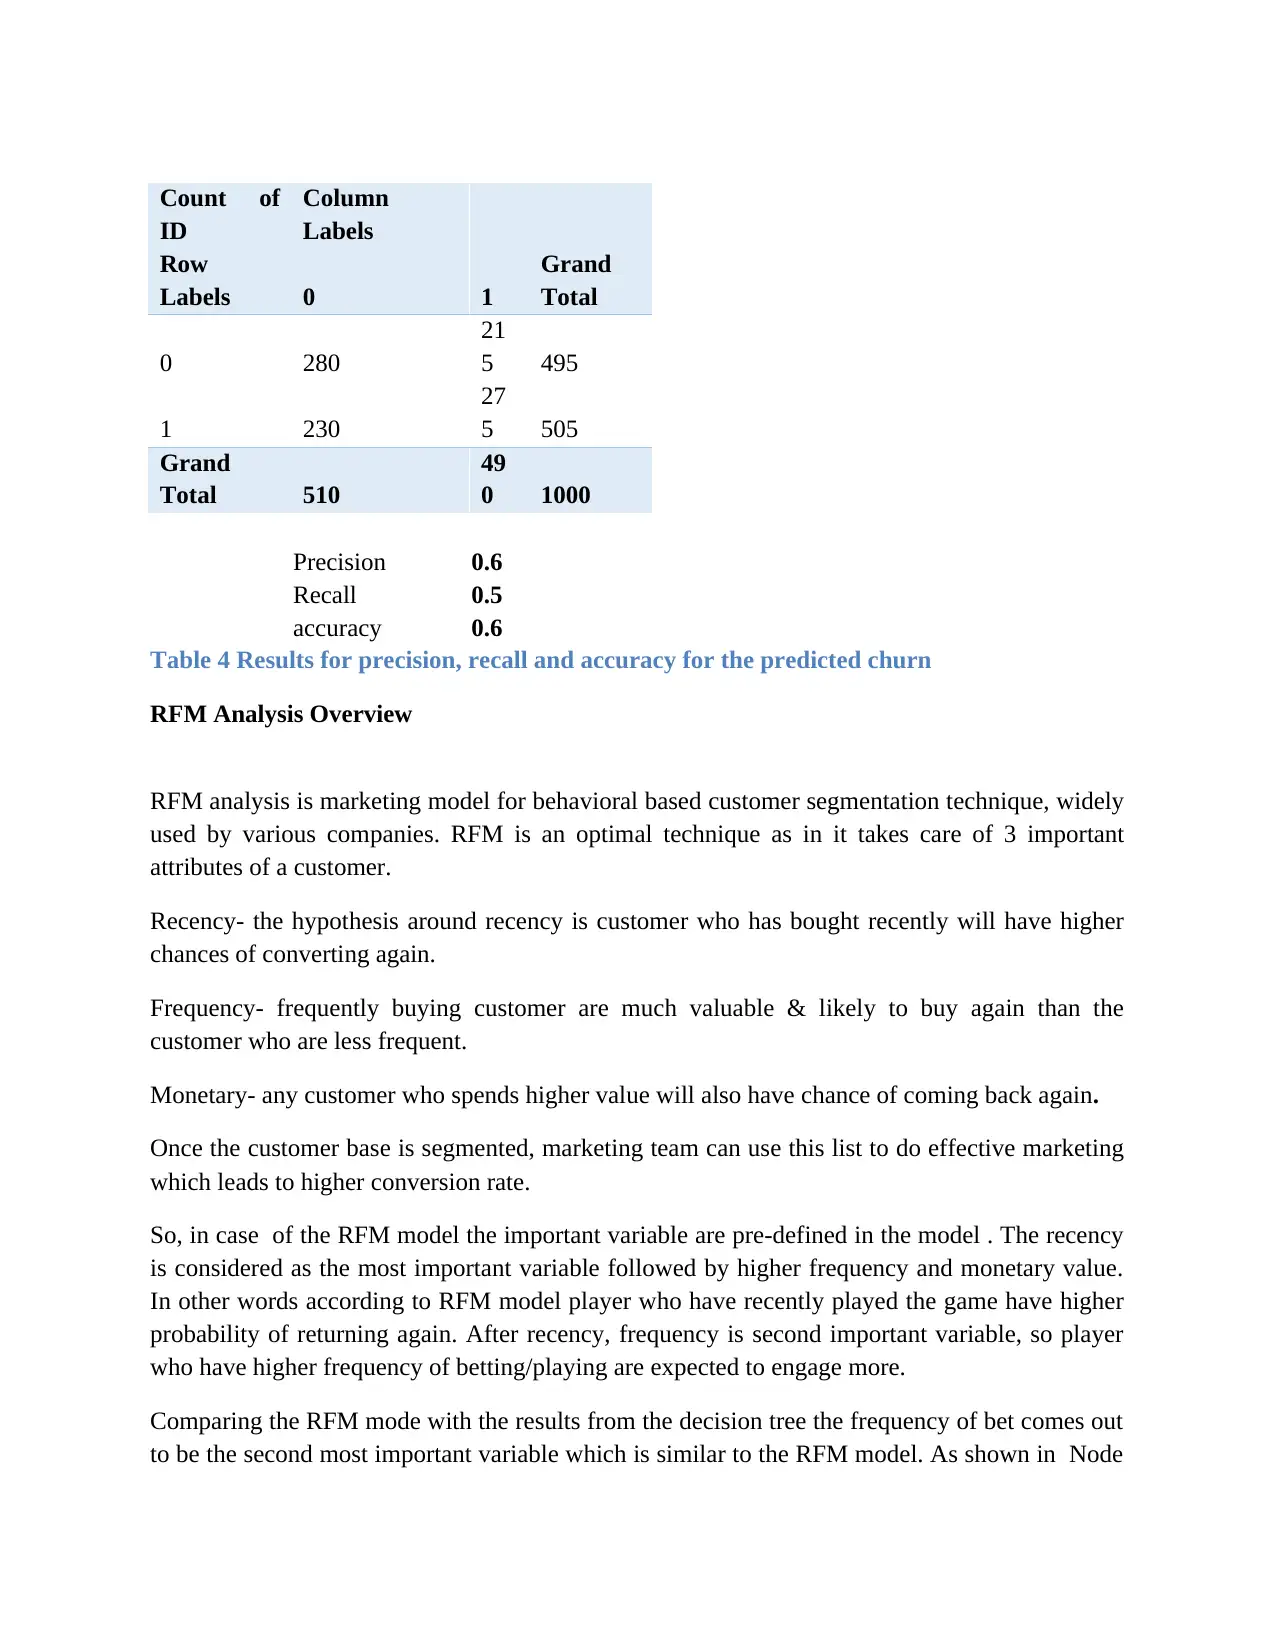
Count of
ID
Column
Labels
Row
Labels 0 1
Grand
Total
0 280
21
5 495
1 230
27
5 505
Grand
Total 510
49
0 1000
Precision 0.6
Recall 0.5
accuracy 0.6
Table 4 Results for precision, recall and accuracy for the predicted churn
RFM Analysis Overview
RFM analysis is marketing model for behavioral based customer segmentation technique, widely
used by various companies. RFM is an optimal technique as in it takes care of 3 important
attributes of a customer.
Recency- the hypothesis around recency is customer who has bought recently will have higher
chances of converting again.
Frequency- frequently buying customer are much valuable & likely to buy again than the
customer who are less frequent.
Monetary- any customer who spends higher value will also have chance of coming back again.
Once the customer base is segmented, marketing team can use this list to do effective marketing
which leads to higher conversion rate.
So, in case of the RFM model the important variable are pre-defined in the model . The recency
is considered as the most important variable followed by higher frequency and monetary value.
In other words according to RFM model player who have recently played the game have higher
probability of returning again. After recency, frequency is second important variable, so player
who have higher frequency of betting/playing are expected to engage more.
Comparing the RFM mode with the results from the decision tree the frequency of bet comes out
to be the second most important variable which is similar to the RFM model. As shown in Node
4 with frequency higher than 3694 the churn decreases. Similarly average loss comes out to be
third important variable as average loss is the third classifier variable. However average stake is
the most important variable according to decision tree which is not a recency variable.
1.5 Conclusion and Recommendation
The main aim of this research was to help the case company to retain its online players and
suggest the strategies to improve the player’s engagement. For that the decision tree was
constructed, using the C&R tree technique. The decision tree model was used to predict the
churn rate. First the training data was used to decide the rules and the identified rules were then
applied to the test data which predict the churn among the players. Results from the decision tree
shows that the percentage of churn and non churn for the original data set was almost equal.
However filtering the data using the independent variables shows the subset of data where the
churn rate is very high. In this case the average stake comes out to be the most important
variable, followed by frequency bet and the average loss. Comparing to the results from the RFM
model the frequency and monetary value comes out to be second and third most important
variable, however recency was not the most important variable.
On the basis of the results it is recommended that the case company should focus on improving
the frequency bet. This is because the churner rate comes down to 34 % if the frequency bet is
more than 3694. To increase frequency bet case company can offer discount if the more bets are
being placed. Also the profiles of the players have been predicted who are most likely to churn
so based on those profile case company can plan accordingly for marketing and advertising
strategies.
⊘ This is a preview!⊘
Do you want full access?
Subscribe today to unlock all pages.
Trusted by 1+ million students worldwide
References
Armstrong, J. S. (2012). Illusions in regression analysis. International Journal of Forecasting, 6,
689–694.
Correa, A., González, A., Nieto, C., & Amezquita, D. (2012). Constructing a Credit Risk
Scorecard using Predictive Clusters. SAS Global Forum.
Coussement, K., & De Bock, K. (2013). No Title. Customer Churn Prediction in the Online
Gambling Industry: The Beneficial Effect of Ensemble Learning., 66, 1629–1636.
Delfabbro, P., King, D. L., & Griffiths, M. (2012). Behavioural profiling of problem gamblers:a
summary and review. International Gambling Studies, 3, 349–366.
El-Nasr, M., Drachen, A., & Canossa, A. (2013). Game Analytics: Maximizing the Value of
Player Data. Berlin: Springer.
Linof, G. S., & Berry, M. A. (2011). Data Mining Techniques: For Marketing, Sales, and
Customer Relationship Management. New Jearsy: Wiley Publishing, Inc.
Mahlmann, T., Drachen, A., Canossa, A., & Yannakakis, G. (2010). Predicting player behavior
in tomb 149 raider: Underworld. Computational Intelligence and Games (CIG), 178–185.
McCarty, J. A., & Hastak, M. (2007). . Segmentation approaches in data-mining: A comparison
of RFM, CHAID, and logistic regression. Journal of Business Research, 60(6), 656–662.
Runge, J., Gao, P., Garcin, F., & Faltings, B. (2014). Churn prediction for high-value players in
casual social games. IEEE, 1–8.
Xie, H., Devlin, S., & Kudenko, D. (2016). Predicting Disengagement in Free-To-Play Games
with Highly Biased Data. In AIIDE Workshop AAAI Technical Report W. California:
Association for the Advancement of Artificial Intelligence.
1 out of 10
Related Documents


Your All-in-One AI-Powered Toolkit for Academic Success.
+13062052269
info@desklib.com
Available 24*7 on WhatsApp / Email
![[object Object]](/_next/static/media/star-bottom.7253800d.svg)
Unlock your academic potential
Copyright © 2020–2026 A2Z Services. All Rights Reserved. Developed and managed by ZUCOL.