Marketing Report: Varsity T-Shirt Business, Demand & Profit
VerifiedAdded on 2022/08/13
|11
|1480
|21
Report
AI Summary
This report presents a comprehensive marketing analysis for a varsity t-shirt business, targeting students involved in sports. It begins with a market assessment, design considerations, and the development of a marketing plan. Cost estimations, including unit and fixed costs, are provided, alongside a pooling plan to gather customer feedback. The report then delves into the target market pool, detailing the polling process and demand calculations. Subsequently, it constructs demand, revenue, and profit functions based on the collected data and cost structures. Finally, the report employs optimization techniques to determine the price point that maximizes both revenue and profit, offering recommendations for the business's pricing strategy and sensitivity analysis related to fixed costs. The report concludes with a bibliography of relevant sources.

Running head: MARKETING
Marketing
Name of the Student:
Name of the University:
Author’s Note:
Marketing
Name of the Student:
Name of the University:
Author’s Note:
Paraphrase This Document
Need a fresh take? Get an instant paraphrase of this document with our AI Paraphraser
1MARKETING
Table of Contents
Part A: Design, Marketing and Cost Estimates...............................................................................2
A1: Target Market.......................................................................................................................2
A2: Design the Shirt....................................................................................................................2
A3: Marketing Plan......................................................................................................................3
A4: Reachable Target Market......................................................................................................3
A5: Unit Cost...............................................................................................................................3
A6: Fixed Costs...........................................................................................................................3
A7: Pooling Plan..........................................................................................................................4
Part B: Target Market Pool..............................................................................................................4
Part C: The Demand, Revenue and Profit Function........................................................................6
Part D: Optimization........................................................................................................................7
Bibliography:.................................................................................................................................10
2MARKETING
Part A: Design, Marketing and Cost Estimates
A1: Target Market
The target market selected for the selling of the T-Shirt is the students who play varsity
sports. In modern universities and colleges, sports have become an integrated part of the courses.
Therefore, targeting the students for selling the product could be a good strategy for the startup.
It can be estimated that on an average there will be demand for 1,000 numbers of T-Shirts in a
year.
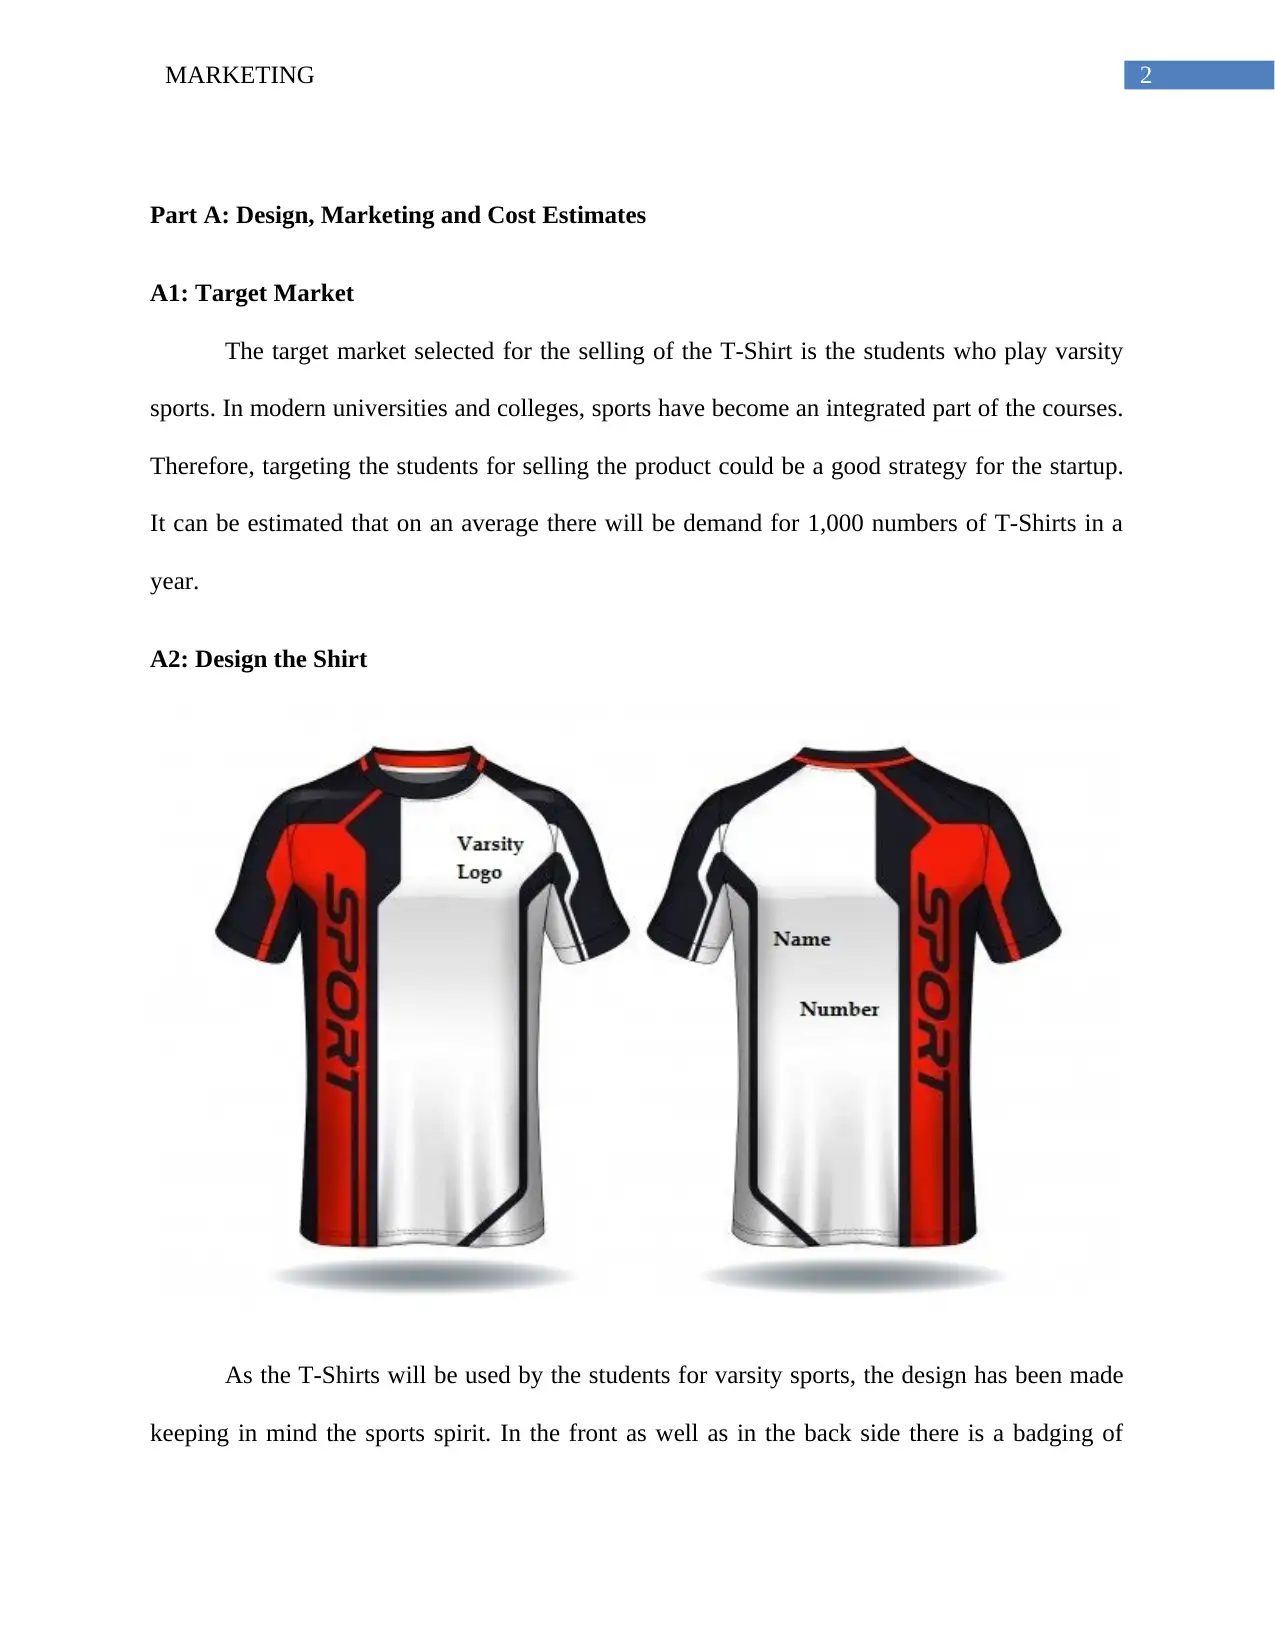
A2: Design the Shirt
As the T-Shirts will be used by the students for varsity sports, the design has been made
keeping in mind the sports spirit. In the front as well as in the back side there is a badging of
Part A: Design, Marketing and Cost Estimates
A1: Target Market
The target market selected for the selling of the T-Shirt is the students who play varsity
sports. In modern universities and colleges, sports have become an integrated part of the courses.
Therefore, targeting the students for selling the product could be a good strategy for the startup.
It can be estimated that on an average there will be demand for 1,000 numbers of T-Shirts in a
year.
A2: Design the Shirt
As the T-Shirts will be used by the students for varsity sports, the design has been made
keeping in mind the sports spirit. In the front as well as in the back side there is a badging of
⊘ This is a preview!⊘
Do you want full access?
Subscribe today to unlock all pages.
Trusted by 1+ million students worldwide
3MARKETING
sports. In the chest the logo for the individual varsity or college can be printed and in the back
side the name of the player and number can be printed.
A3: Marketing Plan
The target market for the T-Shirt is the varsity students who will play varsity sports.
Hence, the key of the marketing plan would be to promotional activities and advertisements in
the varsities and colleges. It can be more effective to directly contact with the varsities and
supply them the T-Shirts as and when they require. As the target market is the varsity students
who play varsity sports, it would be better to go for the advertisements through posters. As the
modern business is more of e-tail than retail, it can also be suggested to sell their products online
through online advertisements in the social media platforms.
A4: Reachable Target Market
If the advertisements promotional activities are carried out through the posters in each of
the varsities and in online and social media platform, then almost 80% of the target market could
be reached. Hence, the reachable target customers would be 80% of the target market or 800 T-
Shirts.
A5: Unit Cost
The reachable target market is 800 units. Hence, as per the pricing chart, the order size
would be half of the target market or 400 units. Therefore, the base cost for the T-Shirt is €5.25
and for printing patter of logo in the front as well as for printing name and number in the back
additional €0.40 will be paid. Therefore, the total cost for a T-Shirt would be €5.65.
Paraphrase This Document
Need a fresh take? Get an instant paraphrase of this document with our AI Paraphraser
4MARKETING
A6: Fixed Costs
It has been estimated that for the selling and administration expenses there would be an
annual fixed costs of €200. The fixed costs mainly comprises of the selling and promotional
costs as well as administration and management costs.
A7: Pooling Plan
As the target market is the varsity students who play varsity sports, the polling plan for
the proposed startup is to sell the T-Shirts in Thursday and Friday in different universities and
colleges with demo of the T-Shirts and allowing them for a trial of the T-Shirts. After the trial,
feedbacks will be taken from the students about the design of the T-Shirt, it comfort level and it’s
pricing. Suggestions will be taken from them to make necessary changes and improvement in the
product.
Part B: Target Market Pool
As per the polling plan made earlier, the poll has been completed to know the how the
target customers feel about the product and how much they are willing to pay for the product.
The polling was completed with no price hint, only it was asked to make their own price quote
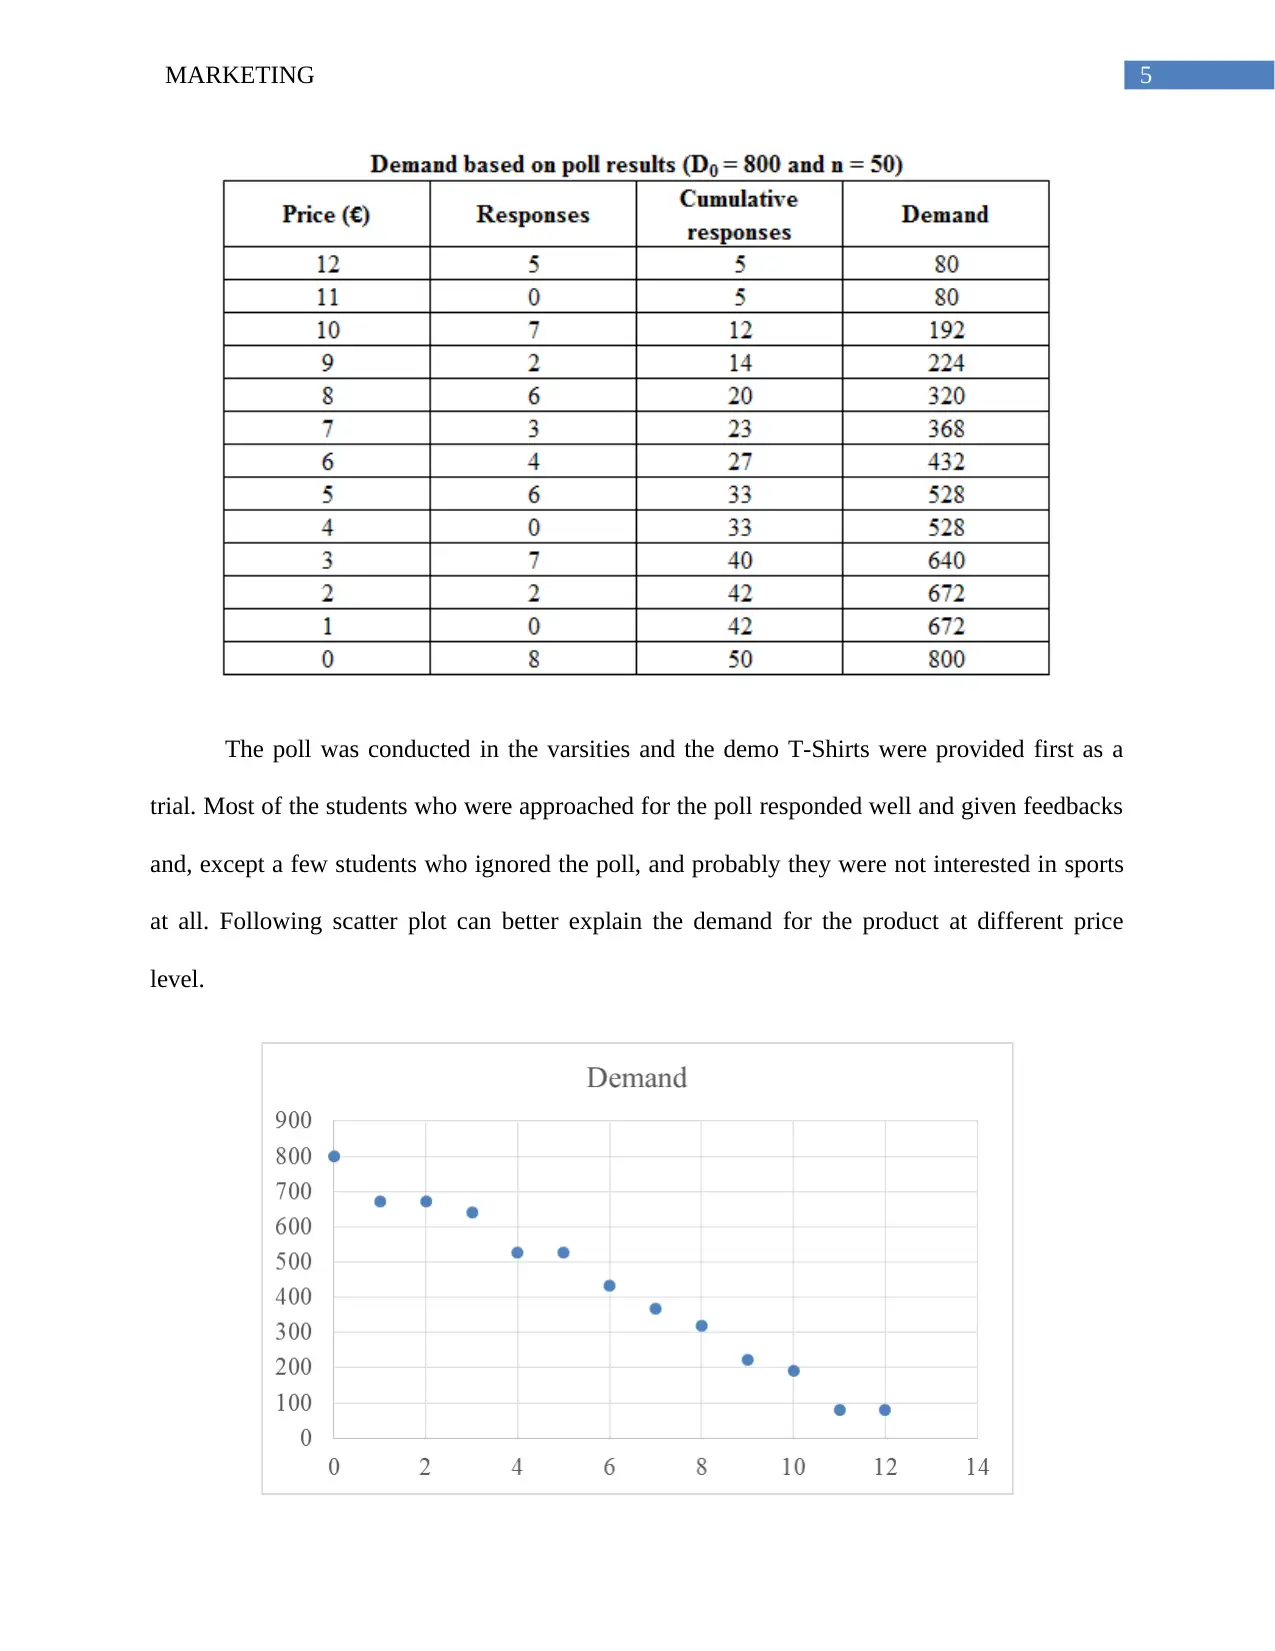
for the T-Shirt. Following. The target market is of 800 units and the sample size in the polling
was 50, and the scale factor used for the calculation of demand is 16. To find demand for each of
the price quote, the cumulative responses have been multiplied by 16. Following table shows the
responses and the expected demand for the T-Shirt.
A6: Fixed Costs
It has been estimated that for the selling and administration expenses there would be an
annual fixed costs of €200. The fixed costs mainly comprises of the selling and promotional
costs as well as administration and management costs.
A7: Pooling Plan
As the target market is the varsity students who play varsity sports, the polling plan for
the proposed startup is to sell the T-Shirts in Thursday and Friday in different universities and
colleges with demo of the T-Shirts and allowing them for a trial of the T-Shirts. After the trial,
feedbacks will be taken from the students about the design of the T-Shirt, it comfort level and it’s
pricing. Suggestions will be taken from them to make necessary changes and improvement in the
product.
Part B: Target Market Pool
As per the polling plan made earlier, the poll has been completed to know the how the
target customers feel about the product and how much they are willing to pay for the product.
The polling was completed with no price hint, only it was asked to make their own price quote
for the T-Shirt. Following. The target market is of 800 units and the sample size in the polling
was 50, and the scale factor used for the calculation of demand is 16. To find demand for each of
the price quote, the cumulative responses have been multiplied by 16. Following table shows the
responses and the expected demand for the T-Shirt.
5MARKETING
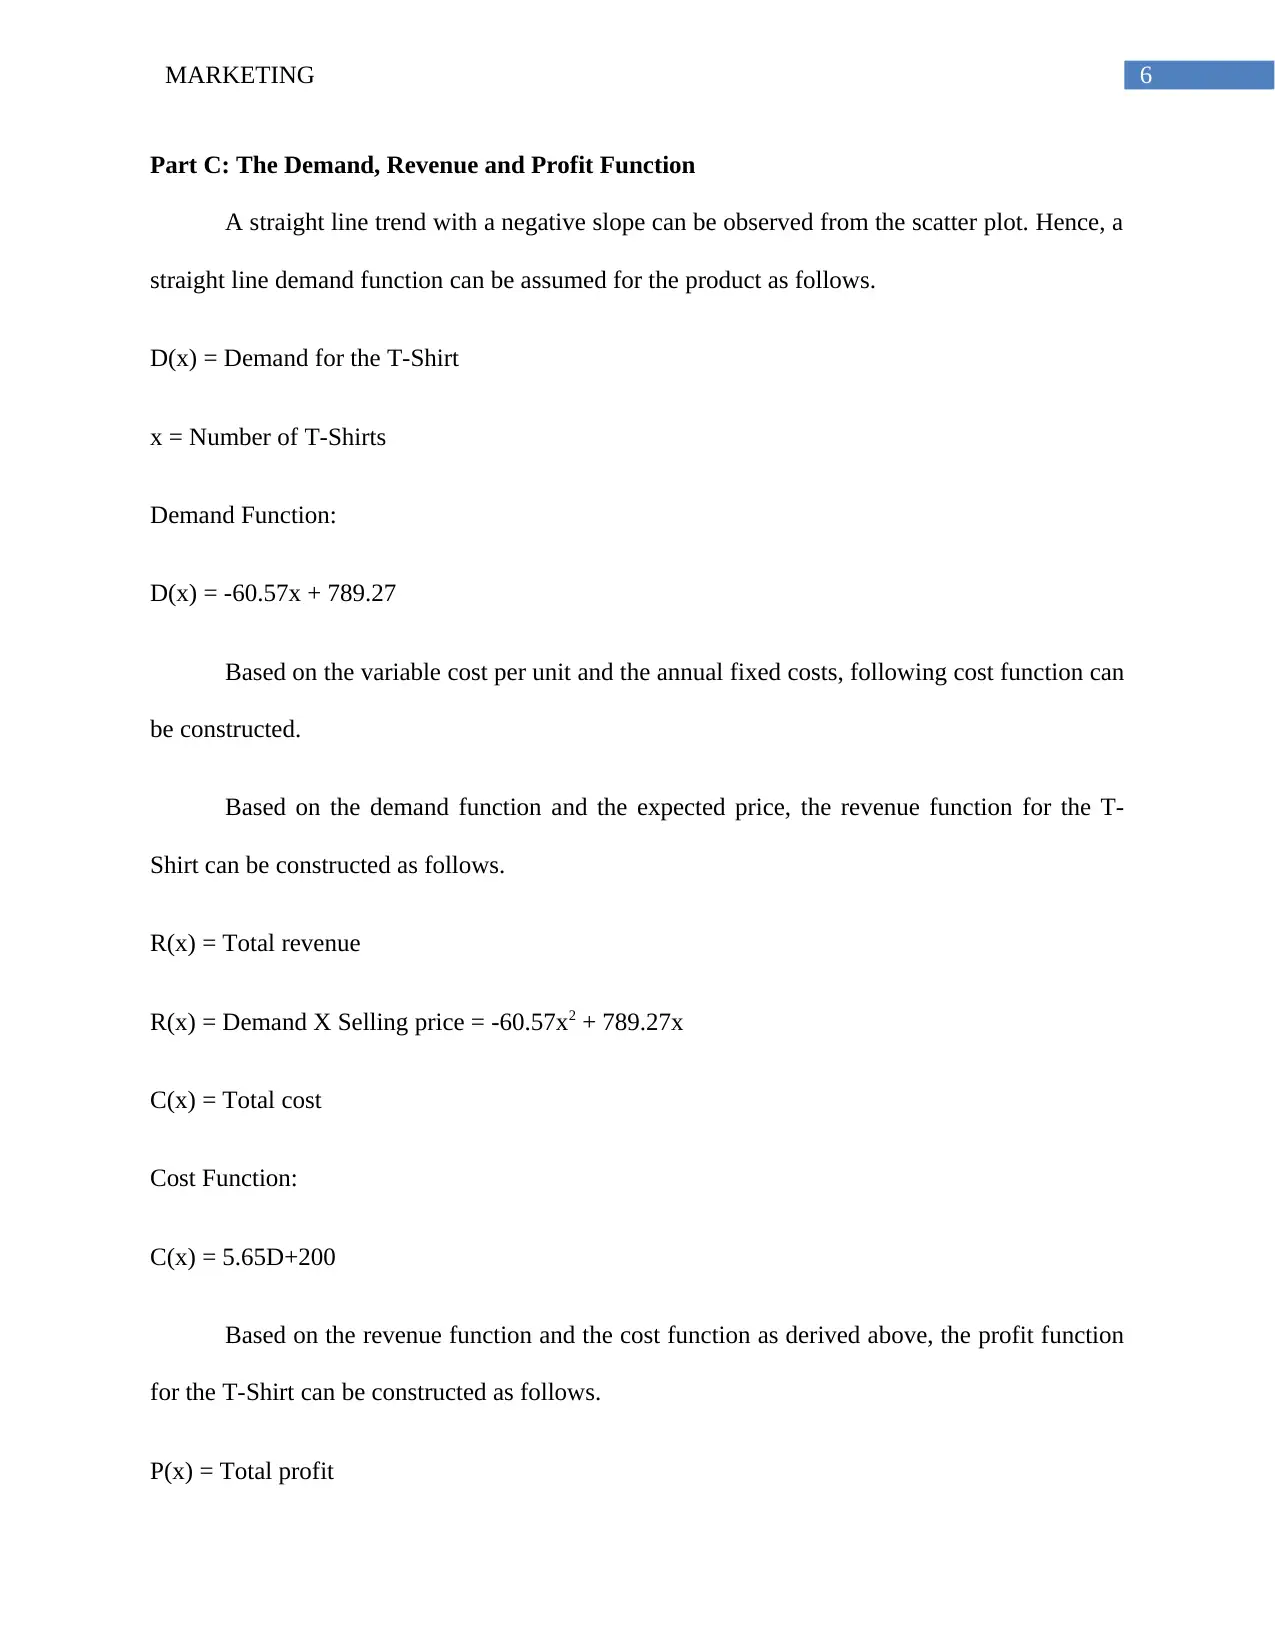
The poll was conducted in the varsities and the demo T-Shirts were provided first as a
trial. Most of the students who were approached for the poll responded well and given feedbacks
and, except a few students who ignored the poll, and probably they were not interested in sports
at all. Following scatter plot can better explain the demand for the product at different price
level.
⊘ This is a preview!⊘
Do you want full access?
Subscribe today to unlock all pages.
Trusted by 1+ million students worldwide
6MARKETING
Part C: The Demand, Revenue and Profit Function
A straight line trend with a negative slope can be observed from the scatter plot. Hence, a
straight line demand function can be assumed for the product as follows.
D(x) = Demand for the T-Shirt
x = Number of T-Shirts
Demand Function:
D(x) = -60.57x + 789.27
Based on the variable cost per unit and the annual fixed costs, following cost function can
be constructed.
Based on the demand function and the expected price, the revenue function for the T-
Shirt can be constructed as follows.
R(x) = Total revenue
R(x) = Demand X Selling price = -60.57x2 + 789.27x
C(x) = Total cost
Cost Function:
C(x) = 5.65D+200
Based on the revenue function and the cost function as derived above, the profit function
for the T-Shirt can be constructed as follows.
P(x) = Total profit
Paraphrase This Document
Need a fresh take? Get an instant paraphrase of this document with our AI Paraphraser
7MARKETING
Profit Function:
P(x) = R(x) – C(x)
P(x) -60.57x2 + 789.27x - 5.65x-200
P(x) = -60.57x2+783.62x-200
Part D: Optimization
Revenue function:
R(x) = -60.57x2 + 789.27x
Differentiating both sides with respect to x, we get,
d
dx ( R )=−121.14 x+789.27
At the maximum revenue the first order derivative become zero. Hence, setting the first
order derivative as zero, we get the price that maximizes the revenue.
−121.14 x +789.27=0
x= 789.27
121.14 =6.52
Therefore, revenue maximizing demand
D ( x )=−60.57 ×6.52+789. 27=−394.92+789.27=394.35
Profit function:
P(x) = -60.57x2+783.62x-200
8MARKETING
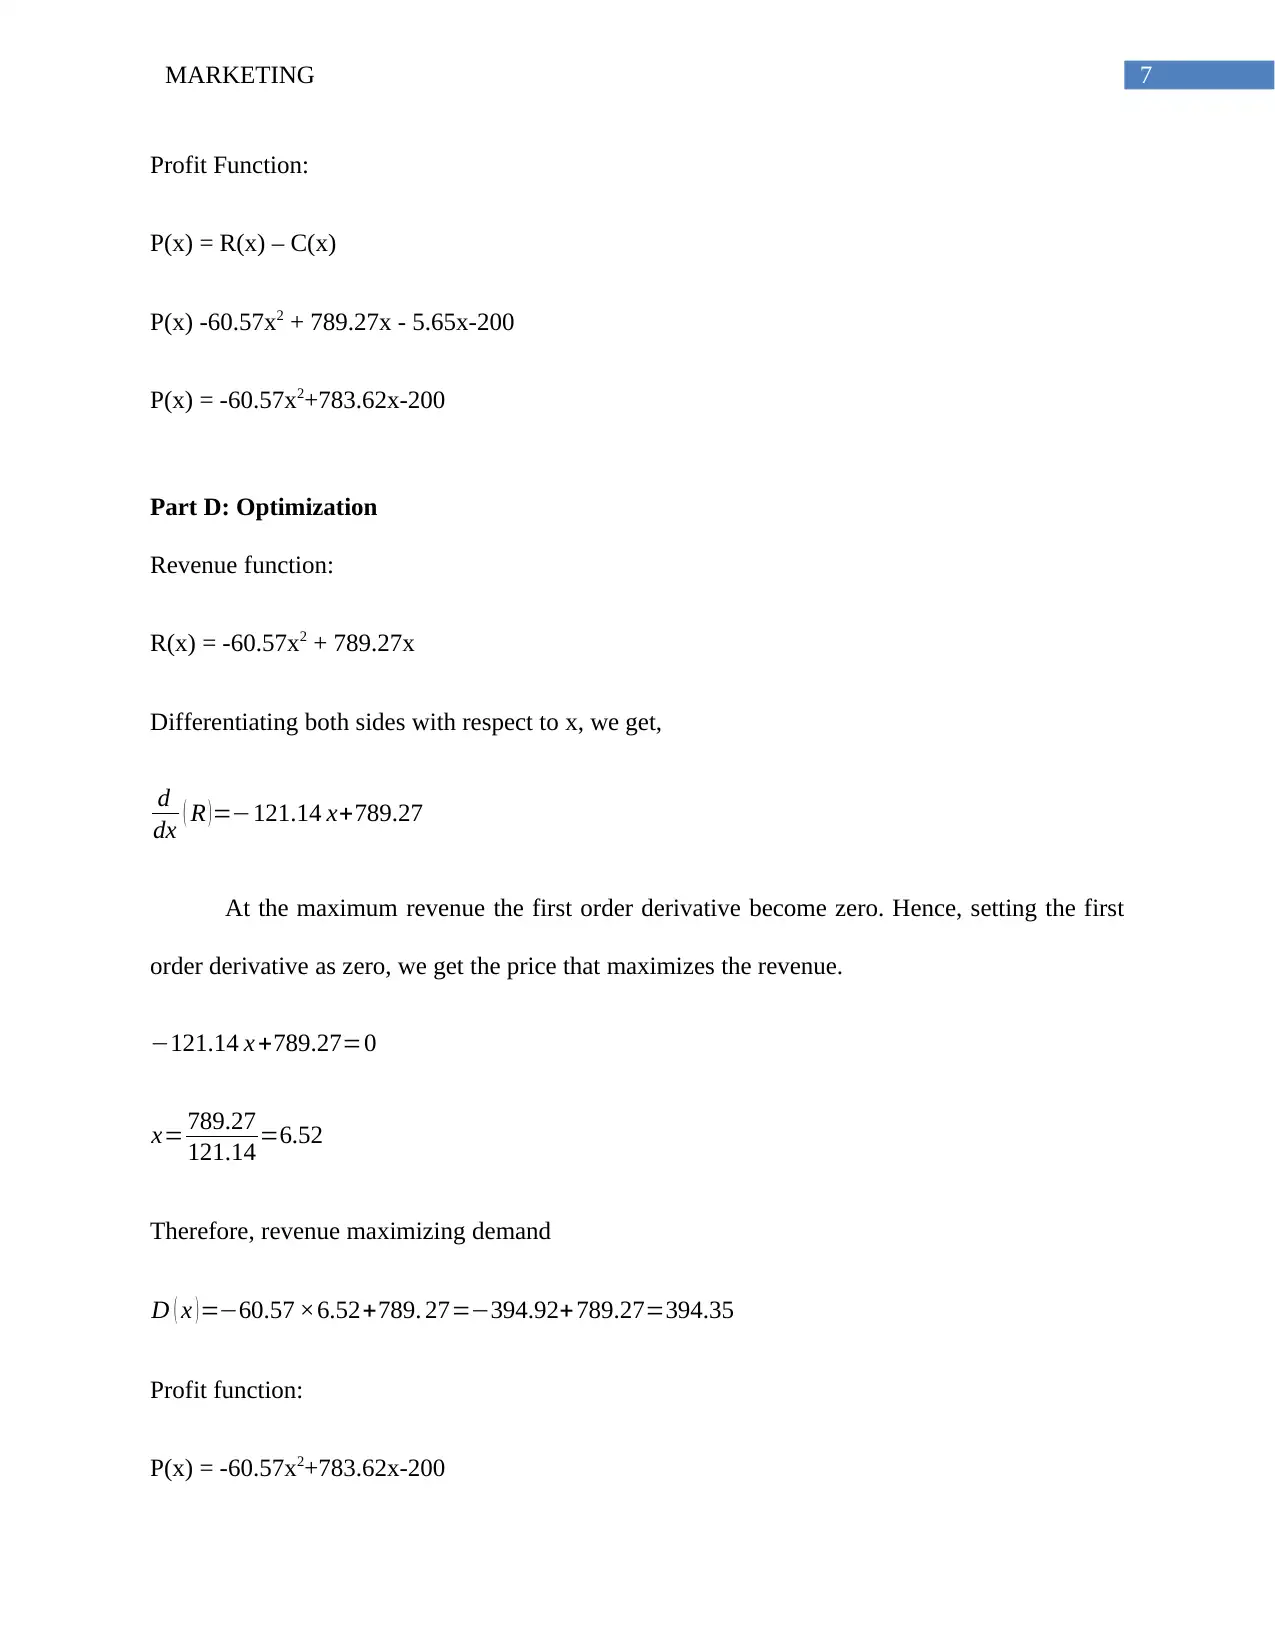
Differentiating both sides with respect to x, we get,
d
dx ( P ) =−121.14 x +783.62
At the maximum profit, the first order derivative would be zero. Hence, setting zero to the first
order derivative of the profit function, we can get the price at which the profit is maximum.
−121.14 x +783.62=0
x= 783.62
121.14 =6.47
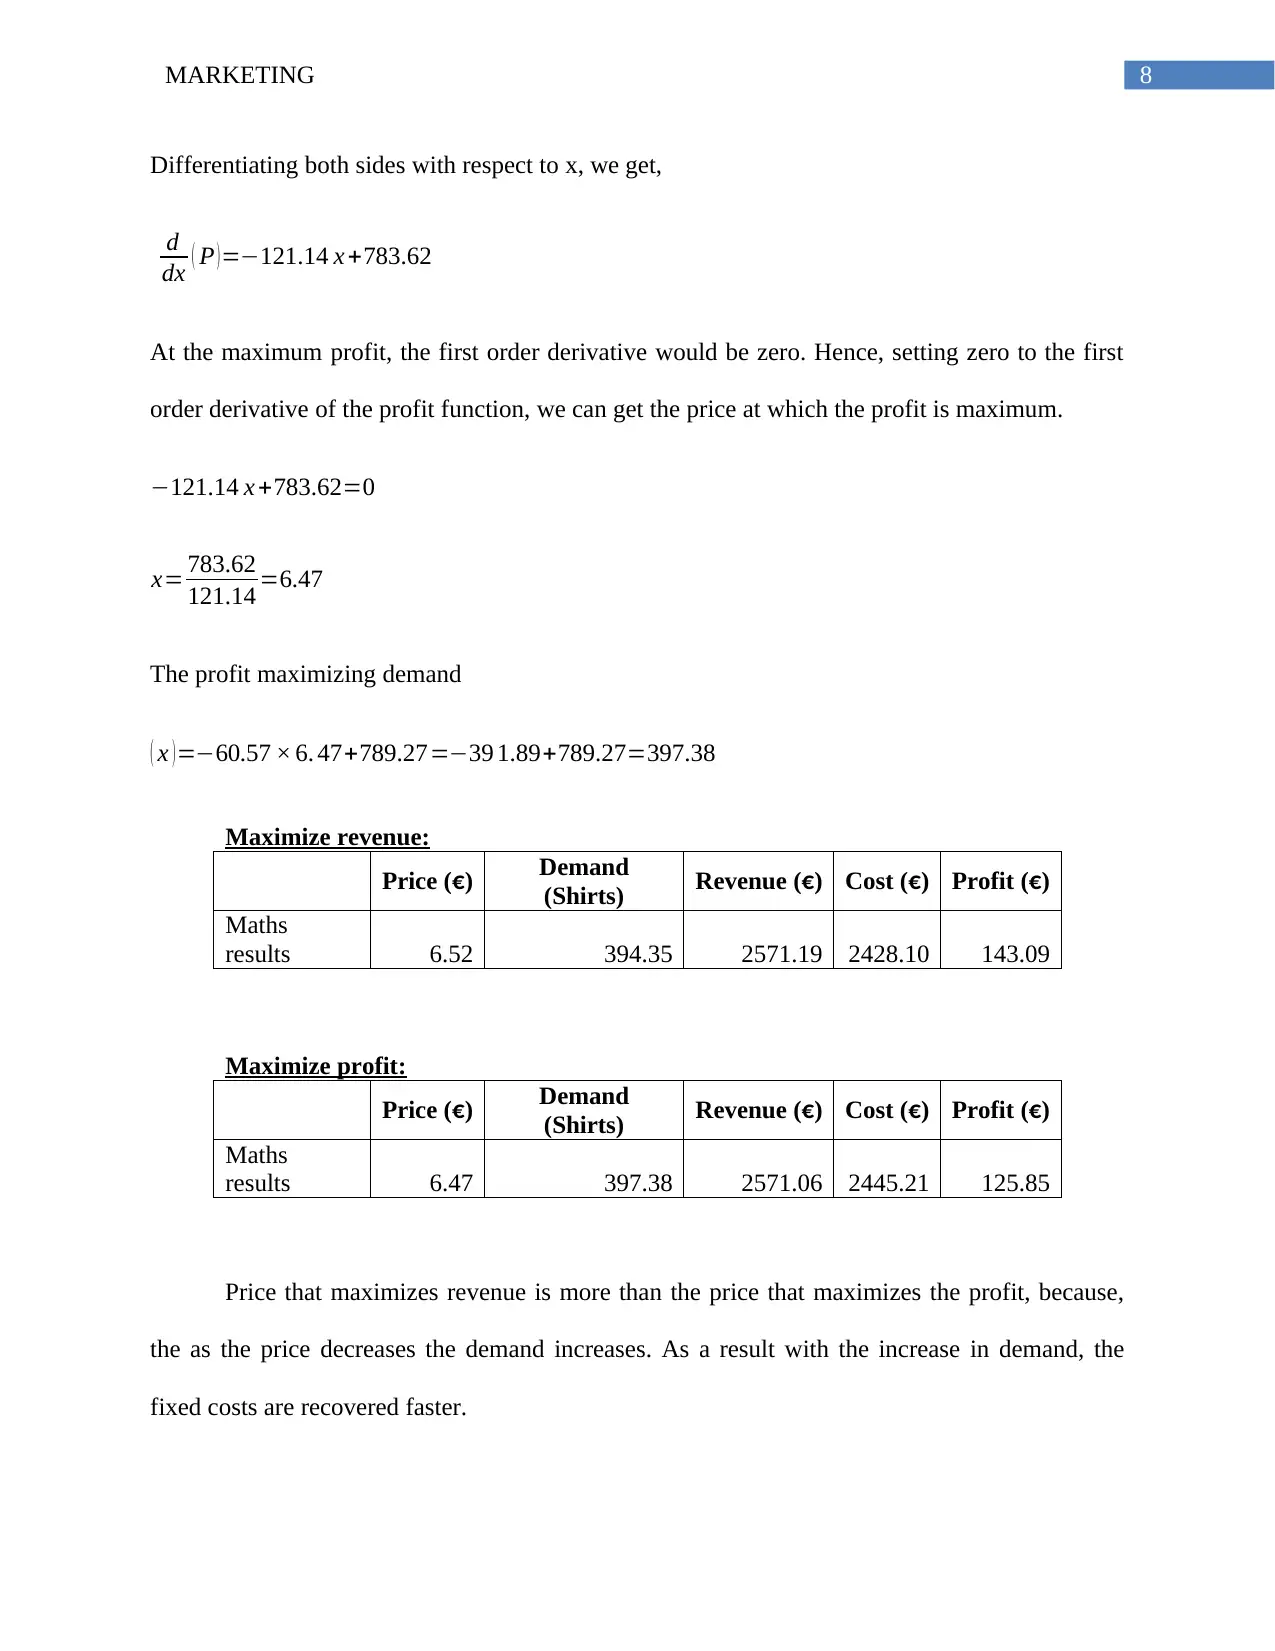
The profit maximizing demand
( x ) =−60.57 × 6. 47+789.27=−39 1.89+789.27=397.38
Maximize revenue:
Price (€) Demand
(Shirts) Revenue (€) Cost (€) Profit (€)
Maths
results 6.52 394.35 2571.19 2428.10 143.09
Maximize profit:
Price (€) Demand
(Shirts) Revenue (€) Cost (€) Profit (€)
Maths
results 6.47 397.38 2571.06 2445.21 125.85
Price that maximizes revenue is more than the price that maximizes the profit, because,
the as the price decreases the demand increases. As a result with the increase in demand, the
fixed costs are recovered faster.
Differentiating both sides with respect to x, we get,
d
dx ( P ) =−121.14 x +783.62
At the maximum profit, the first order derivative would be zero. Hence, setting zero to the first
order derivative of the profit function, we can get the price at which the profit is maximum.
−121.14 x +783.62=0
x= 783.62
121.14 =6.47
The profit maximizing demand
( x ) =−60.57 × 6. 47+789.27=−39 1.89+789.27=397.38
Maximize revenue:
Price (€) Demand
(Shirts) Revenue (€) Cost (€) Profit (€)
Maths
results 6.52 394.35 2571.19 2428.10 143.09
Maximize profit:
Price (€) Demand
(Shirts) Revenue (€) Cost (€) Profit (€)
Maths
results 6.47 397.38 2571.06 2445.21 125.85
Price that maximizes revenue is more than the price that maximizes the profit, because,
the as the price decreases the demand increases. As a result with the increase in demand, the
fixed costs are recovered faster.
⊘ This is a preview!⊘
Do you want full access?
Subscribe today to unlock all pages.
Trusted by 1+ million students worldwide
9MARKETING
Increase in price by €1, results in decrease in profit by €281.09. Hence, the profit changes
by a rate of 12.81.
From the above analysis and observation, it can be suggested to sell the T-Shirt at a price
of €6.47 as it maximizes the profit.
If additional €150 added to the total fixed costs, then also the price that maximizes profit
remains the same, as it becomes zero in the first order derivative and there will be a maximum
loss of €24.50.
Paraphrase This Document
Need a fresh take? Get an instant paraphrase of this document with our AI Paraphraser
10MARKETING
Bibliography:
Bullock, E.C., 2015. Risky research business: Mathematics education research on the
margins. The Mathematics Enthusiast, 12(1), pp.95-102.
Burns, P. and Dewhurst, J. eds., 2016. Small business and entrepreneurship. Macmillan
International Higher Education.
Prakash, A.J. and Ghosh, D.K., 2014. Financial, commercial, and mortgage mathematics and
their applications. ABC-CLIO.
van Elst, H., 2015. An introduction to business mathematics. arXiv preprint arXiv:1509.04333.
1 out of 11
Your All-in-One AI-Powered Toolkit for Academic Success.
+13062052269
info@desklib.com
Available 24*7 on WhatsApp / Email
![[object Object]](/_next/static/media/star-bottom.7253800d.svg)
Unlock your academic potential
Copyright © 2020–2026 A2Z Services. All Rights Reserved. Developed and managed by ZUCOL.