Deakin MIS784: Marketing Analytics Report on Promotion Strategies
VerifiedAdded on 2022/09/18
|10
|2024
|21
Report
AI Summary
This report analyzes the effectiveness of four price-based promotion strategies implemented by Carman's Kitchen, a cereal bar company in Australia. The analysis utilizes financial metrics such as baseline sales, promotion sales, incremental sales, post-promotion dip, and net effect of promotion to evaluate the success of each strategy. The report includes trend plots and a financial metrics summary table to compare the performance of each promotion. Strategy 4, which involved the highest promotional sales, incremental sales, incremental gain and percentage lift from promotion, is deemed the most successful strategy. Recommendations are provided for Carman's Kitchen to adopt either Strategy 4 or a mixed approach using Strategies 1 and 4 for future promotion drives. The report concludes that these strategies can help the company enhance its market share and achieve its growth objectives.
Marketing Analytics
Paraphrase This Document
Need a fresh take? Get an instant paraphrase of this document with our AI Paraphraser
Marketing Analytics
Contents
Introduction.................................................................................................................................................3
Methodology...............................................................................................................................................3
Analysis Results..........................................................................................................................................5
Conclusion...................................................................................................................................................8
Recommendations.......................................................................................................................................9
References.................................................................................................................................................10
2
Marketing Analytics
Introduction
Improving the position of a company in its market requires the application of growth strategies
that will enable it to increase its market share (Kiechel, 2010). However, the way in which many
markets are structured makes it difficult for companies to increase their market share and
improve their positions. This is especially true for already existing and more developed markets
where there exist some level of monopoly in terms of both the resource access and pricing. The
results of this monopoly is the continued dominance of the markets by market leaders. For
emerging markets, the case is different since there does not exist any restriction concerning
either resource access or pricing. This means that in emerging markets it is much easier to break
into the market as well as to improve a company’s position.
Although improving a company’s position is difficult in established markets, it is not impossible.
This depends greatly on the development and implementation of the growth strategies. Among
these growth strategies is promotion drives. Promotion drives are growth strategies that involve
the use of incentives to encourage customers to purchase a product (Farris & Neil, 2010).
Promotion drives are set to run over a pre-defined period before the resumption of normal sales
practices. The incentive may come in two forms: reduction in price per unit of product and
adding an extra product for the purchase of given line of product(s). The aim of the promotion
drives is to attract customers that would otherwise purchase alternative products (Laudon &
Guercio, 2014).
This report presents findings from the use of promotion drives by the Carman’s Kitchen
Company on a pilot bases. Carman’s Kitchen operates in the cereal bars producing industry in
Australia with a market share equivalent to 20%. The company is considering four different
price-based promotion strategies for its four product lines. The report contains analysis of the
effectiveness of the four pilot promotion strategies. Recommendations on which promotion
strategy has the best success rate will also be included.
Methodology
The analysis of the data on the four promotion strategies involve the computation of relevant
financial metrics. Financial metrics refers to aspects of financial data that provide valuable
information on the performance of the financial entity in question (Farris & Neil, 2010). This
analysis considers the following financial metrics in the assessment of the performance of the
four promotion strategies applied by Carman’s Kitchen on a pilot basis:
1. Baseline Brand Sales: Baseline sales refers to the amount of sales prior to the start of the
promotion period (O'Malley & Lichrou, 2016). In this case, the brand sales are
3
⊘ This is a preview!⊘
Do you want full access?
Subscribe today to unlock all pages.
Trusted by 1+ million students worldwide
Marketing Analytics
considered and the Baseline Brand Sales computed as the average value of the brand
sales from week 1 to week 10 (the period before the start of the pilot promotion drive).
2. Baseline Category Sales: In this case, the category sales are considered and the Baseline
Category Sales computed as the average value of the category sales from week 1 to week
10 (the period before the start of the pilot promotion drive).
3. Promotion Sales: Promotion Sales refer to the amount of sales made by a company during
the period they are running a promotion (O'Malley & Lichrou, 2016). In this case, the
Promotion Sales is the average value for the sales from week 11 to week 14 (the period
during which the promotion run). The higher the promotional sales the more successful
the promotion strategy.
4. Post Promotion Sales: Post Promotion Sales refer to the amount of sales made by a
company after they run a promotion (O'Malley & Lichrou, 2016). In this case, the
Promotion Sales is the average value for the sales from week 11 to week 14 (the period
during which the promotion run). The higher the post promotional sales the more
successful the promotion strategy.
5. Incremental Sales: Incremental Sales refer to the increase in sales in the promotion period
as compared to before the promotion period (O'Malley & Lichrou, 2016). In this case.
The Incremental Sales is equal to the difference between the Promotion Sales and the
Baseline Brand Sales. The higher the incremental sales the more successful the
promotion strategy.
6. Post-Promotion Dip: A dip refers to the decrease in the sales or profits of a company in a
given period (Albright & Winston, 2014). The Post Promotion Dip, in this case, refers to
the decrease in sales after the promotion period. The value of the Post Promotion Period
is equal to the difference between the Baseline Brand Sales and the Post Promotion Sales.
The lower the post promotion dip the more successful the promotion strategy.
7. Promotion Margin: Promotion Margin refers to the amount of profit per unit made during
the promotion period (Sheth, 2017).
8. Regular Margin: Regular Margin refers to the amount of profit per unit normally made by
a company (Sheth, 2017).
9. Incremental Gain: Incremental Gain refers to the amount of total profit made during the
promotion period (Farris & Neil, 2010). The value of Incremental Gain is equal to the
multiplication of the Incremental Gain, number of weeks of promotion and the Promotion
Margin. The higher the incremental gain the more successful the promotion strategy.
4
Paraphrase This Document
Need a fresh take? Get an instant paraphrase of this document with our AI Paraphraser
Marketing Analytics
10. Post Promotion Loss: Post Promotion Loss refers to the amount of loss made by a
company after the promotion period (Albright & Winston, 2014). The value of the Post
Promotion Loss is equal to the multiplication of the Post Promotion Dip, Regular margin
and the number of weeks after the promotion period considered. The lower the post
promotion loss the more successful the promotion strategy.
11. Foregone Contribution: Foregone Contribution refers to the extra amount of profit that a
company would earn assuming the company maintains normal operations (Sheth, 2017).
In this context for Carman’s Kitchen, the Foregone Contribution represents the extra
amount of profit that Carman’s Kitchen would earn if it does not run a promotion. The
value of the foregone contribution is equal to the multiplication of the Baseline Brand
Sales, the difference between the Regular Margin and the Promotion Margin, and the
number of weeks of promotion. The lower the forgone contribution the more preferable
the promotion strategy.
12. Net Effect of Promotion: Net Effect of Promotion refers to the numerical value for the
impact of the promotion on the profits of a company (Albright & Winston, 2014). The
value of the Net Effect of Promotion is equal to the subtraction of the Foregone
Contribution and the Post Promotion Loss from the Incremental Gain. The higher the net
effect of promotion the more successful the promotion strategy.
13. Percentage lift from promotion: Percentage lift from promotion refers to the percentage
value of the rise in the sales resulting from a promotion drive (Sheth, 2017). The higher
the percentage lift from promotion the more successful the promotion strategy.
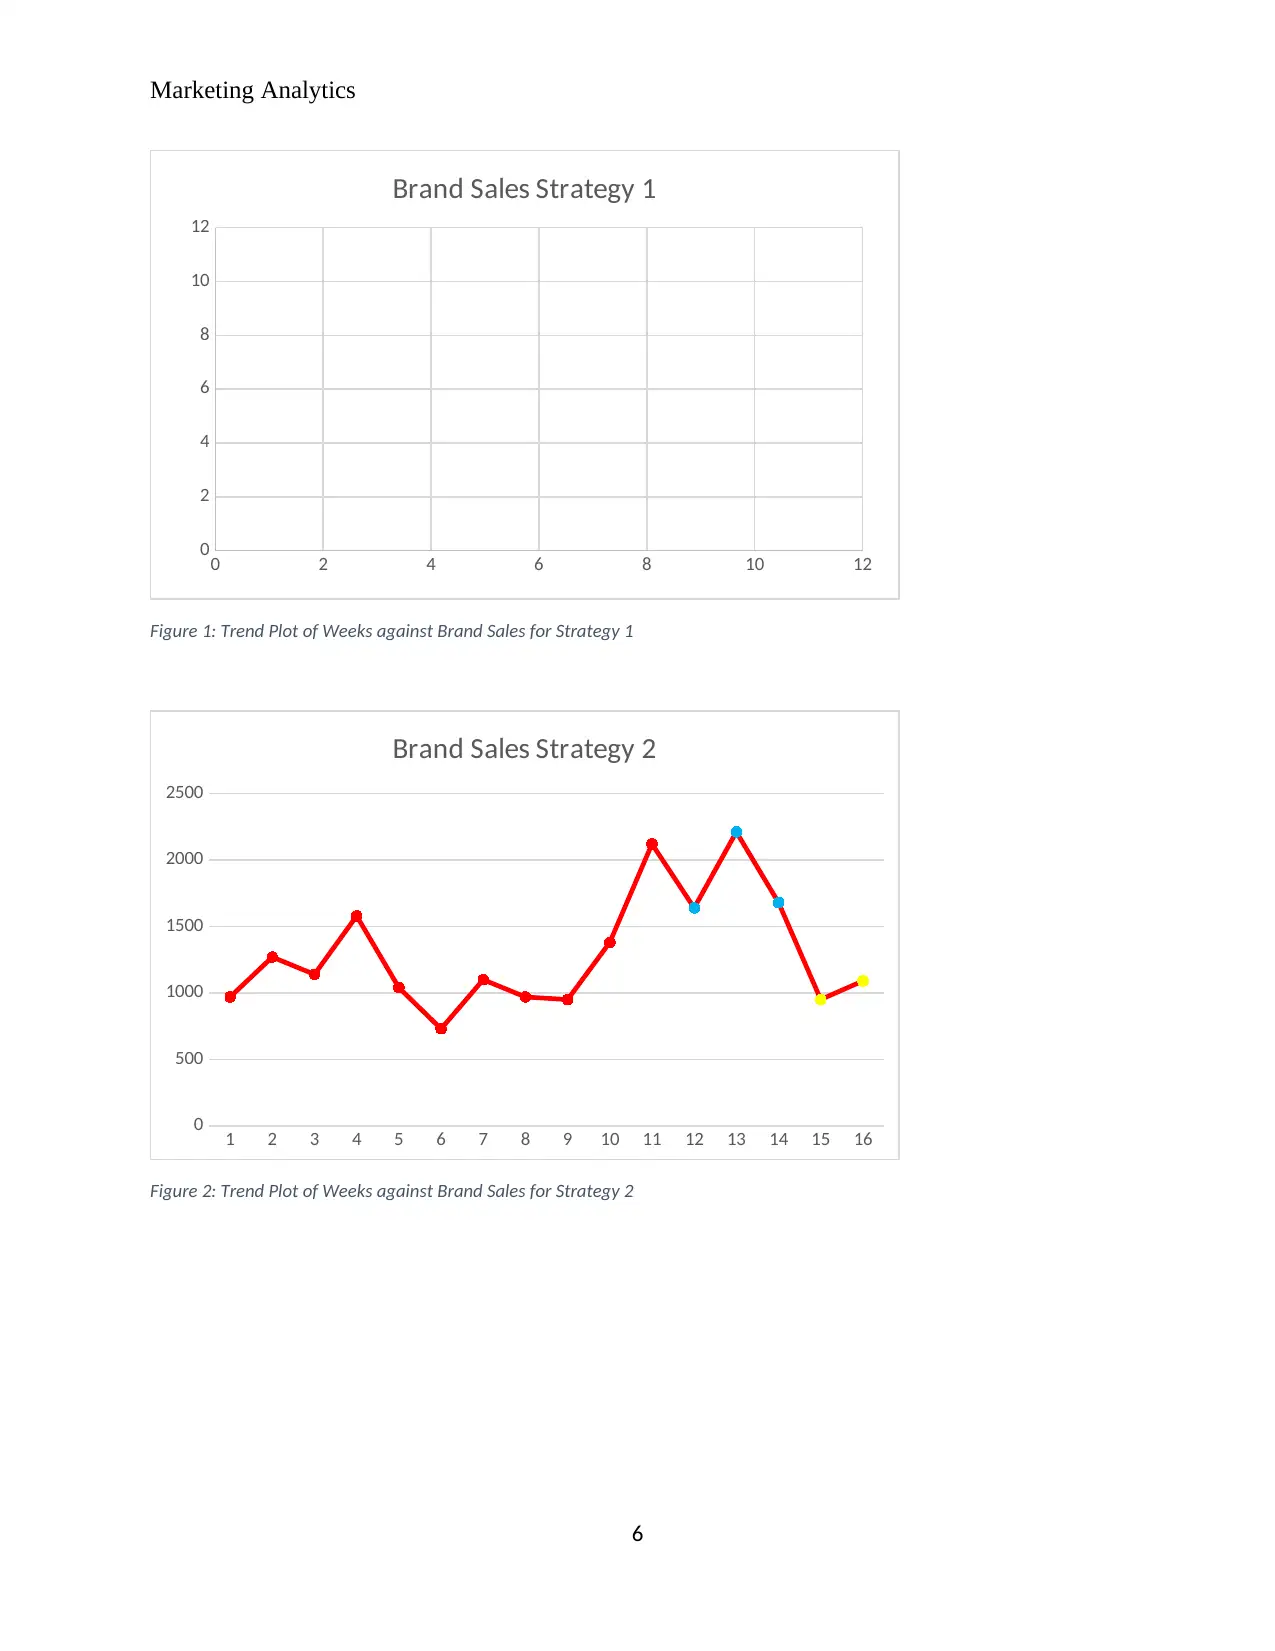
Analysis Results
The plots in Figure 1: Trend Plot of Weeks against Brand Sales for Strategy 1 through to Figure
4: Trend Plot of Weeks against Brand Sales for Strategy 4 below show results of the analysis of
the trend in the brand sales across the four strategies. From the plots, we observe that in all the
strategies at least one week during the promotion period had the highest brand sales in the 16-
week period. We also observe that it is only in Strategy 1 that the post-promotion brand sales
exceeded the sales of at least one of the weeks in the promotion period.
5
10. Post Promotion Loss: Post Promotion Loss refers to the amount of loss made by a
company after the promotion period (Albright & Winston, 2014). The value of the Post
Promotion Loss is equal to the multiplication of the Post Promotion Dip, Regular margin
and the number of weeks after the promotion period considered. The lower the post
promotion loss the more successful the promotion strategy.
11. Foregone Contribution: Foregone Contribution refers to the extra amount of profit that a
company would earn assuming the company maintains normal operations (Sheth, 2017).
In this context for Carman’s Kitchen, the Foregone Contribution represents the extra
amount of profit that Carman’s Kitchen would earn if it does not run a promotion. The
value of the foregone contribution is equal to the multiplication of the Baseline Brand
Sales, the difference between the Regular Margin and the Promotion Margin, and the
number of weeks of promotion. The lower the forgone contribution the more preferable
the promotion strategy.
12. Net Effect of Promotion: Net Effect of Promotion refers to the numerical value for the
impact of the promotion on the profits of a company (Albright & Winston, 2014). The
value of the Net Effect of Promotion is equal to the subtraction of the Foregone
Contribution and the Post Promotion Loss from the Incremental Gain. The higher the net
effect of promotion the more successful the promotion strategy.
13. Percentage lift from promotion: Percentage lift from promotion refers to the percentage
value of the rise in the sales resulting from a promotion drive (Sheth, 2017). The higher
the percentage lift from promotion the more successful the promotion strategy.
Analysis Results
The plots in Figure 1: Trend Plot of Weeks against Brand Sales for Strategy 1 through to Figure
4: Trend Plot of Weeks against Brand Sales for Strategy 4 below show results of the analysis of
the trend in the brand sales across the four strategies. From the plots, we observe that in all the
strategies at least one week during the promotion period had the highest brand sales in the 16-
week period. We also observe that it is only in Strategy 1 that the post-promotion brand sales
exceeded the sales of at least one of the weeks in the promotion period.
5
Marketing Analytics
0 2 4 6 8 10 12
0
2
4
6
8
10
12
Brand Sales Strategy 1
Figure 1: Trend Plot of Weeks against Brand Sales for Strategy 1
1 2 3 4 5 6 7 8 9 10 11 12 13 14 15 16
0
500
1000
1500
2000
2500
Brand Sales Strategy 2
Figure 2: Trend Plot of Weeks against Brand Sales for Strategy 2
6
0 2 4 6 8 10 12
0
2
4
6
8
10
12
Brand Sales Strategy 1
Figure 1: Trend Plot of Weeks against Brand Sales for Strategy 1
1 2 3 4 5 6 7 8 9 10 11 12 13 14 15 16
0
500
1000
1500
2000
2500
Brand Sales Strategy 2
Figure 2: Trend Plot of Weeks against Brand Sales for Strategy 2
6
⊘ This is a preview!⊘
Do you want full access?
Subscribe today to unlock all pages.
Trusted by 1+ million students worldwide
Marketing Analytics
0 2 4 6 8 10 12
0
2
4
6
8
10
12
Brand Sales Strategy 3
Figure 3: Trend Plot of Weeks against Brand Sales for Strategy 3
0 2 4 6 8 10 12
0
2
4
6
8
10
12
Brand Sales Strategy 4
Figure 4: Trend Plot of Weeks against Brand Sales for Strategy 4
Table 1: Financial Metrics Summary Output below represents the financial metrics for the four
promotion strategies. From the table, we observe that:
1. Strategy 4 had the highest promotional sales at 2379.
2. Strategy 3 had the highest post promotional sales at 1144.
3. Strategy 4 had the highest incremental sales at 1184.
4. Strategy 1 had the lowest post promotion dip at 71.
7
0 2 4 6 8 10 12
0
2
4
6
8
10
12
Brand Sales Strategy 3
Figure 3: Trend Plot of Weeks against Brand Sales for Strategy 3
0 2 4 6 8 10 12
0
2
4
6
8
10
12
Brand Sales Strategy 4
Figure 4: Trend Plot of Weeks against Brand Sales for Strategy 4
Table 1: Financial Metrics Summary Output below represents the financial metrics for the four
promotion strategies. From the table, we observe that:
1. Strategy 4 had the highest promotional sales at 2379.
2. Strategy 3 had the highest post promotional sales at 1144.
3. Strategy 4 had the highest incremental sales at 1184.
4. Strategy 1 had the lowest post promotion dip at 71.
7
Paraphrase This Document
Need a fresh take? Get an instant paraphrase of this document with our AI Paraphraser
Marketing Analytics
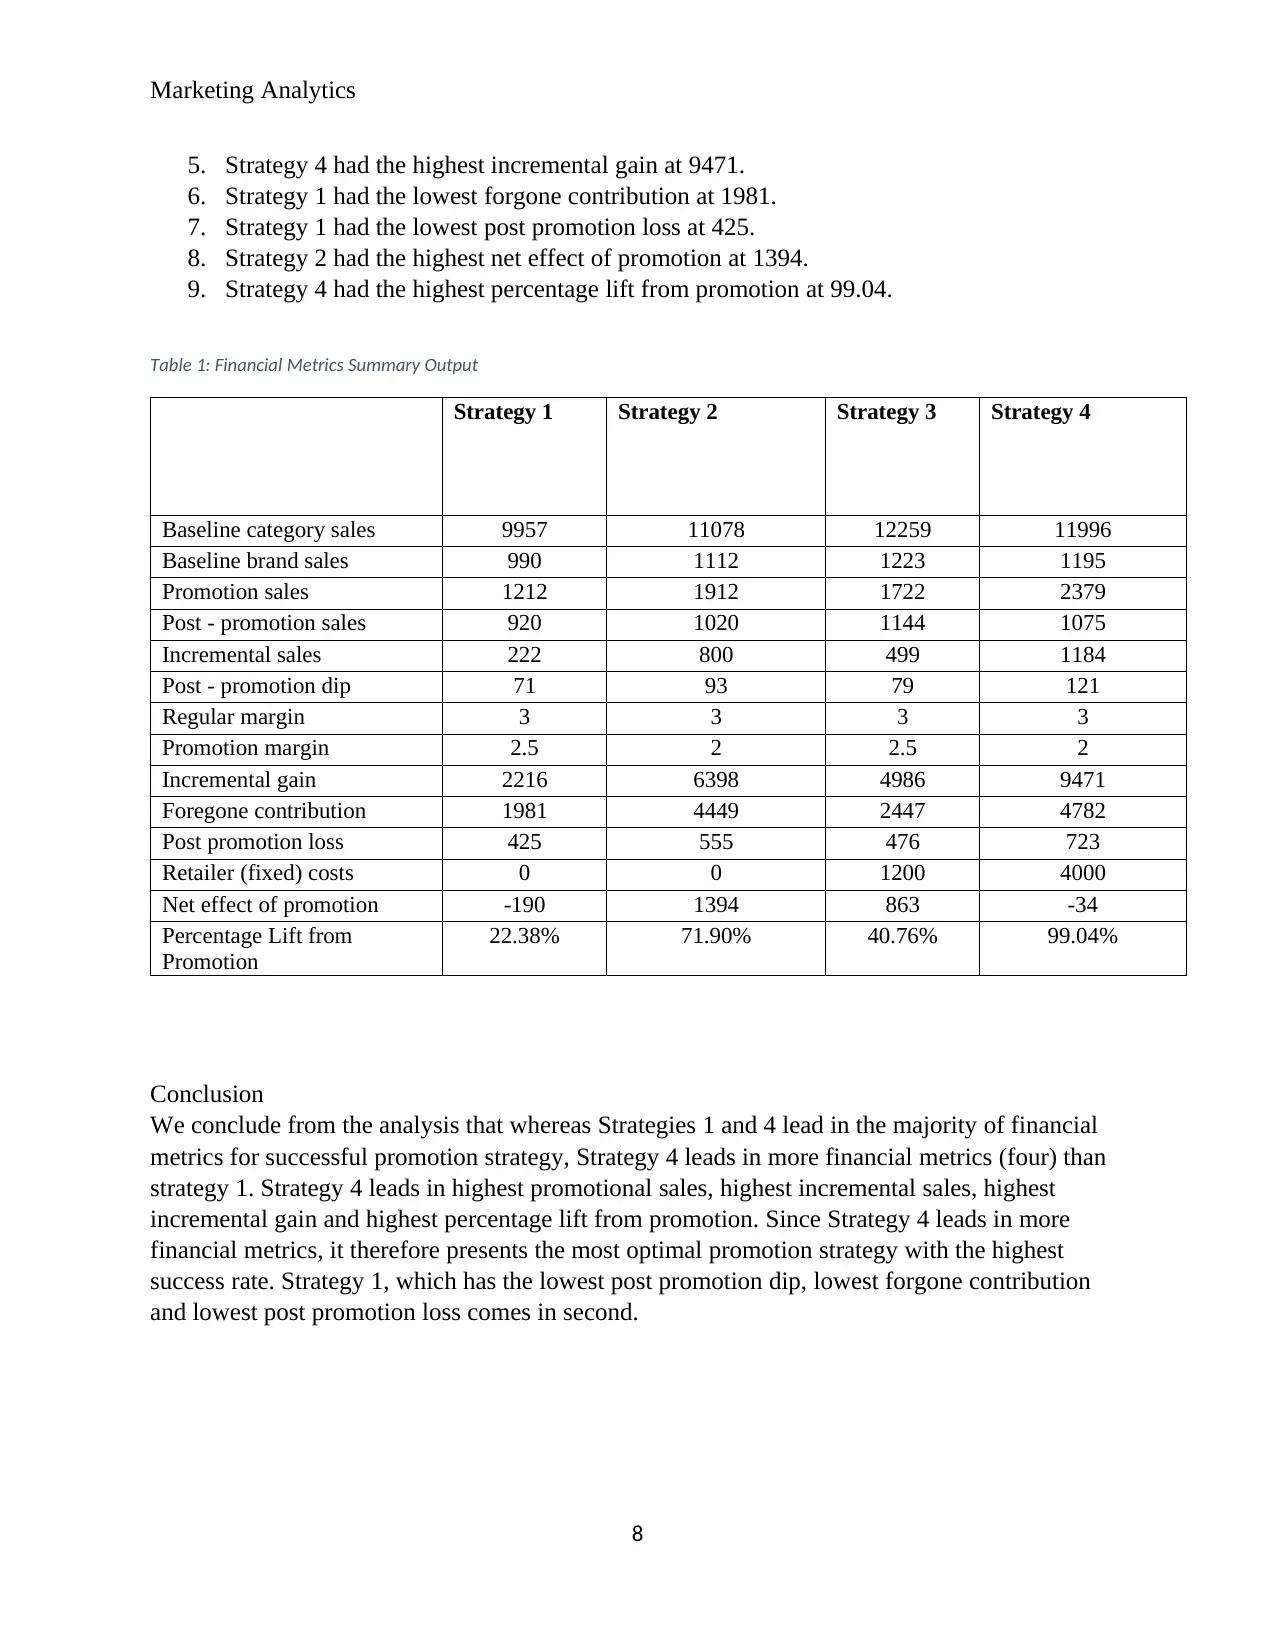
5. Strategy 4 had the highest incremental gain at 9471.
6. Strategy 1 had the lowest forgone contribution at 1981.
7. Strategy 1 had the lowest post promotion loss at 425.
8. Strategy 2 had the highest net effect of promotion at 1394.
9. Strategy 4 had the highest percentage lift from promotion at 99.04.
Table 1: Financial Metrics Summary Output
Strategy 1 Strategy 2 Strategy 3 Strategy 4
Baseline category sales 9957 11078 12259 11996
Baseline brand sales 990 1112 1223 1195
Promotion sales 1212 1912 1722 2379
Post - promotion sales 920 1020 1144 1075
Incremental sales 222 800 499 1184
Post - promotion dip 71 93 79 121
Regular margin 3 3 3 3
Promotion margin 2.5 2 2.5 2
Incremental gain 2216 6398 4986 9471
Foregone contribution 1981 4449 2447 4782
Post promotion loss 425 555 476 723
Retailer (fixed) costs 0 0 1200 4000
Net effect of promotion -190 1394 863 -34
Percentage Lift from
Promotion
22.38% 71.90% 40.76% 99.04%
Conclusion
We conclude from the analysis that whereas Strategies 1 and 4 lead in the majority of financial
metrics for successful promotion strategy, Strategy 4 leads in more financial metrics (four) than
strategy 1. Strategy 4 leads in highest promotional sales, highest incremental sales, highest
incremental gain and highest percentage lift from promotion. Since Strategy 4 leads in more
financial metrics, it therefore presents the most optimal promotion strategy with the highest
success rate. Strategy 1, which has the lowest post promotion dip, lowest forgone contribution
and lowest post promotion loss comes in second.
8
Marketing Analytics
Recommendations
From these conclusions, we can make the following recommendations:
1. If Carman’s Kitchen wants to apply a single strategy of promotion, it should adopt
strategy 4 for its promotion drive.
2. If Carman’s Kitchen wants to apply a mixed approach to promotion, it should adopt both
strategies 1 and 4 for its promotion drive. This mixed approach would ensure that the
promotion drive benefits from the strengths of both strategies.
9
⊘ This is a preview!⊘
Do you want full access?
Subscribe today to unlock all pages.
Trusted by 1+ million students worldwide
Marketing Analytics
References
Albright, CS & Winston, WL 2014, Business Analytics: Data Analysis & Decision Making, 1st
edn, Cengage Learning, New York.
Farris, PW & Neil, BT 2010, Marketing Metrics, 2nd edn, Pearson Education, New Jersey.
Kiechel, W 2010, The Lords of Strategy, 2nd edn, Havard Business Press, New York.
Laudon, KC & Guercio, TC 2014, E-commerce. Business. Technology. Society, 10th edn,
Pearson, New York.
O'Malley, L & Lichrou, M 2016, 'Marketing Theory', in MJ Baker & S. Hart, The Marketing
Book, Routledge pp. 37-52.
Sheth, JN 2017, Legends in Marketing, 6th edn, Sage Publications, New York.
10
1 out of 10
Related Documents


Your All-in-One AI-Powered Toolkit for Academic Success.
+13062052269
info@desklib.com
Available 24*7 on WhatsApp / Email
![[object Object]](/_next/static/media/star-bottom.7253800d.svg)
Unlock your academic potential
Copyright © 2020–2026 A2Z Services. All Rights Reserved. Developed and managed by ZUCOL.