HC2022 Marketing Research Report: Sky High Real Estate Analysis

Verified

Added on  2022/12/18

|10
|1945
|389
Report
AI Summary
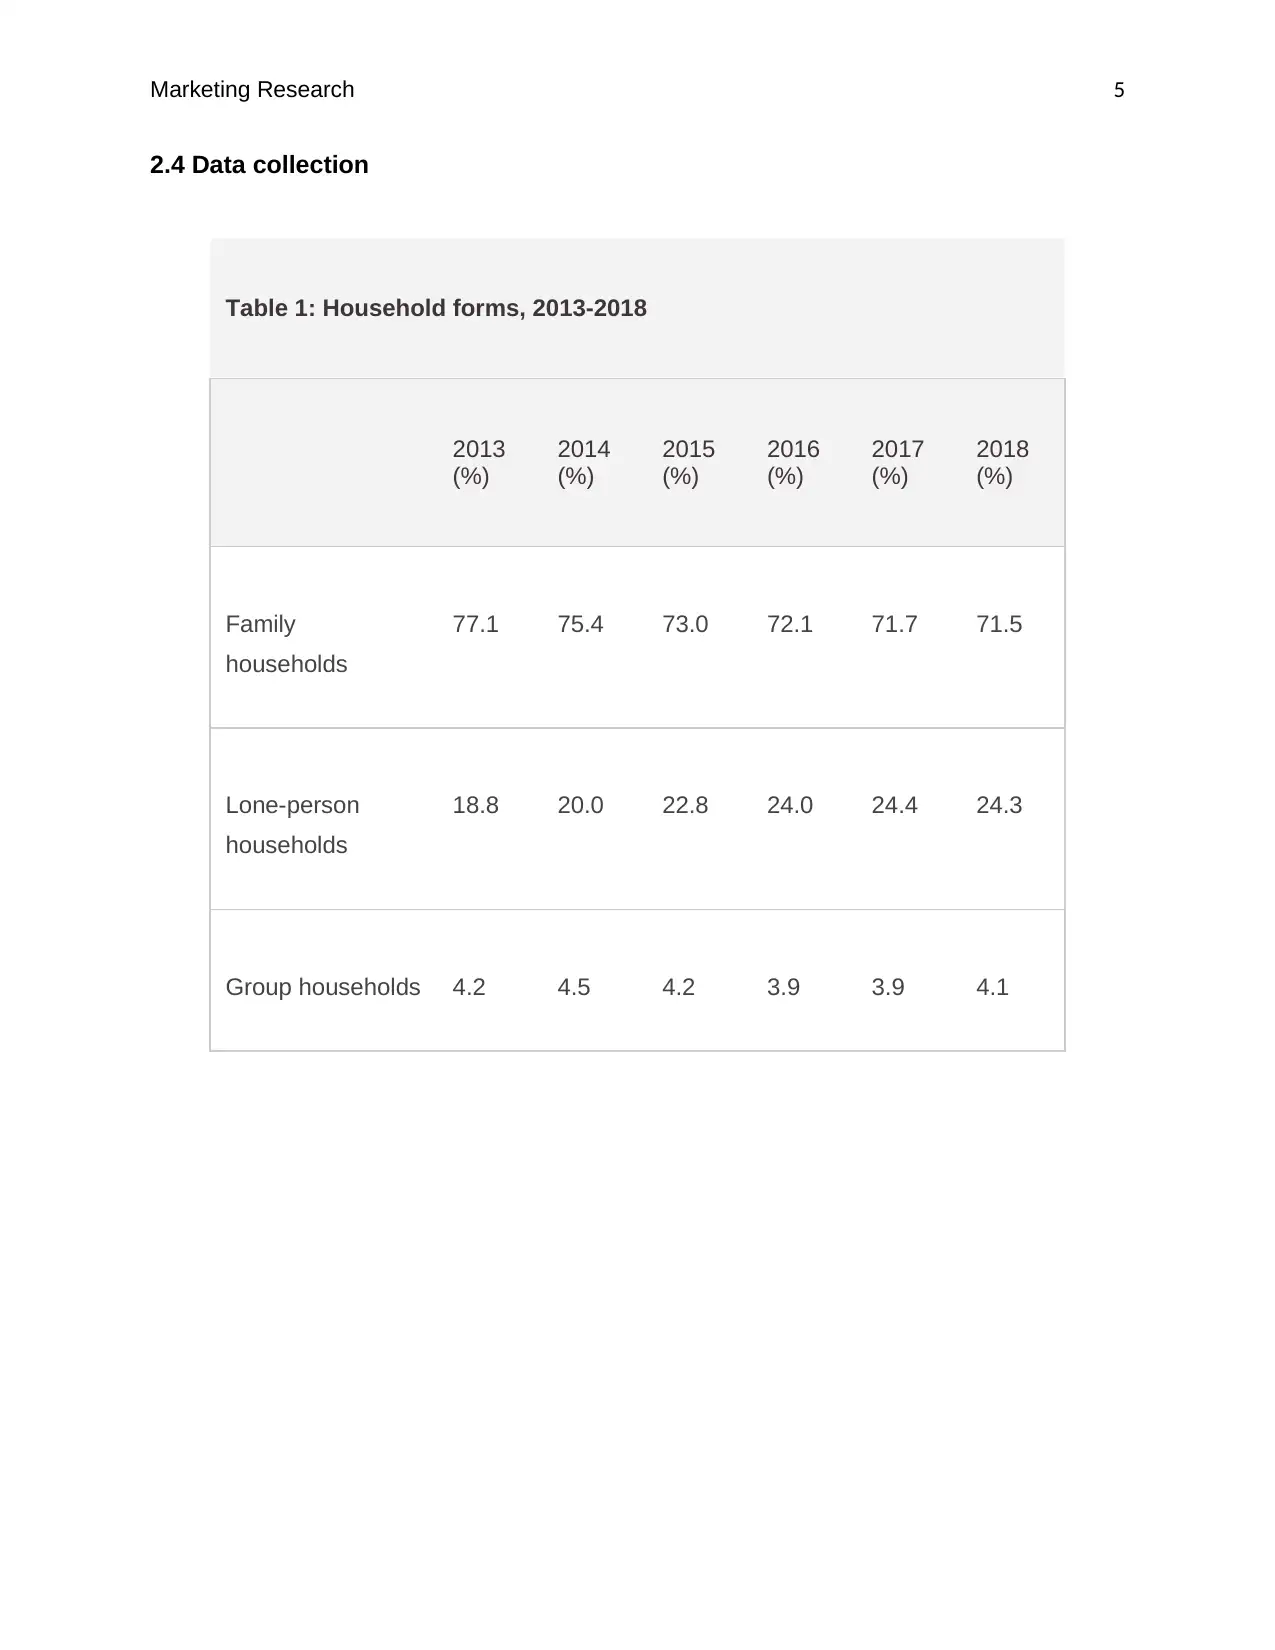
This report, prepared for HC2022 Marketing Research, analyzes the Australian real estate market using secondary data from sources like the Australian Bureau of Statistics and the Australian Housing and Urban Research Institute. The research focuses on household structures, family compositions, and dwelling preferences across major cities such as Sydney, Melbourne, Brisbane, Perth, and Adelaide. The analysis reveals that family households remain dominant, with separate houses and those with four or more bedrooms being the most popular. The report projects future trends, emphasizing the continued importance of family-oriented housing. Based on these findings, the report recommends that Sky High developers focus on separate houses, especially those with multiple bedrooms, to cater to the evolving needs of the Australian market, thereby enhancing their competitive advantage in the dynamic real estate sector.
Document Page
Running Header: Marketing Research 1
Marketing Research
Name of Student
Name of Institution
Name of Course
Date of Submission
tabler-icon-diamond-filled.svg

Paraphrase This Document

Need a fresh take? Get an instant paraphrase of this document with our AI Paraphraser
Document Page
Marketing Research 2
Table of Contents
1.0 Introduction…………………………………………………………………………… 3
2.0 Research process…………………………………………………………………….3
2.1 Research problem……………………………………………………………...…….3
2.2 Research Design…………………………………………………………………..…3
2.3 Sample………………………………………………………..….……………………4
2.4 Data collection…………………………………………...……….…………………..5
2.5 Data analysis…………………………………………….…….……………………..7
3.0 Conclusion and Recommendations…………………………….………………….8
References………………………………………………………………………………..10
Document Page
Marketing Research 3
1.0 Introduction
The ever changing economic and social trends in Australia provides a tacit reason why
real estate developers ought to have a good grasp of the dynamics that surround the
market environment. According to the Australian Urban Research Institute, 90% of the
entire population in Australia comprise families that are staying together. The data
includes both single parent families and those that involve both the parents. Similarly, a
good number of these households are concentrated in the major metropolitan cities
which include Sydney, Queensland and Brisbane just to mention but few. The
information from the research institute also projects a possible shift in the structure and
formation of these households and families in the coming 20 years (Dalton and Horne,
2013). In order to predict the future of real estate development in Australia, this paper
shall involve the use of secondary data to identify the current trends in this industry and
hence the possible adjustment which Sky High may need to undertake in order to
remain relevant in the market despite its dynamic nature.
2.0 Research process
2.1 Research problem
In 2018, the Australian Bureau of Statistics revealed that out of the over 9 million
households in the country, 75% were family households while 13% were group family
households. The remaining percentage were group households. The current statistics
therefore bring out the fact that most of the households especially in the urban centers
are family households. Past records from the same institution reveals similar statistics.
However, the changing social and economic trends in the country points towards a
possible change in the structure of these families and households in the next 20 years.
The real estate developer therefore needs to conduct a market research not only on the
current set ups but also on the housing properties which are in demand at the moment.
With this information, the company can project the possible changes that can be
expected in future in relation to this sector before coming up with the most essential
strategies aimed at addressing the identified uncertainties.
2.2 Research Design
The research process entirely relied on the information derived from secondary sources.
This research methodology was chosen since secondary data is not only readily
available but also cheap hence easy to obtain. Secondary source offer a god alternative
especially in cases where primary data cannot be obtained. Based on the nature of this
research, obtaining primary data would be cumbersome and expensive hence the
settlement on secondary data. In addition to being economical and time saving,
secondary data enhances a better understanding of the research problem since it
provides a platform on which data can be compared which increases validity and
reliability.
Document Page
Marketing Research 4
2.3 Sample
The research process was conducted on the country’s five most populous urban centers
including: Sydney, Melbourne, Perth, Brisbane and Adelaide. The information on the
structure and nature of households and families in these cities was derived from 3
credible sources which include: Australian Bureau of Statistics website, Australian
Housing and Urban Research Institute Journal which is a peer reviewed article as well
as the Family Characteristics and Transitions, Australia website. The information
obtained from these sources was then compiled and presented for analysis before
deriving tacit conclusions from the same.
tabler-icon-diamond-filled.svg

Paraphrase This Document

Need a fresh take? Get an instant paraphrase of this document with our AI Paraphraser
Document Page
Marketing Research 5
2.4 Data collection
Table 1: Household forms, 2013-2018
2013
(%)
2014
(%)
2015
(%)
2016
(%)
2017
(%)
2018
(%)
Family
households
77.1 75.4 73.0 72.1 71.7 71.5
Lone-person
households
18.8 20.0 22.8 24.0 24.4 24.3
Group households 4.2 4.5 4.2 3.9 3.9 4.1
Document Page
Marketing Research 6
Table 2 showing the comparison of household forms across the five urban
centers in Australia
Sydney Perth Melbourne Brisbane Adelaide
Family households 70 69 73 72 71
Lone-person
households
15 21 22 25 26
Group households 5 10 5 3 3
Table 3 showing family compositions
Family composition Australia(2018)
Couple family without children 2,291,987
Couple family with children 2,716,224
One parent family 959,543
Other family 102,559
Document Page
Marketing Research 7
Table 4: Summary tables of houses in terms of demand level
Dwelling structure Australia
Separate house 6,041,788
Semi-detached, row or terrace house, townhouse etc 1,055,016
Flat or apartment 1,087,434
2.5 Data analysis
The data presented above was obtained from government websites and peer reviewed
articles which enhances the credibility of the information. Table 1 summarizes the
household forms over a period of 5 years between 2013 and 2018. It is eminent that
family households comprise a big chunk of the entire Australian population. Lone family
households come at a distant second while group households are the fewest. The table
equally reveals a degree of consistency which can in turn be used to depict that in the
coming years, family households are still likely to take a major portion of the entire
population in Australia (Burke and Hulse, 2010). Consequently, the developer needs to
identify the right properties which are likely to satisfy such household structures in
future.
The second table shows the distribution of the three major categories of households
across the different cities in Australia. While the data confirms that family household still
dominate the sample population, the number varies from one metropolitan environment
to another. According to the information shown, Sydney, Melbourne and Brisbane have
the highest population of family households. This information would equally be crucial
for Sky High when it comes to determining the specific market locations that would be
the most appropriate for the establishment of their properties.
Number of bedrooms
Occupied private dwellings Australia
None (includes bedsitters) 39,769
1 bedroom 411,252
2 bedrooms 1,562,759
3 bedrooms 3,403,190
4 or more bedrooms 2,670,758
tabler-icon-diamond-filled.svg

Paraphrase This Document

Need a fresh take? Get an instant paraphrase of this document with our AI Paraphraser
Document Page
Marketing Research 8
The third table is a summary of family compositions divided into four main categories.
Couple families with children is the largest in number followed by couple families without
children. Fewer households comprise single parent families. This data would be crucial
in determining the size of the properties that the developer intends to invest in (Otto,
2017). With reference to the information gathered above, Sky High may consider
investing in residential houses which would be spacious and accommodative enough for
couple families with children. This is because this is the most dominant household
structure in Australia and going by the past trends, it is likely to remain the most
dominant household form especially in the major urban areas even in 20 years to come.
The fourth table indicates the various types of houses and the level to which they are
preferred by families in Australia. The table reveals that the most famous dwelling
places are the separate houses which take over 60% of the entire sample.
Semidetached, row and terrace houses are the second most common but only take a
small percentage of whole sample (Landis, 2016). This number is almost similar to the
number of apartments or flats used as residential places mostly by the lone person
households. Similarly, houses with 4 bedrooms and above are most common property
types in Australia while those with 1 bedroom are the least popular. Houses with 2 or 3
bedrooms are fairly popular (Hilber and Vermilion, 2010). From this data, it is possible to
note that the houses which are currently in demand are the separate houses especially
those with 4 bedrooms and above. They are particularly in high demand due to the fact
that they can accommodate the family households which make the largest portion of the
population. Using this data, it can be projected that separate houses are likely to be the
most sought after properties in Australia in 20 years’ time. Additionally, houses with 4
bedrooms shall also remain to be high in demand. This offers Sky High a distinct
direction to be taken on the specific type of property to specialize in in future. This
information would be pivotal in enhancing the organization’s competitive advantage
despite the dynamic nature of the market.
3.0 Conclusion and Recommendations
The ever changing economic and social patterns in Australia is a phenomenon which
can be used to project the future trends in the area of real estate development. The
research process reveals the current structure of households and families in Australia
which can as well be used to predict the possible future changes. Based on the analysis
above, it can be concluded that family households is likely to be the most common
structure in future. The continued economic stability is another indicator that the
population especially in the urban areas is likely to escalate in the coming years. Finally,
separate houses with more number of rooms are likely to be the most sought after
property in future.
Document Page
Marketing Research 9
With respect to the conclusions above, the following recommendations can be made for
Sky High developers.
The organization ought to invest in separate houses as opposed to
apartments and terrace housing systems. This is because the research
project depicts that the demand for separate houses is likely to increase in
future.
The company may also need to consider specializing in bigger properties
which include houses with 4 bedrooms and above. These cabn either be
established as residential or build-to-rent properties to adequately cater for
the diverse needs of consumers.
Document Page
Marketing Research 10
References
Barker, K. (2013). Review of Housing Supply: Interim Report, HM Treasury. London:
Knopf.
Burke, T. and Hulse, K. (2010). The institutional structure of housing and the sub-prime
crisis: an Australian case study', Housing Studies, 25(6), pp. 821–838
Dalton, T. and Horne, R. (2013). Understanding the patterns, characteristics and trends
in the housing sector labour force, AHURI Final Report. Journal of Australian Housing
and Urban Research Institute Limited, Melbourne, 2(1), pp. 23-28.
Hilber, C. and Vermilion, W. (2010). The Impacts of Restricting Housing Supply on
House Prices and Affordability, Final Report, Department for Communities and Local
Government. London: Sage.
Landis, J. (2016). Growth management revisited—efficacy, price effects, and
displacement. Journal of the American Planning Association, 72(4), pp. 411–430.
Otto, G. (2017). The growth of house prices in Australian capital cities: What do
economic fundamentals explain?’ Australian Economic Review, 40(3), pp. 225–238
chevron_up_icon
1 out of 10
circle_padding
hide_on_mobile
zoom_out_icon
[object Object]