Data Analysis Techniques in Modern Marketing Research & Business

Verified

Added on  2023/06/10

|15
|1310
|392
Presentation
AI Summary
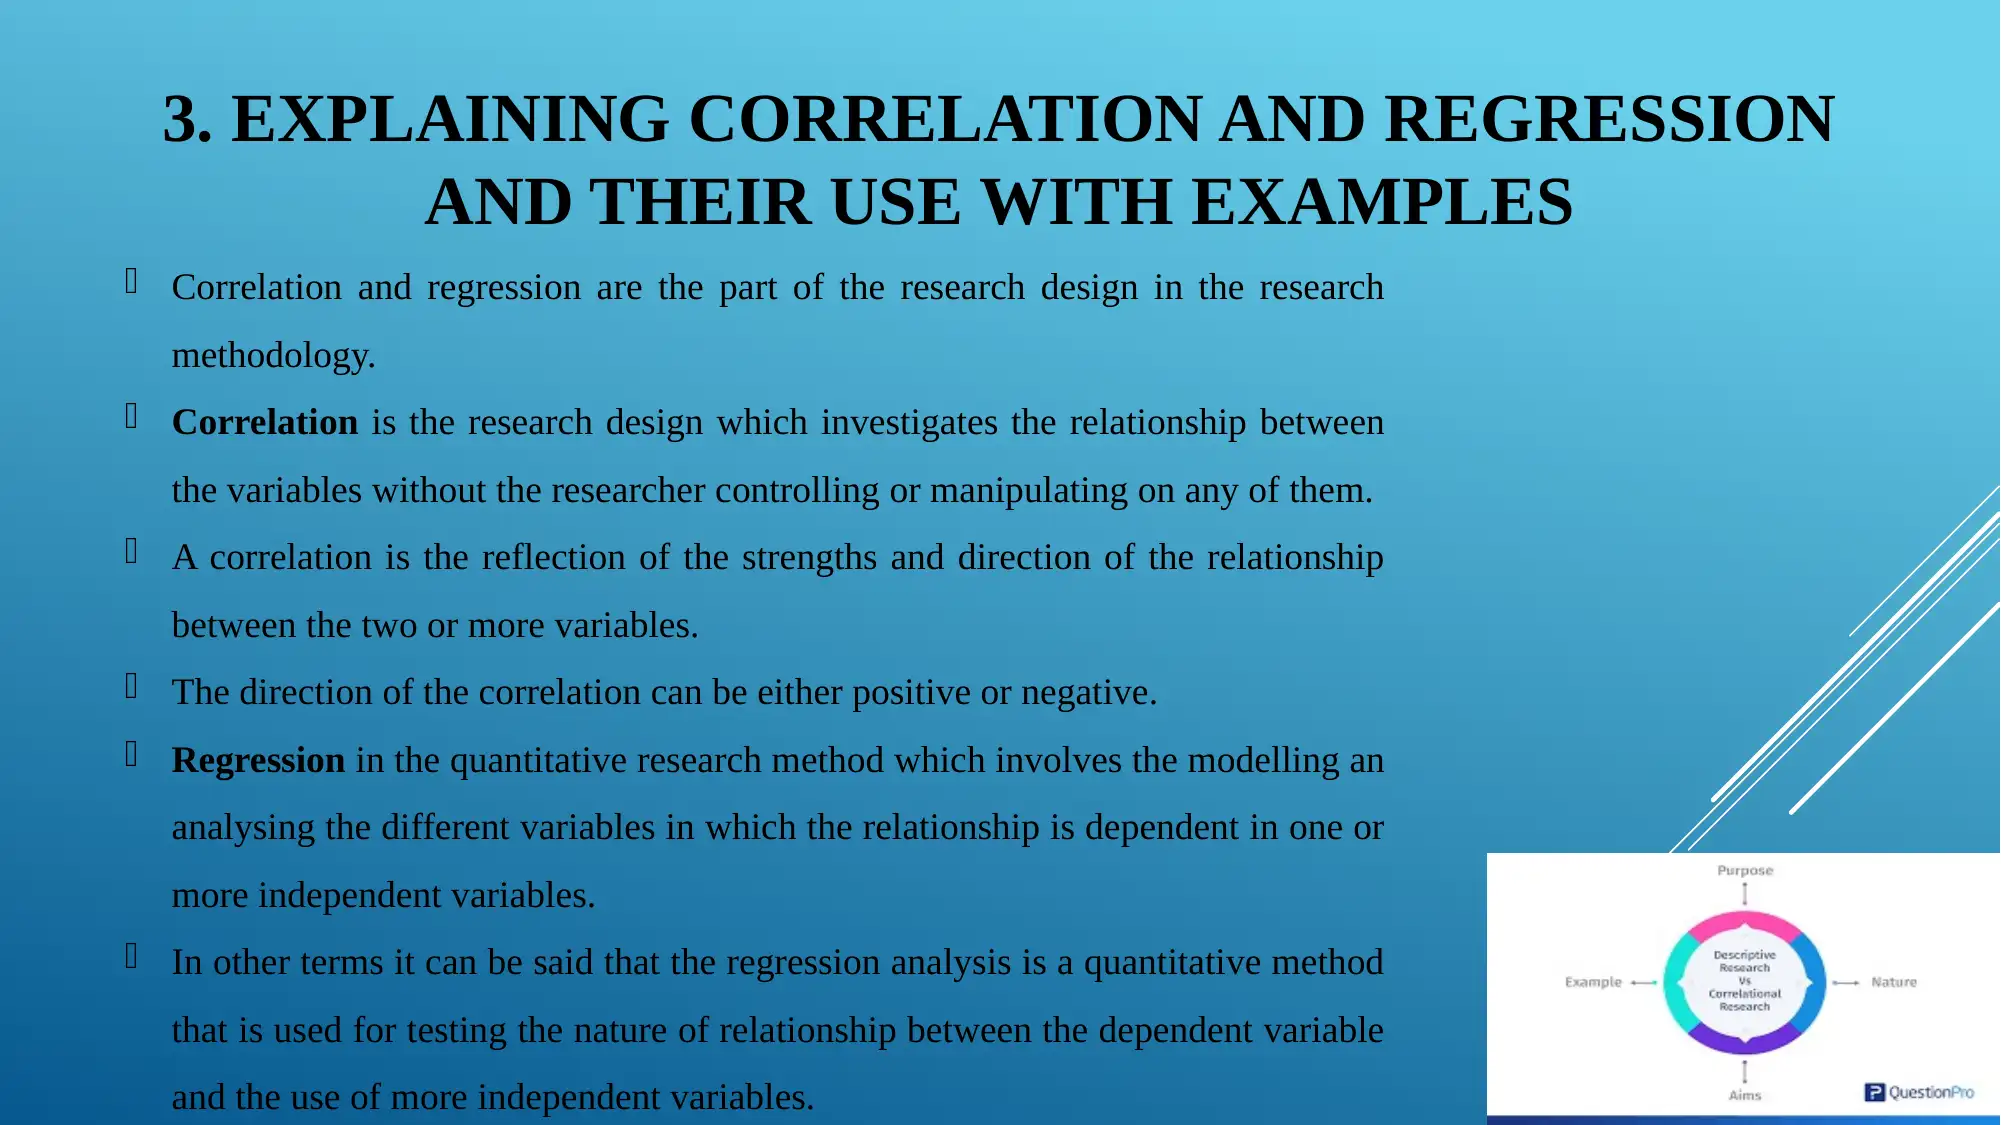
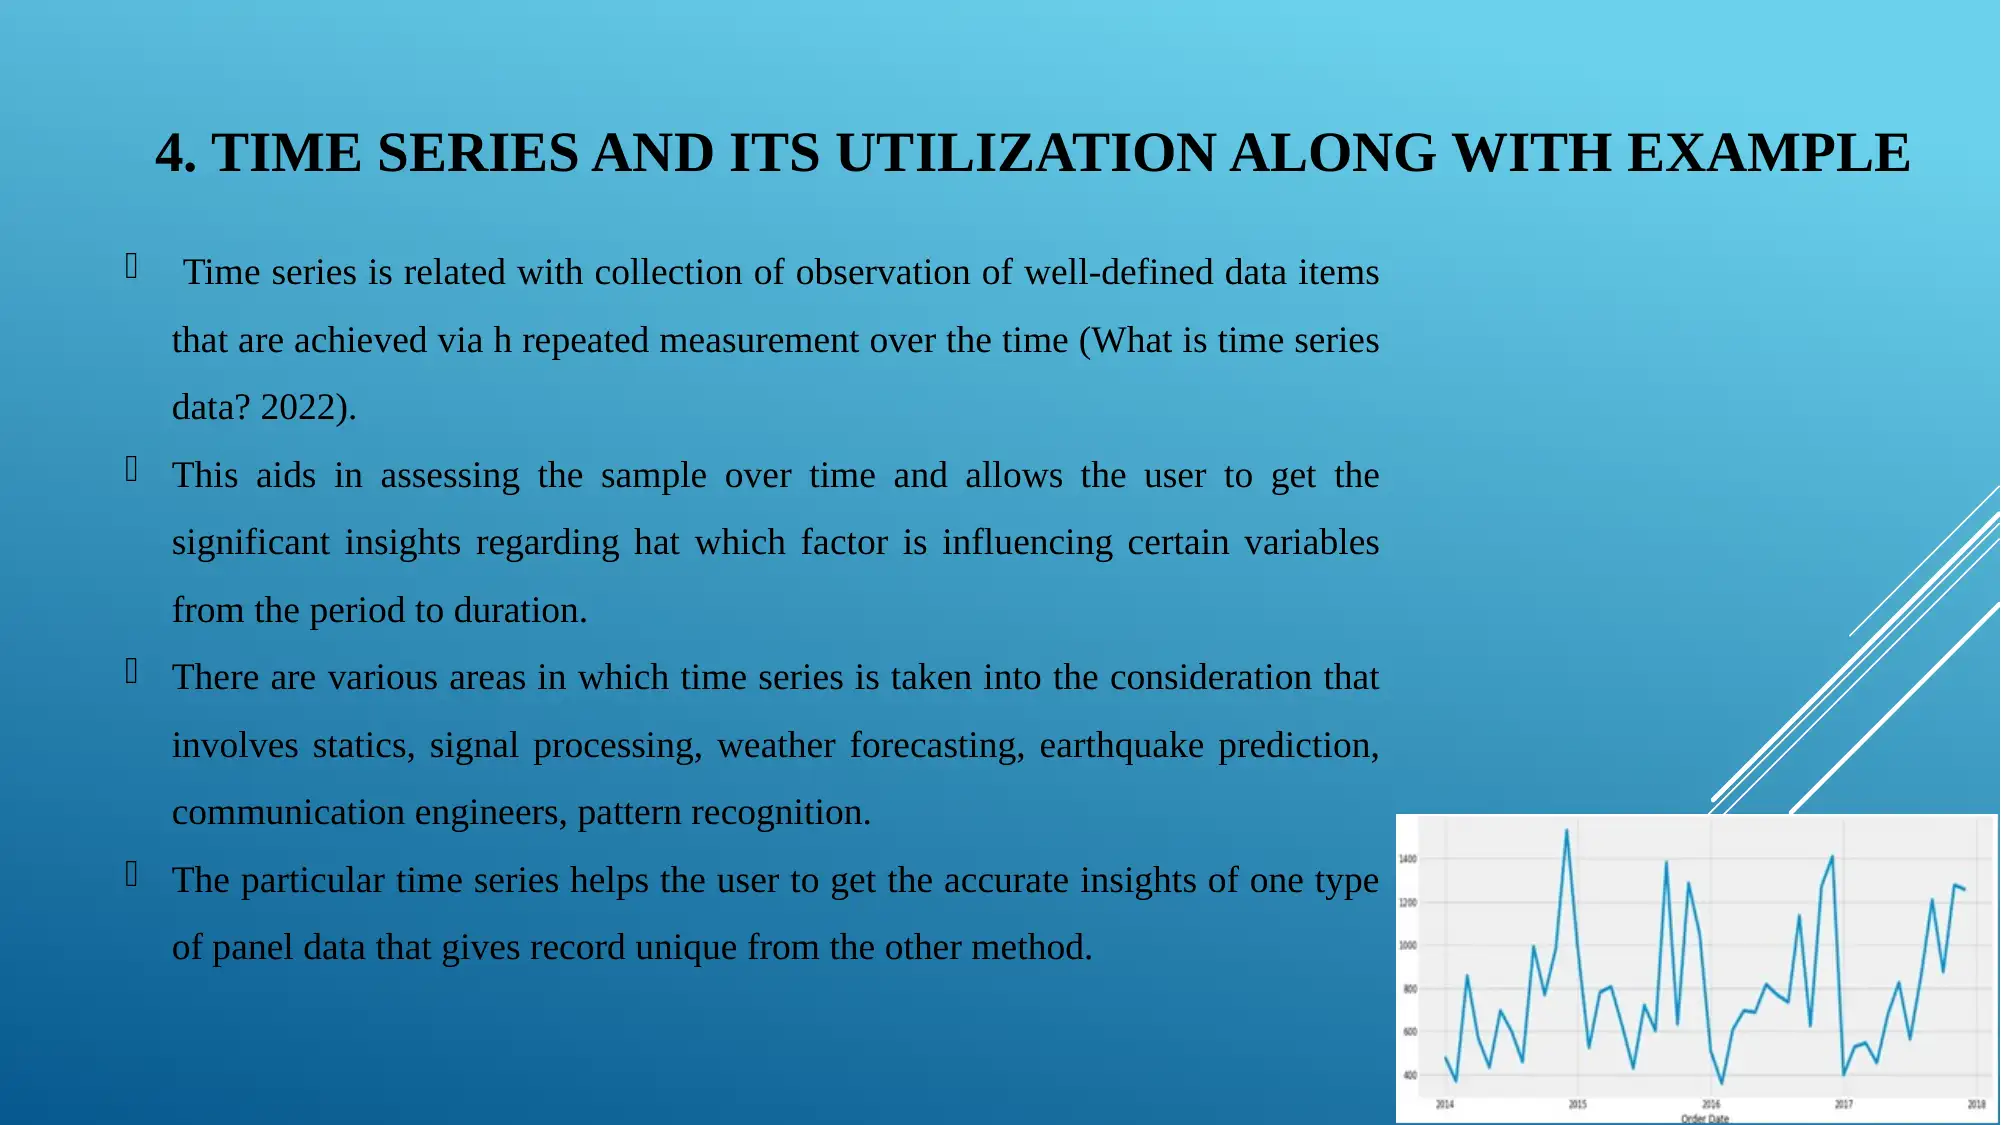
This presentation provides a comprehensive overview of data analysis techniques in modern marketing research. It begins by examining the role of quantitative research, emphasizing questionnaire design and different types of survey questions. It then explores qualitative research, highlighting its importance in identifying market gaps and offering competitive advantages. The presentation also explains correlation and regression, illustrating their uses with examples, followed by a discussion of time series analysis and its applications. Finally, it addresses the issues associated with these analysis techniques in the context of big data and modern business decision-making, and concludes with effective data collection methods for informed decision-making. This resource is available on Desklib, where students can find similar solved assignments and study tools.
tabler-icon-diamond-filled.svg

Contribute Materials

Your contribution can guide someone’s learning journey. Share your documents today.
Document Page
INTRODUCTION
Data insights refers towards the deep understanding an individual or
organization gain for the analyzation of the information which is related to a
particular issue or study.
It is helpful for the research, organization and the study for making better
decisions which can rely on the instinct.
In this presentation the role of quantitative research in the modern marketing
research and data will be explained with emphasis on good practices taken
from course work.
This presentation will explain the qualitative research and its role in the
modern marketing research and data analysis on discussion guide.
tabler-icon-diamond-filled.svg

Secure Best Marks with AI Grader

Need help grading? Try our AI Grader for instant feedback on your assignments.
Document Page
1. ROLE OF QUANTITATIVE RESEARCH IN MODERN
MARKETING RESEARCH WITH EMPHASIS ON
QUESTIONNAIRE DESIGN
The quantitative research is the process of collecting and analyzing the numeric
data which is able to find the patterns and average, for making predictions testing
casual relationships that can help in generalizing to the wider populations.
QUANTITATIV
E RESEARCH
Correlational
research
Experimenta
l research
Descriptive
research
Document Page
CONTINUE..
In the quantitative research the preparation of the questionnaire is
very important for gathering the data from the survey.
Quantitative survey questions are defined as the objective question
used as the gain of detailed insights from the respondents about the
survey research topic.
These answers are helpful for the receiving the quantitative survey
questions are analyzed and a research report is generated on the
basis of this quantitative data.
There are different form of quantitative survey questions such as,
Descriptive survey Questions
Comparative survey Questions
Relationship survey Questions
Document Page
2. ROLE OF QUALITATIVE RESEARCH IN MODERN
MARKETING RESEARCH AND DATA ANALYSIS WITH
EXAMPLES
Qualitative Research (QR) is concerned with having the significant procedure of collecting the theoretical
information regarding the prevailing circumstances in the market so that significant lacking areas can be identified
to make improvements.
Collecting
information
Evaluating
information
Helping in
identifying lacking
areas
Forecasting impact
of marketing
technique
Recognizing
potential trend
Offering firm competitive
advantage by getting ability to
offer solution to problems
Promoting
improvement
Provides assistance
in reducing cost
Strategic decision-
making
tabler-icon-diamond-filled.svg

Secure Best Marks with AI Grader

Need help grading? Try our AI Grader for instant feedback on your assignments.
Document Page
EXAMPLE:
1. Is the offered products is helpful in accomplishing your needs?
Yes
No
2. What is the reason for switching to the other brand ?
Higher price
Ineffective quality
Improper information sharing
3. Other which is the improvement area firm should pay attention on to meet demands of
marketing?
Continuous customer review taking
Quality improvement
Fair pricing strategy
Extending product line
Document Page
3. EXPLAINING CORRELATION AND REGRESSION
AND THEIR USE WITH EXAMPLES
Correlation and regression are the part of the research design in the research
methodology.
Correlation is the research design which investigates the relationship between
the variables without the researcher controlling or manipulating on any of them.
A correlation is the reflection of the strengths and direction of the relationship
between the two or more variables.
The direction of the correlation can be either positive or negative.
Regression in the quantitative research method which involves the modelling an
analysing the different variables in which the relationship is dependent in one or
more independent variables.
In other terms it can be said that the regression analysis is a quantitative method
that is used for testing the nature of relationship between the dependent variable
and the use of more independent variables.
Document Page
EXAMPLES
CORELLATION
It shows the relationship between two variables, Lets assume there are two
variable disease and marriage.
If marriage has negative association with cancer hence it can be said that the
married people are less likely to develop cancer.
tabler-icon-diamond-filled.svg

Paraphrase This Document

Need a fresh take? Get an instant paraphrase of this document with our AI Paraphraser
Document Page
CONTINUED
REGRESSION
Customers are generally not experts at expressing their emotions and feelings in a survey, and they
are able to ask the customers about the rating at the restaurant.
Hence, when the customers are asked about the reason why they have rated the restaurant 10 out
of 10.
On the likelihood to recommend they might be able to explain the reason why they find the
restaurant as a 10 such as , “good prices” or “good food” in an open-ended comment.
Document Page
4. TIME SERIES AND ITS UTILIZATION ALONG WITH EXAMPLE
Time series is related with collection of observation of well-defined data items
that are achieved via h repeated measurement over the time (What is time series
data? 2022).
This aids in assessing the sample over time and allows the user to get the
significant insights regarding hat which factor is influencing certain variables
from the period to duration.
There are various areas in which time series is taken into the consideration that
involves statics, signal processing, weather forecasting, earthquake prediction,
communication engineers, pattern recognition.
The particular time series helps the user to get the accurate insights of one type
of panel data that gives record unique from the other method.
Document Page
5. THE ISSUES OF MENTIONED ANALYSIS TECHNIQUES
IN REFERENCE TO BIG DATA AND MODERN BUSINESS
DECISION-MAKING
Issues of regression technique:
Over fitting
Missing data
Non constant variance & weighted least square
Extrapolation
Assumption of linearity between dependent & independent variables.
No assessment of errors in data
Determination of relationship but emphasis on underlying causal mechanism
tabler-icon-diamond-filled.svg

Secure Best Marks with AI Grader

Need help grading? Try our AI Grader for instant feedback on your assignments.
Document Page
CONTINUED
Pitfalls of correlation:
No identification of cause & effects
Time consuming process
Only uncovers relationship
Does not determine which variable have the most influence
Outcomes can be adversely impacted by the quality of work
Document Page
CONTINUED
Disadvantages of time series
Expensive procedure
Difficulty in obtaining the appropriate measures
Problem with the generalization from the single study
Inability to recognize suitable method for presenting data
Risk of ignoring the foreseeable environment factors
Document Page
6. DATA COLLECTION EFFECTIVELY FOR MORE
INFORMED BUSINESS DECISION
Data collection refers to the procedure of obtaining the information via using different sources.
In the current era, there is higher level of competition which require firm to pay attention on
gaining the significant and accurate information so that strategic decision can be made.
Primary method is associated with collecting the information from the specific target audience in
order to solve the specific issue (Nicholson, 2022). This type of the data is basically had not been
utilized previous and specially gathered for the specific reason.
Secondary research method is related with gathering the crucial information about the particular
subject matter that is already published and available for the different kinds of parties.
This provides assistance in gaining the published data that is highly reliable, relevant and valid
according to the conducted research.
tabler-icon-diamond-filled.svg

Paraphrase This Document

Need a fresh take? Get an instant paraphrase of this document with our AI Paraphraser
Document Page
CONTINUED..
Primary method
Survey
Interview
observation
focus group
Secondary method
Books
Journals
Articles
Document Page
CONCLUSION
This presentation concludes that the data insights are very
important for the quantitative research.
In this project the role of quantitative research in the modern
marketing research and data analysis with relation to the
questionnaire design and their examples has been used for good
practice.
This project has been able to analyze the quantitative research and
it utilized in the modern marketing for the discussion related to
the guide and design for being used in the good practice.
For establishment of the correlation and regression is the factor
and their use in the research with the help of examples has been
explained.
In this study the time services has been explained with examples
of their utilization in the research.
chevron_up_icon
1 out of 15
circle_padding
hide_on_mobile
zoom_out_icon
logo.png

Your All-in-One AI-Powered Toolkit for Academic Success.

Available 24*7 on WhatsApp / Email

[object Object]