Individual Report: Market Research for Real Estate Developers (HC2022)
VerifiedAdded on 2022/09/21
|11
|1987
|21
Report
AI Summary
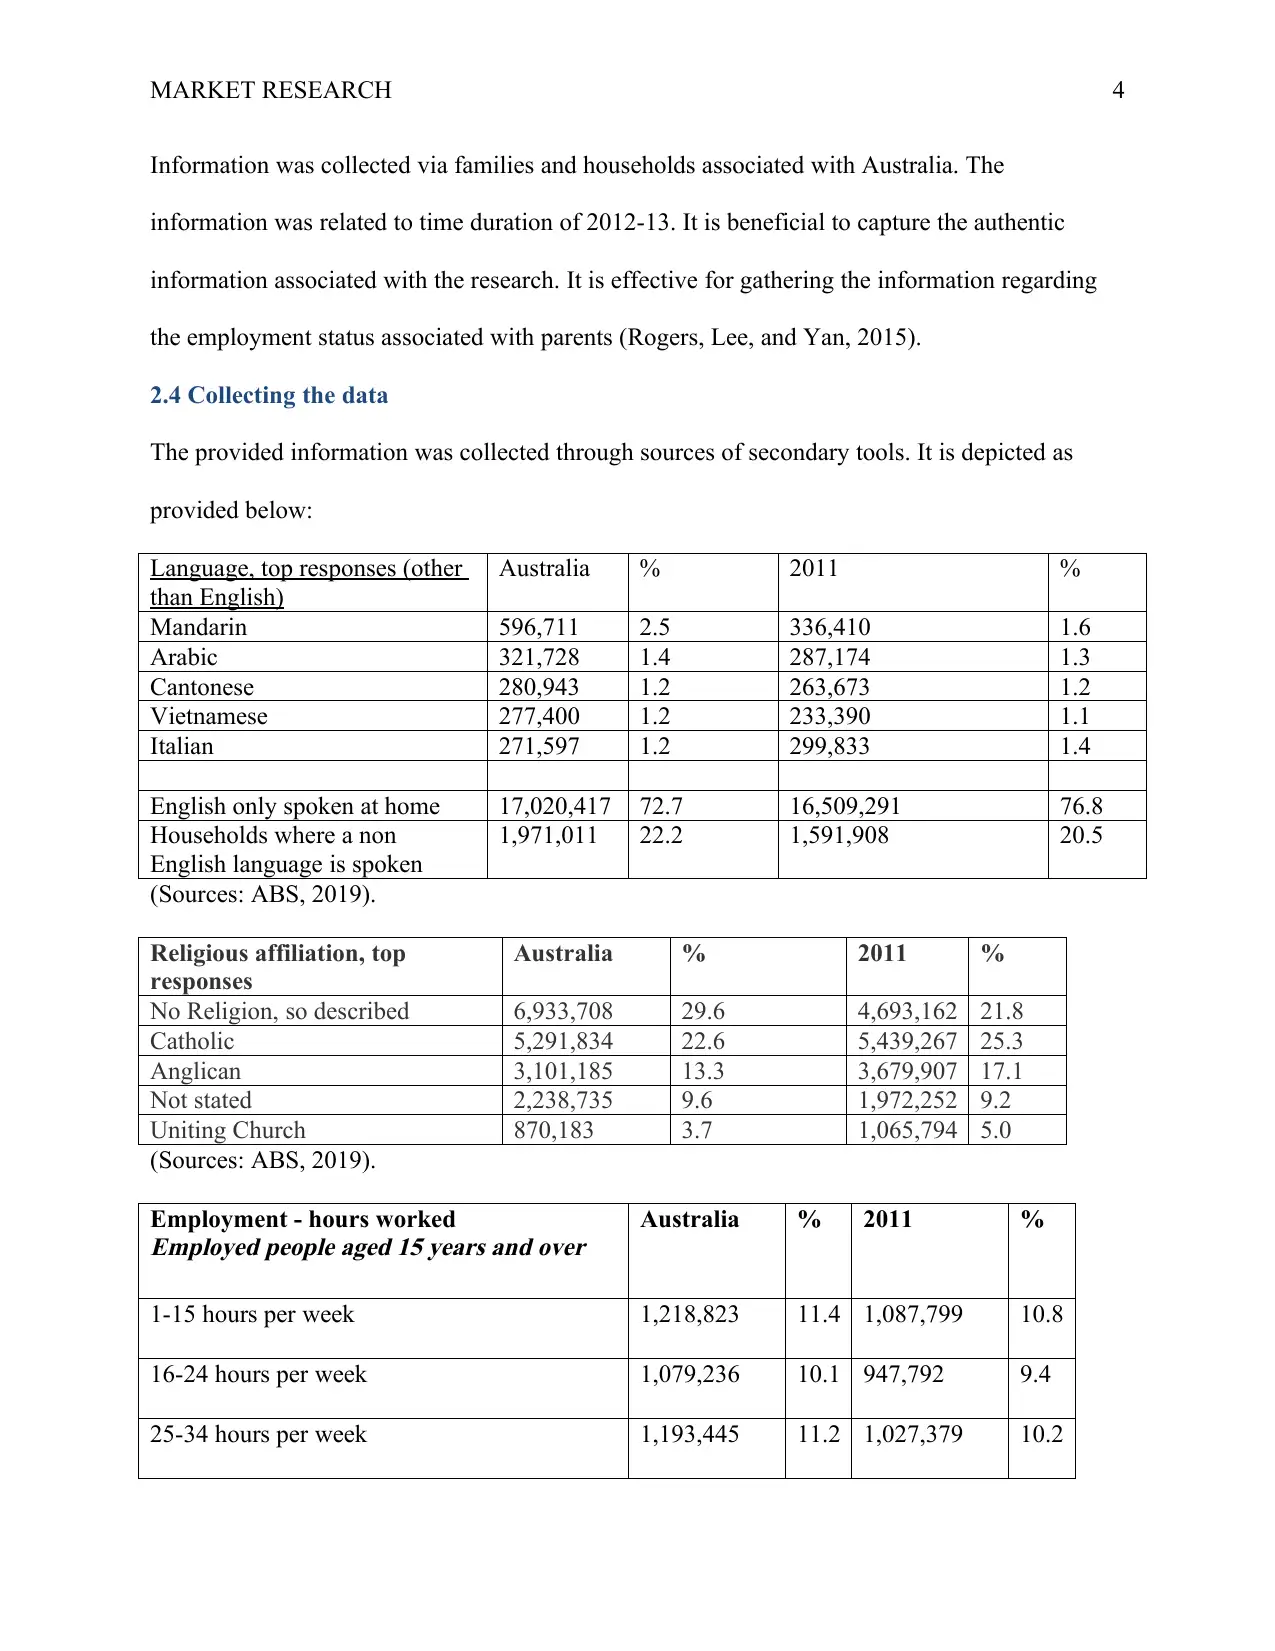
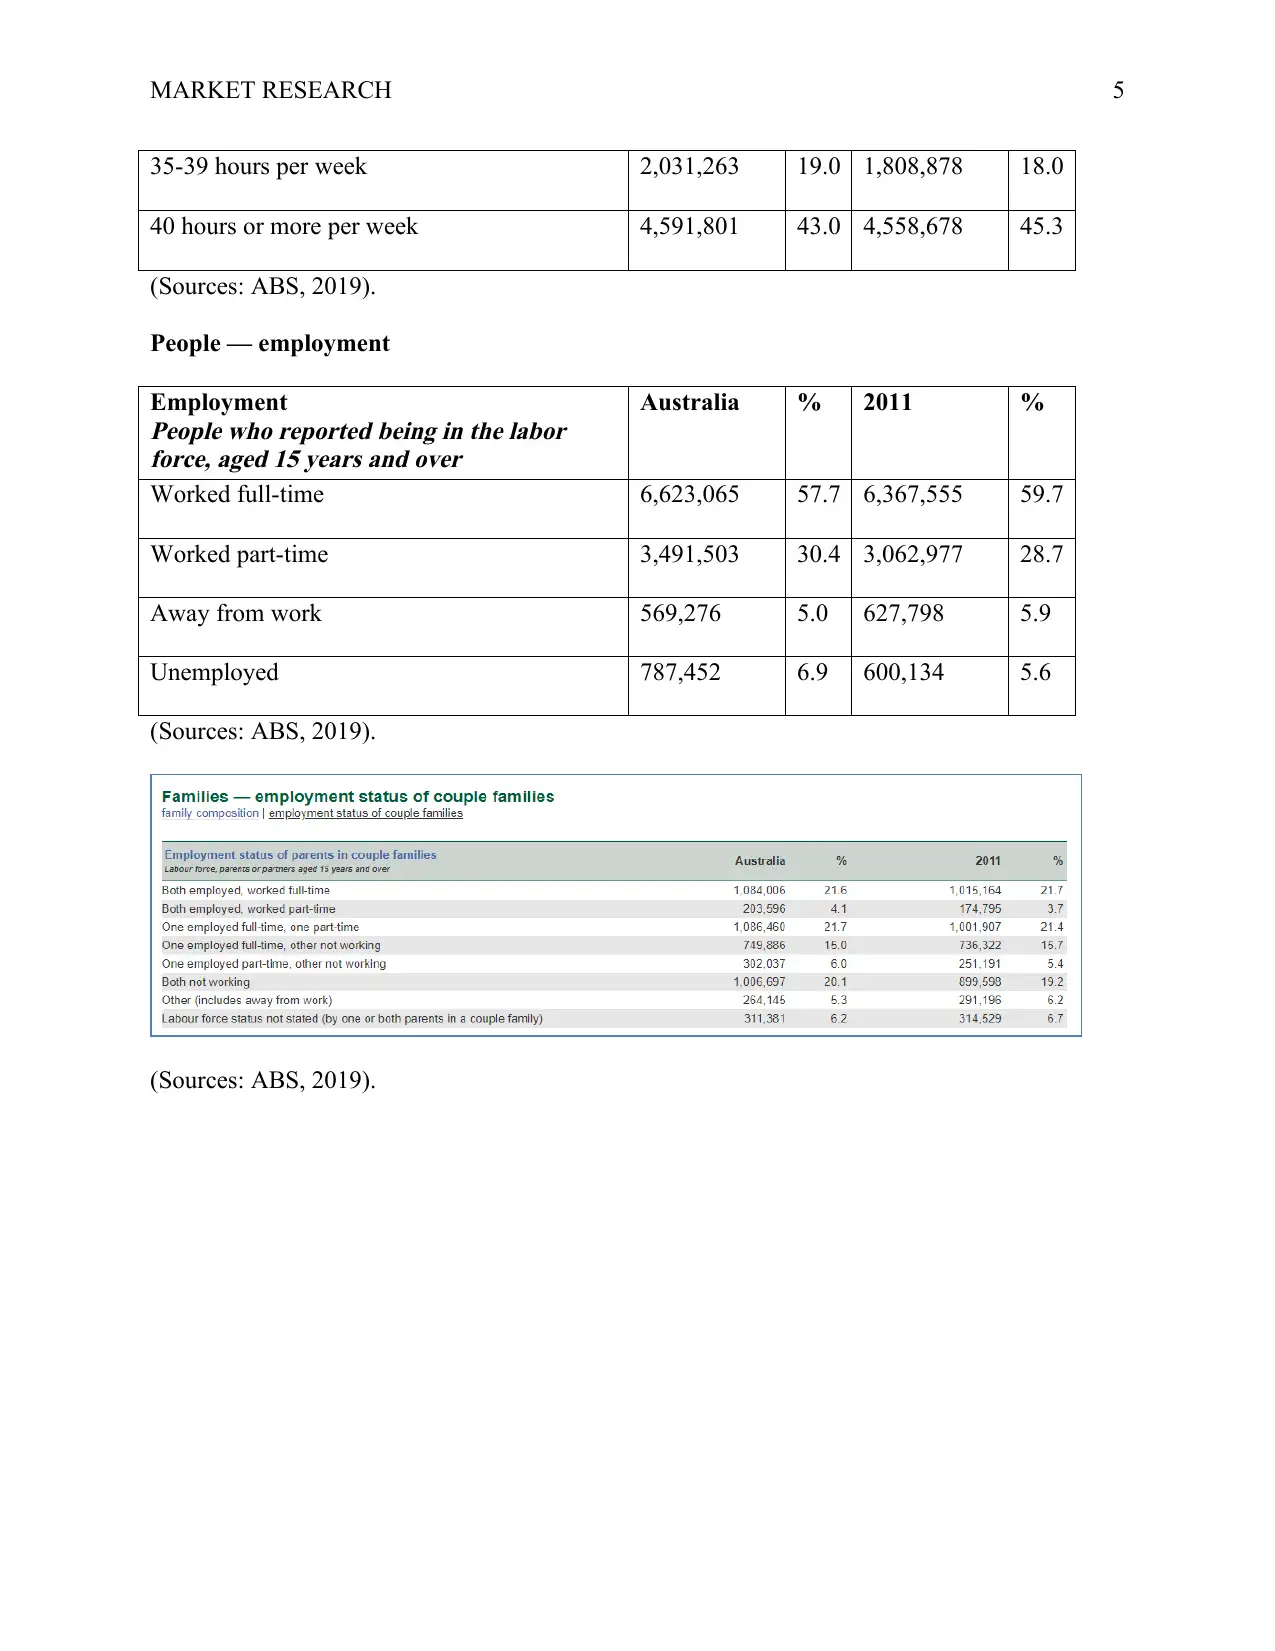
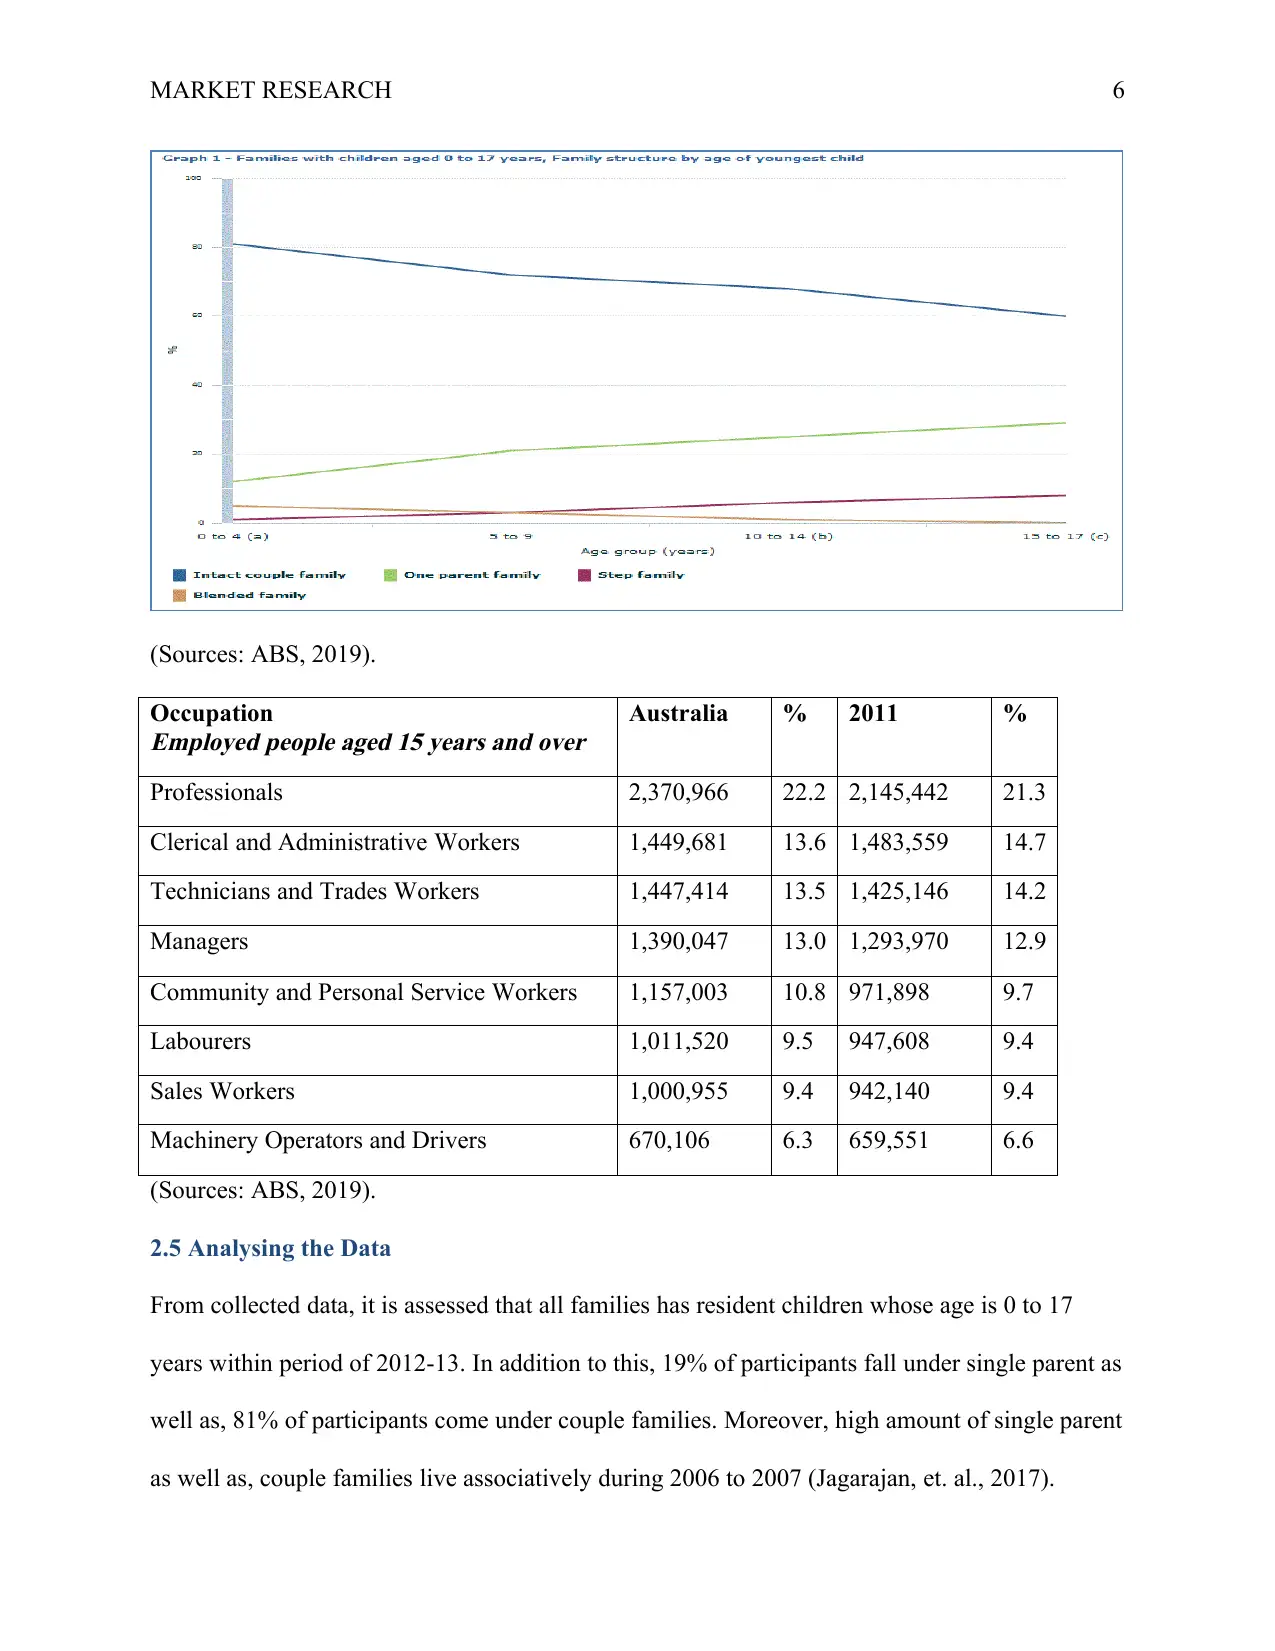
This report presents a market research analysis conducted to understand the evolving needs of households and families in Australia, specifically in the context of the real estate market. The research utilizes a qualitative design and secondary data sources, primarily focusing on information from the Australian Bureau of Statistics (ABS) regarding family characteristics and transitions. The report details the research process, including problem definition, research design, sample planning, and data collection from sources like the 2016 Census QuickStats and the 4442.0 Family Characteristics and Transitions report. The analysis examines various aspects of the Australian population, such as language spoken at home, religious affiliations, employment statistics (hours worked, occupation, and labor force participation), and family structures. Findings highlight the prevalence of couple and single-parent families, employment patterns, and the characteristics of intact families with children of different age groups. The report concludes with recommendations for real estate developers, emphasizing the importance of understanding market needs, effective communication, and building business alliances to address the changing demands of the Australian housing market. It underscores the need for developers to stay informed about local market conditions and adapt their strategies accordingly.

Running head: MARKET RESEARCH
Market Research
Market Research
Secure Best Marks with AI Grader
Need help grading? Try our AI Grader for instant feedback on your assignments.

MARKET RESEARCH 2
Table of Contents
1. Introduction.............................................................................................................................................3
2. The research Process...............................................................................................................................3
2.1. Define the Problem...............................................................................................................................3
2.2. Planning the research design.................................................................................................................3
2.3. Planning the sample..............................................................................................................................3
2.4 Collecting the data.................................................................................................................................4
2.5 Analysing the Data................................................................................................................................6
3. Formulating conclusions..........................................................................................................................8
References.................................................................................................................................................10

MARKET RESEARCH 3
1. Introduction
In current times, real estate developer is facing issues due to transforming requirements of
households and families. It is identified that high amount of people is immigrating as well as,
there is not adequate housing related to providing supply to everyone. Hence, prices are gaining
in real estate sectors. Secondary information would be utilised for collecting information about
family characteristics in the context of Australia.
2. The research Process
2.1. Define the Problem
SKY HIGH Real Estate Developers is making efforts for comprehending the existing structure
regarding households and families with respect to Australia. Therefore, market research is
essential to comprehend the issues. Along with this, real estate developers are emphasizing on
understands the ways for transforming the structure within next 20 years. It would also permit
them to make plan for type of properties that is in demand in current scenarios as well as, in
future (Grant, 2016).
2.2. Planning the research design
In this research, qualitative research design would be executed for addressing the research issue
related to real estate business. The qualitative research design would be executed for increasing
the theoretical information related to research issues. The secondary information could be
captured through relevant sources like family websites and characteristics related to Australian
bureau of statistics. The current publication was developed in the year of 2015 and it was entitled
as 4442.0 family characteristics as well as, transition in the context of Australia (Pemsel, Müller,
and Söderlund, 2016).
2.3. Planning the sample

MARKET RESEARCH 4
Information was collected via families and households associated with Australia. The
information was related to time duration of 2012-13. It is beneficial to capture the authentic
information associated with the research. It is effective for gathering the information regarding
the employment status associated with parents (Rogers, Lee, and Yan, 2015).
2.4 Collecting the data
The provided information was collected through sources of secondary tools. It is depicted as
provided below:
Language, top responses (other
than English)
Australia % 2011 %
Mandarin 596,711 2.5 336,410 1.6
Arabic 321,728 1.4 287,174 1.3
Cantonese 280,943 1.2 263,673 1.2
Vietnamese 277,400 1.2 233,390 1.1
Italian 271,597 1.2 299,833 1.4
English only spoken at home 17,020,417 72.7 16,509,291 76.8
Households where a non
English language is spoken
1,971,011 22.2 1,591,908 20.5
(Sources: ABS, 2019).
Religious affiliation, top
responses
Australia % 2011 %
No Religion, so described 6,933,708 29.6 4,693,162 21.8
Catholic 5,291,834 22.6 5,439,267 25.3
Anglican 3,101,185 13.3 3,679,907 17.1
Not stated 2,238,735 9.6 1,972,252 9.2
Uniting Church 870,183 3.7 1,065,794 5.0
(Sources: ABS, 2019).
Employment - hours workedEmployed people aged 15 years and over
Australia % 2011 %
1-15 hours per week 1,218,823 11.4 1,087,799 10.8
16-24 hours per week 1,079,236 10.1 947,792 9.4
25-34 hours per week 1,193,445 11.2 1,027,379 10.2
Secure Best Marks with AI Grader
Need help grading? Try our AI Grader for instant feedback on your assignments.

MARKET RESEARCH 5
35-39 hours per week 2,031,263 19.0 1,808,878 18.0
40 hours or more per week 4,591,801 43.0 4,558,678 45.3
(Sources: ABS, 2019).
People — employment
EmploymentPeople who reported being in the labor
force, aged 15 years and over
Australia % 2011 %
Worked full-time 6,623,065 57.7 6,367,555 59.7
Worked part-time 3,491,503 30.4 3,062,977 28.7
Away from work 569,276 5.0 627,798 5.9
Unemployed 787,452 6.9 600,134 5.6
(Sources: ABS, 2019).

MARKET RESEARCH 6
(Sources: ABS, 2019).
OccupationEmployed people aged 15 years and over
Australia % 2011 %
Professionals 2,370,966 22.2 2,145,442 21.3
Clerical and Administrative Workers 1,449,681 13.6 1,483,559 14.7
Technicians and Trades Workers 1,447,414 13.5 1,425,146 14.2
Managers 1,390,047 13.0 1,293,970 12.9
Community and Personal Service Workers 1,157,003 10.8 971,898 9.7
Labourers 1,011,520 9.5 947,608 9.4
Sales Workers 1,000,955 9.4 942,140 9.4
Machinery Operators and Drivers 670,106 6.3 659,551 6.6
(Sources: ABS, 2019).
2.5 Analysing the Data
From collected data, it is assessed that all families has resident children whose age is 0 to 17
years within period of 2012-13. In addition to this, 19% of participants fall under single parent as
well as, 81% of participants come under couple families. Moreover, high amount of single parent
as well as, couple families live associatively during 2006 to 2007 (Jagarajan, et. al., 2017).
(Sources: ABS, 2019).
OccupationEmployed people aged 15 years and over
Australia % 2011 %
Professionals 2,370,966 22.2 2,145,442 21.3
Clerical and Administrative Workers 1,449,681 13.6 1,483,559 14.7
Technicians and Trades Workers 1,447,414 13.5 1,425,146 14.2
Managers 1,390,047 13.0 1,293,970 12.9
Community and Personal Service Workers 1,157,003 10.8 971,898 9.7
Labourers 1,011,520 9.5 947,608 9.4
Sales Workers 1,000,955 9.4 942,140 9.4
Machinery Operators and Drivers 670,106 6.3 659,551 6.6
(Sources: ABS, 2019).
2.5 Analysing the Data
From collected data, it is assessed that all families has resident children whose age is 0 to 17
years within period of 2012-13. In addition to this, 19% of participants fall under single parent as
well as, 81% of participants come under couple families. Moreover, high amount of single parent
as well as, couple families live associatively during 2006 to 2007 (Jagarajan, et. al., 2017).

MARKET RESEARCH 7
Alone parent families were predominately alone as compared to mother families. In addition,
about 16% of all families fall under 0 to 17 years as compared to alone father families. In such
manner, approximate 3% of all families have children as well as, whose age falls under 0 to 17
years (Kuns, Visser, & Wästfelt, 2016).
Along with this, these facts are associated with lone father as well as, mother families that are
moderately constant within duration of 2006 and 2007. Moreover, all couple families have
occupant children such as dependent as well as independent children. In addition, couple of
families have young individual and whose age comes amongst 0 to 14 year. It has developed
high proportion such as 34%. In opposed to this, youngest children comes under 0 to 4 years was
about 16% and it is also related to single parent families (Hillary, 2017). It is evaluated large
amount of single parent families has focused on those who are youngest inhabitant as well as,
whose age comes under 25 years as well as, it is more than 23%. In addition to this, only 9% of
people considers in couple of families in context of same age-group (ABS, 2019).
It is addressed that intact families were related to those who have adopted children as well as,
considers inherent children along with, has both parents. In such family, step children were not
found. These families have children with the age of 0 to 1 years. In the context of youngest
resident, 0 to 17 years of children were found. In addition to this, intact couple family has 0 to 4
years like 81% (ABS, 2019).
It is evaluated that intact families that has older occupant children were minimum with respect to
families together with, 0 to 17 years age of children was found. In such manner, youngest child
with age of 5 to 9 years as well as, 72% of people was of integral family. This is all associated
with family that have children whose age under 0 to 17 years together with youngest child have
age among 10 to 14 years were 68% of individuals belongs to intact families. At the same time,
Paraphrase This Document
Need a fresh take? Get an instant paraphrase of this document with our AI Paraphraser

MARKET RESEARCH 8
families that have children with the age of 0 to 17 years as well as, youngest children with the
age among 15 to 17 years. Moreover, there are 60% families that are intact (ABS, 2019).
3. Formulating conclusions
From the above discussion, it can be summarised that real estate developers are facing the issues
because of transforming the demand related to households and families. It is addressed that sky
high real estate developers can understand the current structure with respect to families and
households in the nation of Australia.
Qualitative research design will be implemented to identify the research concern regarding
developers of real estate. The secondary facts and figures could be gathered by reliable sources
like searching family characteristics, and websites of Australian bureau of statistics.
It could be recommended that developers of real estate could understand the market with needs
and wants of consumers. It could be time consuming with respect to developers for
systematically gain understanding regarding the local atmospheres. This can lead for making the
connection to experts into local environment. In addition to this, real estate developers could
identify the proficient agent with developing the business alliance where a person can alerts to
real estate business in the context of prime commercial land. It is beneficial for supporting and
demonstrating the parameters related to market (Kimberly & Bouchikhi, 2016).
Real estate developers can emphasize on practicing effective communication. They should learn
regarding the ways to communicate through some technique together with, focuses on diverse
people. Respect is significant for demonstrating the project via attainment. In addition, real estate
developers can effectively interact about requirements and expectation to accomplish the project.
Remaining of communication is significant to learn regarding manners for listening to others

MARKET RESEARCH 9
while they have need for communication and worries. It is vital for always demonstrating others
real estate developers that opens for hearing via around them (Janda, et. al., 2016).
while they have need for communication and worries. It is vital for always demonstrating others
real estate developers that opens for hearing via around them (Janda, et. al., 2016).

MARKET RESEARCH 10
References
ABS. 2019. 2016 Census QuickStats. [Online]. Available at:
https://quickstats.censusdata.abs.gov.au/census_services/getproduct/census/2016/quickstat/036
(Accessed: 23 August 2019).
ABS. 2019. 4442.0 - Family Characteristics and Transitions, Australia, 2012-13. [Online].
Available at: https://www.abs.gov.au/ausstats/abs@.nsf/mf/4442.0 (Accessed: 23 August 2019).
Grant, R.M., 2016. Contemporary strategy analysis: Text and cases edition. John Wiley & Sons.
Hillary, R. (2017). Small and medium-sized enterprises and the environment: business
imperatives. Routledge.
Jagarajan, R., Asmoni, M. N. A. M., Mohammed, A. H., Jaafar, M. N., Mei, J. L. Y., & Baba, M.
(2017). Green retrofitting–A review of current status, implementations and
challenges. Renewable and Sustainable Energy Reviews, 67, 1360-1368.
Janda, K. B., Bright, S., Patrick, J., Wilkinson, S., & Dixon, T. J. (2016). The evolution of green
leases: towards inter-organizational environmental governance. Building Research &
Information, 44(5-6), 660-674.
Kimberly, J. R., & Bouchikhi, H. (2016). Disruption on steroids: Sea change in the worlds of
higher education in general and business education in particular. Journal of Leadership &
Organizational Studies, 23(1), 5-12.
Kuns, B., Visser, O., & Wästfelt, A. (2016). The stock market and the steppe: The challenges
faced by stock-market financed, Nordic farming ventures in Russia and Ukraine. Journal of
Rural Studies, 45, 199-217.
Pemsel, S., Müller, R. and Söderlund, J., 2016. Knowledge governance strategies in project-
based organizations. Long Range Planning, 49(6), pp.648-660.
Secure Best Marks with AI Grader
Need help grading? Try our AI Grader for instant feedback on your assignments.

MARKET RESEARCH 11
Rogers, D., Lee, C.L. and Yan, D., 2015. The politics of foreign investment in Australian
housing: Chinese investors, translocal sales agents and local resistance. Housing Studies, 30(5),
pp.730-748.
Rogers, D., Lee, C.L. and Yan, D., 2015. The politics of foreign investment in Australian
housing: Chinese investors, translocal sales agents and local resistance. Housing Studies, 30(5),
pp.730-748.
1 out of 11
Related Documents

Your All-in-One AI-Powered Toolkit for Academic Success.
+13062052269
info@desklib.com
Available 24*7 on WhatsApp / Email
Unlock your academic potential
© 2024 | Zucol Services PVT LTD | All rights reserved.