Marketing Research Report: Uber's Performance in Australia
VerifiedAdded on  2023/01/11
|13
|1075
|68
Report
AI Summary
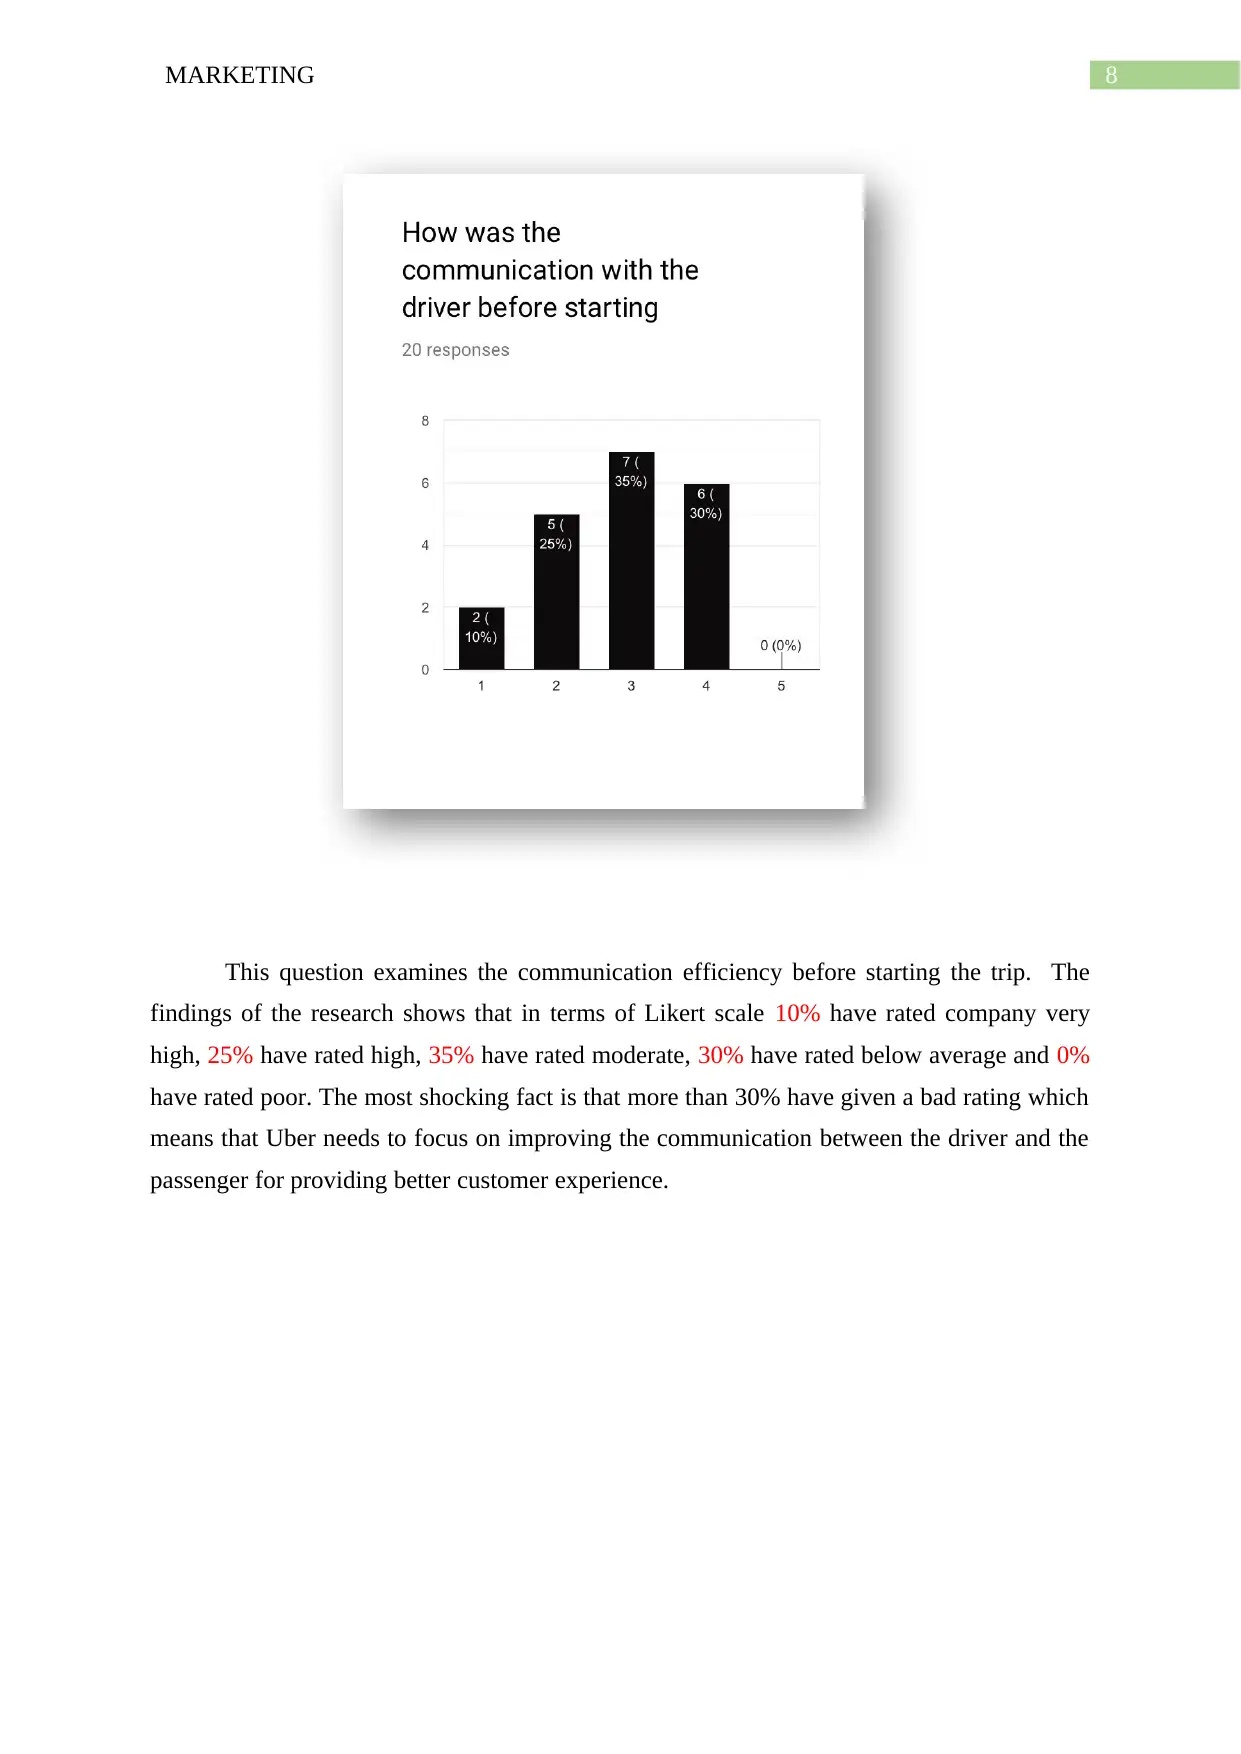
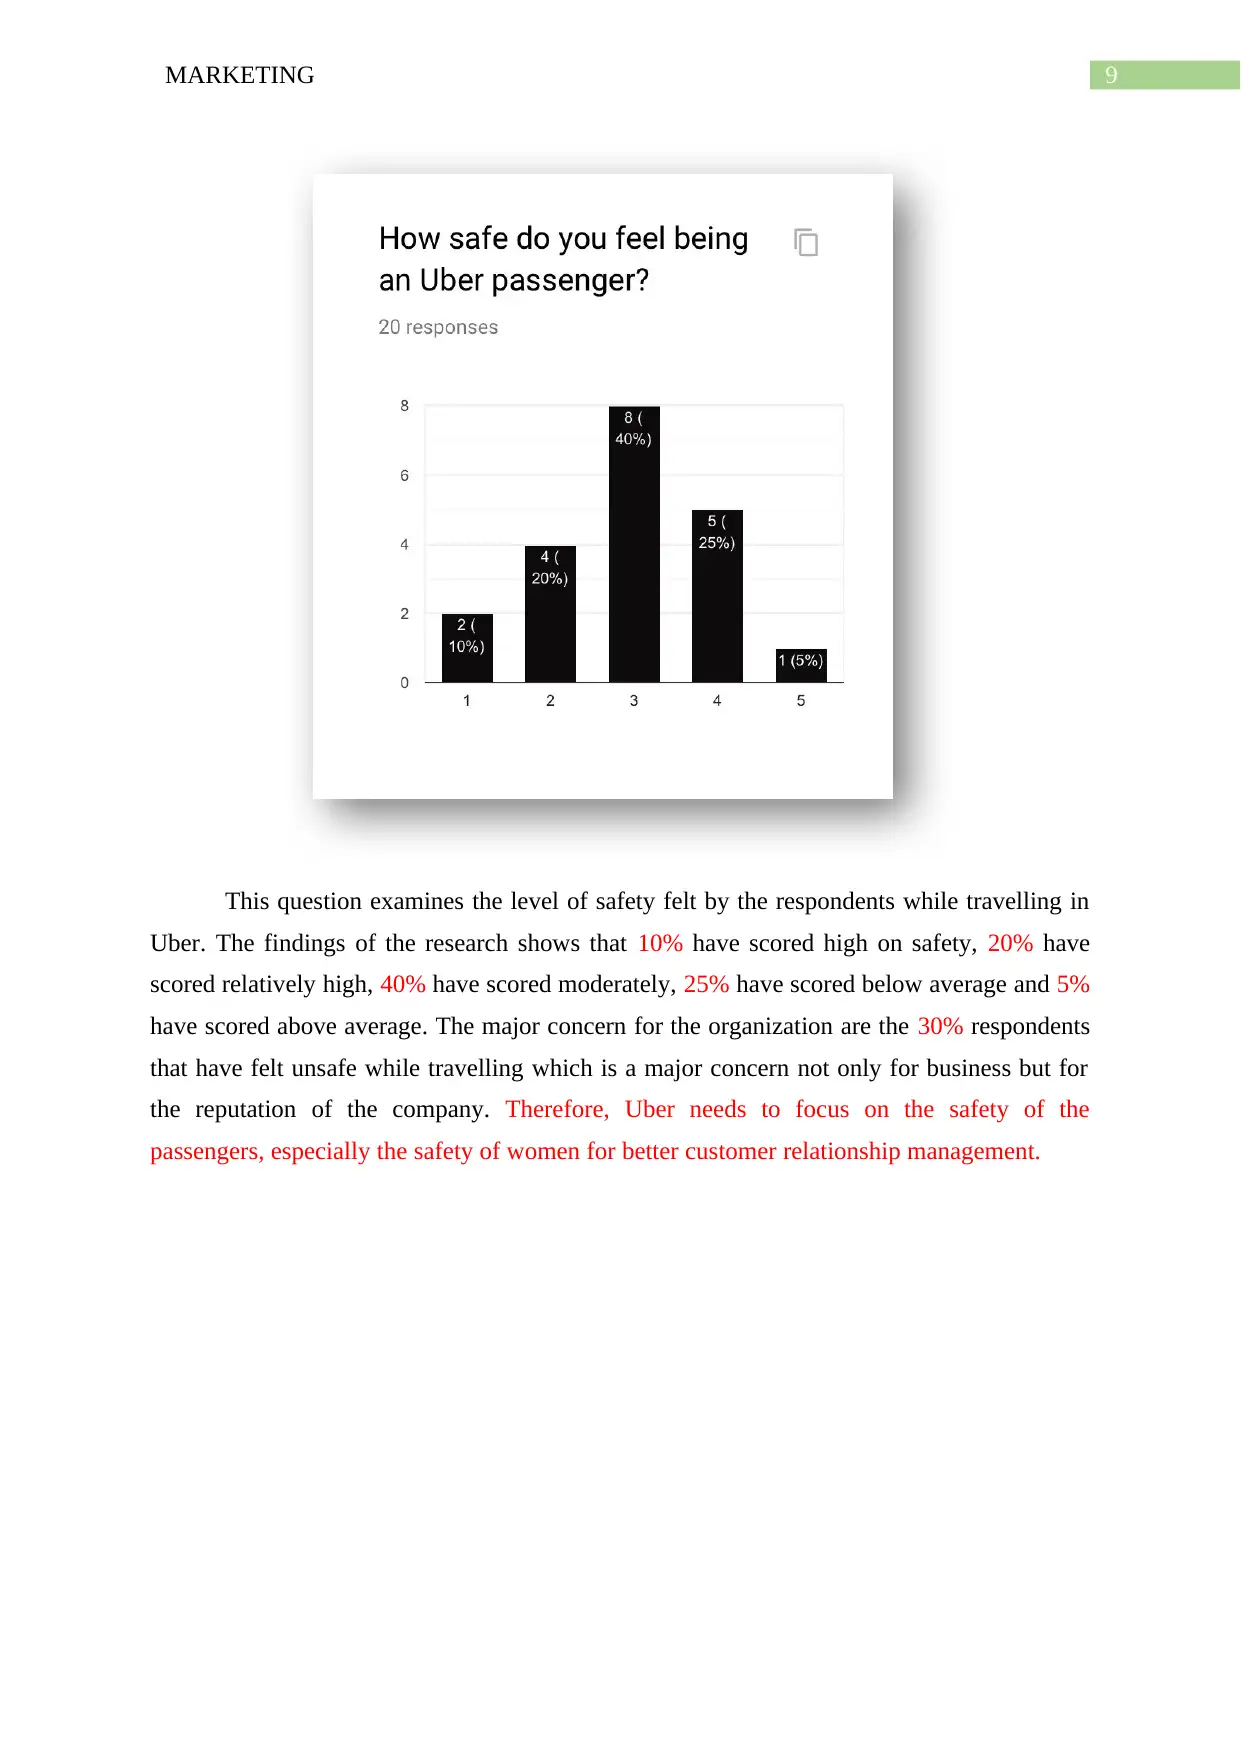
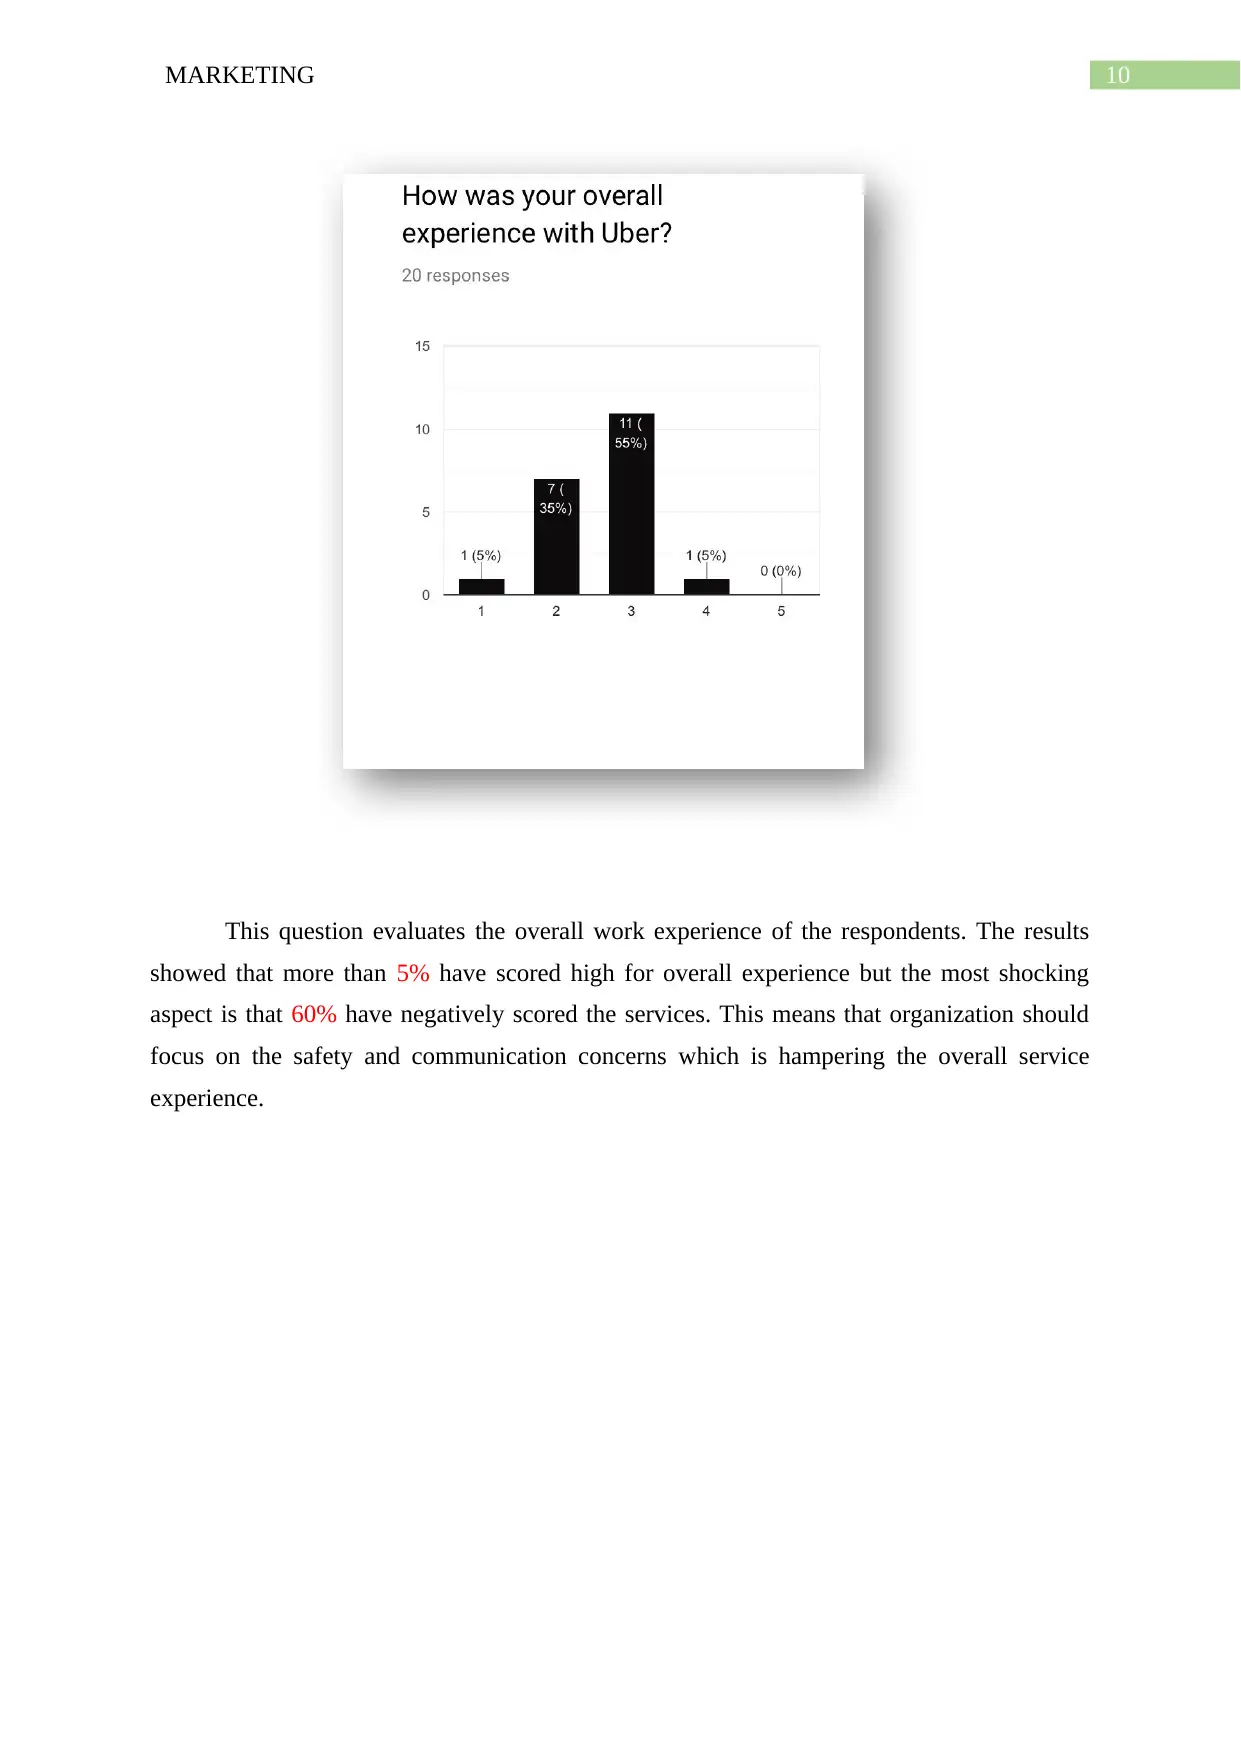
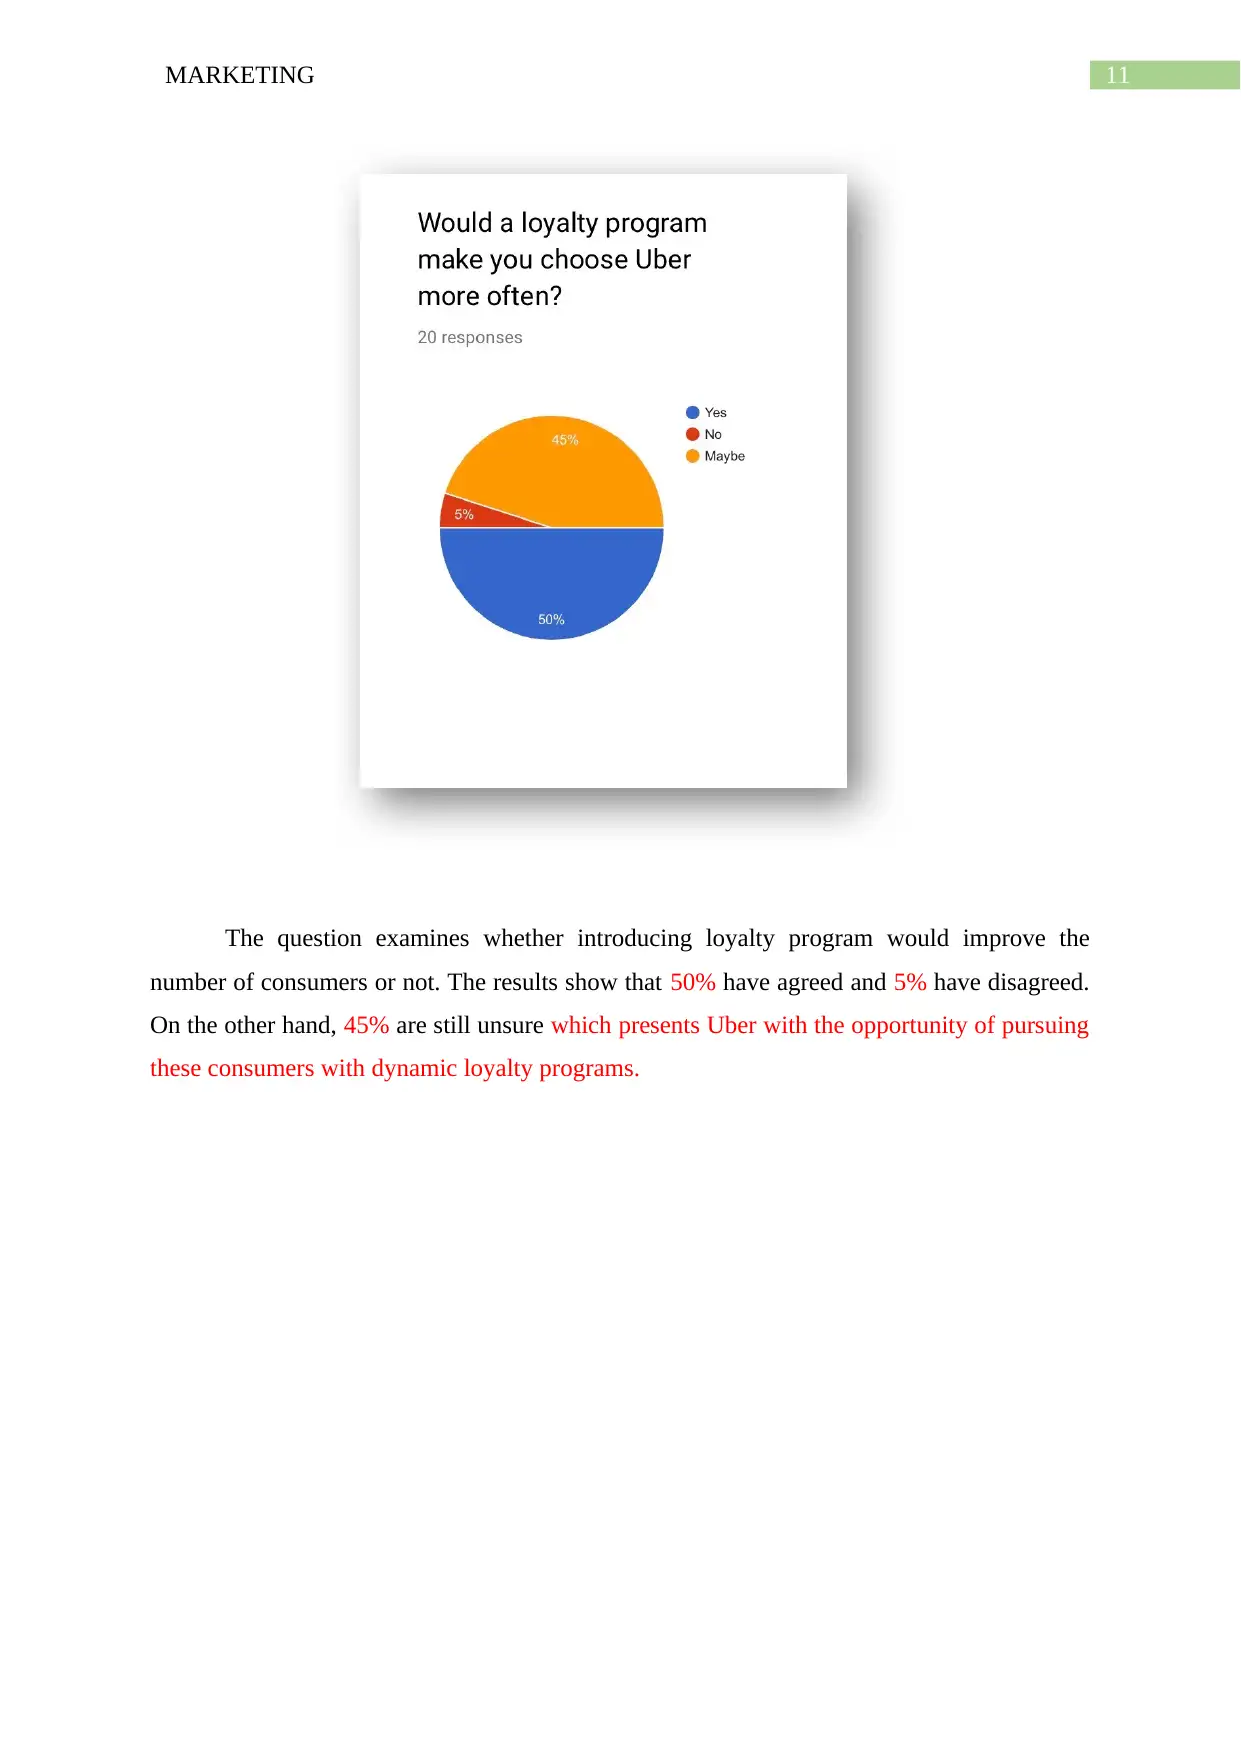
This report presents a comprehensive marketing analysis of Uber's performance in Australia, based on a survey examining customer demographics, employment status, and usage of ride-sharing services. The findings reveal that while Uber has a significant presence, there's room for improvement. Key areas of concern include customer satisfaction with communication and safety, with a considerable percentage of respondents reporting negative experiences. The research highlights the importance of addressing pricing, safety, and driver training to enhance customer experience and foster loyalty. The report also identifies key competitors like Ola and Taxis, emphasizing the need for Uber to develop strategies to compete effectively. Recommendations include implementing loyalty programs, improving communication, and enhancing safety measures to increase customer retention and market share. The research also covers the key areas of concern like pricing, safety and better drivers to improve overall service experience.

Running head: MARKETING
Marketing
Name of the student
Name of the university
Author note
Marketing
Name of the student
Name of the university
Author note
Paraphrase This Document
Need a fresh take? Get an instant paraphrase of this document with our AI Paraphraser

1MARKETING
Findings and Analysis
4.1 Data
This question examines the age of the respondents taking part in the survey and the
findings of the research shows that 35% belong to the age group of 20-22 years, 50% belong
to the age group of 17-19 years and 15% belong to age group of 23-25 years. This shows that
there is diversity in the age group of respondents and are able to provide better understanding
of the collected data.

2MARKETING
This question examines the employment status of the respondents taking part in the
survey and the findings of the research shows that 40% respondents are full time employees,
30% are unemployed and 30% are part time employees. This shows that a considerable
amount of population in the Y generation are unemployed so Uber needs to offer reasonable
prices to these consumers. It also implies that only 40% of the total consumers have the
ability to afford Uber on a regular basis.
⊘ This is a preview!⊘
Do you want full access?
Subscribe today to unlock all pages.

Trusted by 1+ million students worldwide

3MARKETING
This question examines whether the respondents have travelled with uber or not. The
results are shocking because even though Uber has been able to expand their business to
diver countries and continents, there are 10% consumers in Australia that have never availed
the service of the company. It is essential to analyse in detail the various reasons for not using
the services of Uber.
Paraphrase This Document
Need a fresh take? Get an instant paraphrase of this document with our AI Paraphraser

4MARKETING
The previous question determined that 10% of the respondents have never availed the
services of Uber. This questions whether these consumers would like to try out Uber services
or not. The result show that 65% of the respondents have given a positive response, 25% are
still in dilemma but effective strategies for the companies can win them over. However, the
remaining 10% that are not willing to try Uber at all should be evaluated to highlight their
travelling characteristics and reason for their choice.

5MARKETING
The purpose of the question is to evaluate whether the respondents have availed other
ride services or not. The findings of the research shows that 95% have used other ride sharing
services but there are still 5% respondents that have not availed other ride share services. This
shows that Uber has not been able to keep their loyal consumers which is reason that repeat
purchasing is less in Australia. Uber should focus on the 5% loyal consumers and develop
long lasting relationship to gain supremacy and competitive advantage in the market.
⊘ This is a preview!⊘
Do you want full access?
Subscribe today to unlock all pages.

Trusted by 1+ million students worldwide

6MARKETING
This questions highlights the rival companies that have provided services to the
respondents. The results show that 55% have travelled in Ola, 45% have travelled in taxi and
none have travelled in taxify. This shows that other services are also gaining popularity
making the market competition more intense than before. This shows that Ola and Taxis are
the major rivals of Uber in Australia and they need to develop strategies to compete with
them.
Paraphrase This Document
Need a fresh take? Get an instant paraphrase of this document with our AI Paraphraser

7MARKETING
The question aims to identify the various reasons due to which the respondents have
availed the services offered by other ride share services. The findings of the study shows that
40% find other services convenient, 55% feel that others provide the best prices among the
ride share companies in the market and 5% think that other ride share are safer especially for
women. This shows that other companies are offering better prices and value for money to
these consumers which is the reason that have switched to availing services of these ride
share companies.

8MARKETING
This question examines the communication efficiency before starting the trip. The
findings of the research shows that in terms of Likert scale 10% have rated company very
high, 25% have rated high, 35% have rated moderate, 30% have rated below average and 0%
have rated poor. The most shocking fact is that more than 30% have given a bad rating which
means that Uber needs to focus on improving the communication between the driver and the
passenger for providing better customer experience.
⊘ This is a preview!⊘
Do you want full access?
Subscribe today to unlock all pages.

Trusted by 1+ million students worldwide

9MARKETING
This question examines the level of safety felt by the respondents while travelling in
Uber. The findings of the research shows that 10% have scored high on safety, 20% have
scored relatively high, 40% have scored moderately, 25% have scored below average and 5%
have scored above average. The major concern for the organization are the 30% respondents
that have felt unsafe while travelling which is a major concern not only for business but for
the reputation of the company. Therefore, Uber needs to focus on the safety of the
passengers, especially the safety of women for better customer relationship management.
Paraphrase This Document
Need a fresh take? Get an instant paraphrase of this document with our AI Paraphraser

10MARKETING
This question evaluates the overall work experience of the respondents. The results
showed that more than 5% have scored high for overall experience but the most shocking
aspect is that 60% have negatively scored the services. This means that organization should
focus on the safety and communication concerns which is hampering the overall service
experience.

11MARKETING
The question examines whether introducing loyalty program would improve the
number of consumers or not. The results show that 50% have agreed and 5% have disagreed.
On the other hand, 45% are still unsure which presents Uber with the opportunity of pursuing
these consumers with dynamic loyalty programs.
⊘ This is a preview!⊘
Do you want full access?
Subscribe today to unlock all pages.

Trusted by 1+ million students worldwide
1 out of 13
Related Documents

Your All-in-One AI-Powered Toolkit for Academic Success.
 +13062052269
info@desklib.com
Available 24*7 on WhatsApp / Email
Unlock your academic potential
Copyright © 2020–2025 A2Z Services. All Rights Reserved. Developed and managed by ZUCOL.