Corporate Finance Analysis: Marks and Spencer's Financial Strategies
VerifiedAdded on 2020/10/23
|14
|4358
|235
Report
AI Summary
This report provides a comprehensive analysis of Marks and Spencer's corporate finance strategies. It begins by calculating the cost of equity using the Capital Asset Pricing Model (CAPM), providing a foundational understanding of the expenses associated with acquiring equity finance. The report then delves into determining the ungeared equity beta to derive the company's asset beta, assessing the risk factors inherent in the company's assets. Furthermore, it examines the dividend policy of Marks and Spencer through an analysis of relevant financial ratios over a five-year period, evaluating the company's approach to shareholder returns. The report concludes by comparing the CAPM-derived cost of equity with the dividend growth model, assessing their suitability for investment appraisal. The appendices include detailed calculations for cost of equity, asset beta, and the ratios used to evaluate the dividend policy, offering a complete and insightful examination of Marks and Spencer's financial decision-making processes. The report is designed to provide insights into the financial strategies of the company and how they contribute to value creation for shareholders.
CORPORATE FINANCE
Paraphrase This Document
Need a fresh take? Get an instant paraphrase of this document with our AI Paraphraser
Table of Contents
INTRODUCTION...........................................................................................................................1
MAIN BODY ..................................................................................................................................1
a) Calculation of cost of equity by CAPM Model .................................................................1
b) Ungeared equity beta for deriving company's asset beta...................................................3
c) Appropriate ratios of Marks and Spencer of 5 years for dividend policy .........................4
d) CAPM – Derived cost of equity finance is suitable for investment appraisal process or
dividend growth model is reliable .........................................................................................6
CONCLUSION ...............................................................................................................................7
Appendix..........................................................................................................................................9
1. Calculation of cost of equity ..............................................................................................9
2. Ungeared equity beta into asset beta .................................................................................9
Calculation of ratios to identify the dividend policy ...........................................................10
INTRODUCTION
Corporate finance is the areas of finance that is consider with capital structure, sources of
findings etc. to create value for the shareholders. This assignment will include Marks and
Spencer which is involved in the retail industry and provide clothing for the men, women and
kids in different regions. Marks and Spencer are having a global presence and it provide its
products and services in different areas to gain more market share and enhance their profitability
level. In this study, it will determine the cost of equity finance on the basis of Capital assets
pricing model. Moreover, it will include equity beta to derive company's assets beta.
Furthermore, it will contain information regarding ratios to discuss the dividend policy of the
Marks and Spencer. The cost of equity provide understanding to the organisation regarding the
expenses which are required by the firm for acquiring the equity finance. Moreover, it assists in
making decision regarding which source of financing can be acquired by the organisation for
increasing the return and getting the finance at least price.
MAIN BODY
a) Calculation of cost of equity by CAPM Model
Capital asset pricing model is used to determine the required rate of return of an asset. It
predicts the relationship between the risk of an asserts and its expected returns. Cost of equity is
related to determining the cost of equity finance. With the help of cost of equity marks and
Spencer is able to make decision regarding these sources of funding to acquire for their operation
on the basis of cost of equity it will be able to understand the rate of return profitable for the
business.
Capital asset pricing model require three information which consist of rate of return, beta value
and the risk-free rate.
Calculation enclosed in appendix
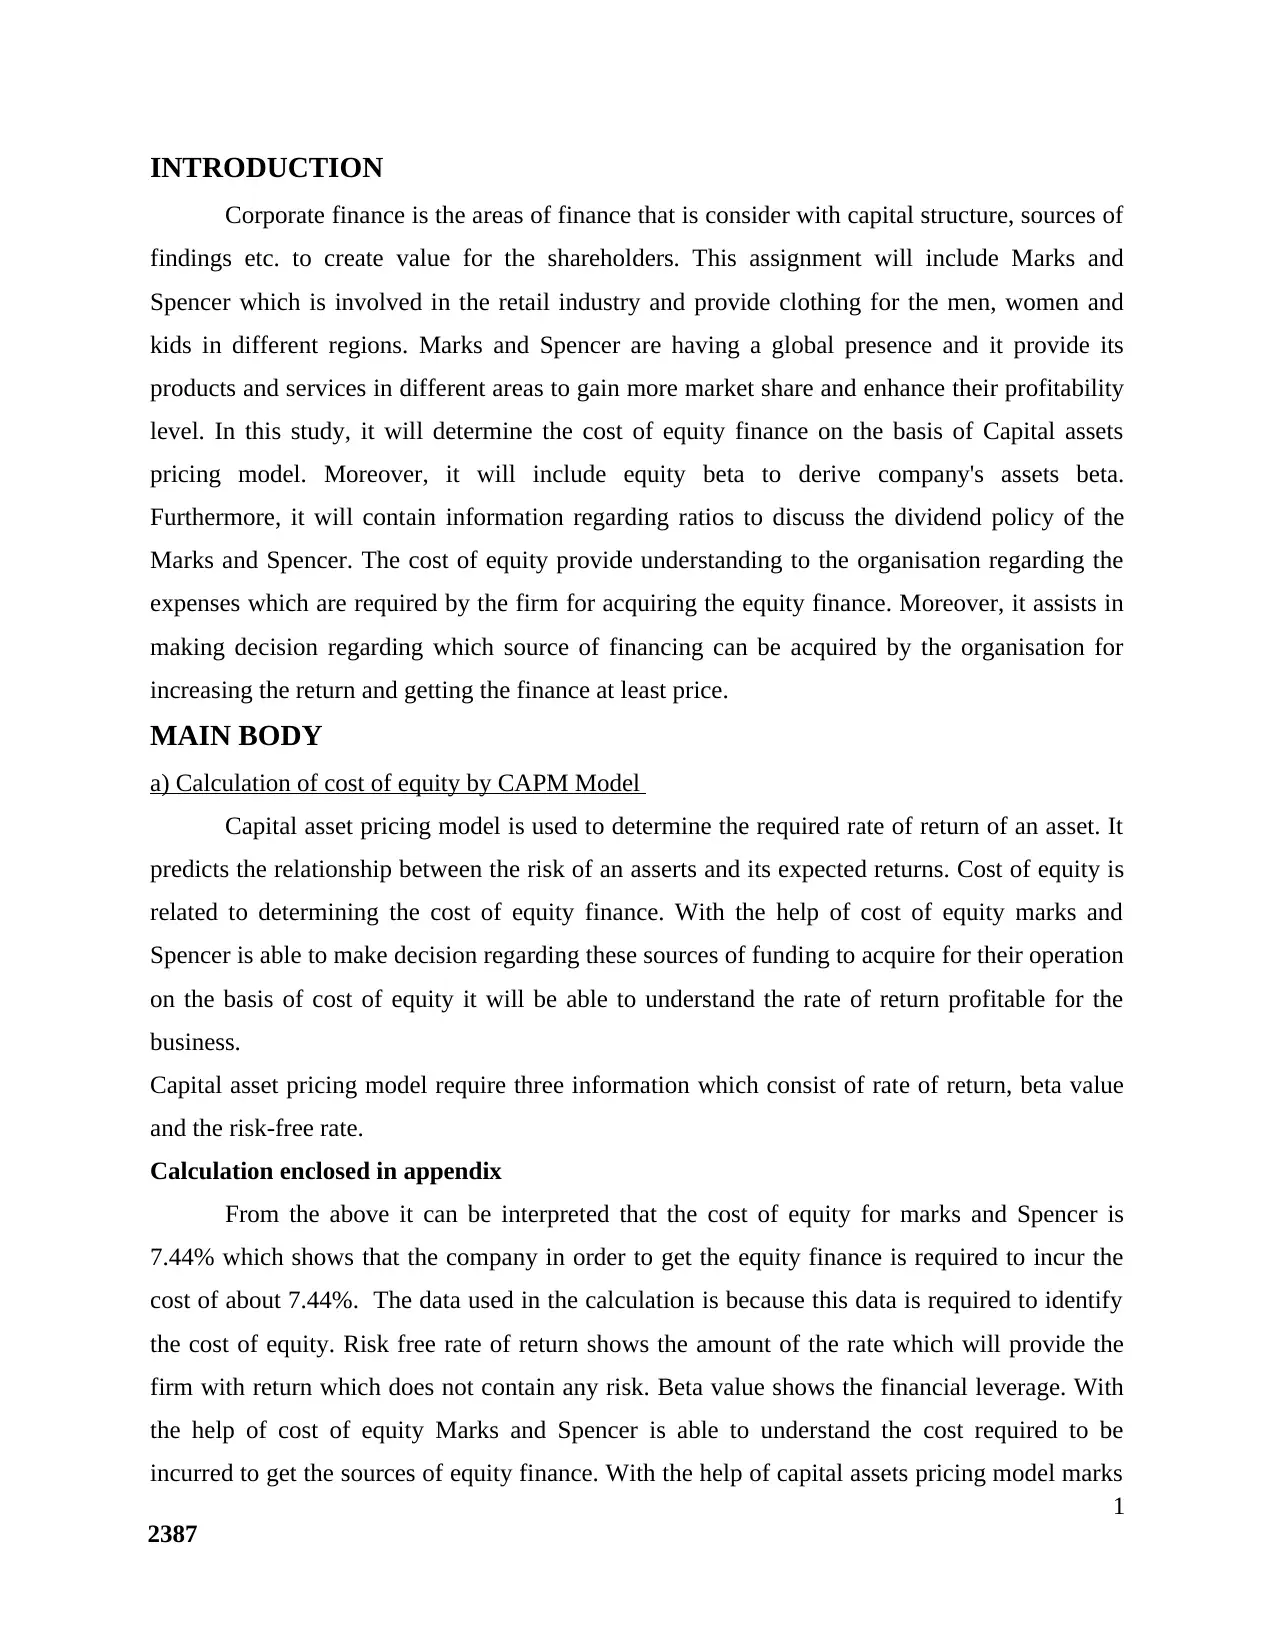
From the above it can be interpreted that the cost of equity for marks and Spencer is
7.44% which shows that the company in order to get the equity finance is required to incur the
cost of about 7.44%. The data used in the calculation is because this data is required to identify
the cost of equity. Risk free rate of return shows the amount of the rate which will provide the
firm with return which does not contain any risk. Beta value shows the financial leverage. With
the help of cost of equity Marks and Spencer is able to understand the cost required to be
incurred to get the sources of equity finance. With the help of capital assets pricing model marks
1
2387
Corporate finance is the areas of finance that is consider with capital structure, sources of
findings etc. to create value for the shareholders. This assignment will include Marks and
Spencer which is involved in the retail industry and provide clothing for the men, women and
kids in different regions. Marks and Spencer are having a global presence and it provide its
products and services in different areas to gain more market share and enhance their profitability
level. In this study, it will determine the cost of equity finance on the basis of Capital assets
pricing model. Moreover, it will include equity beta to derive company's assets beta.
Furthermore, it will contain information regarding ratios to discuss the dividend policy of the
Marks and Spencer. The cost of equity provide understanding to the organisation regarding the
expenses which are required by the firm for acquiring the equity finance. Moreover, it assists in
making decision regarding which source of financing can be acquired by the organisation for
increasing the return and getting the finance at least price.
MAIN BODY
a) Calculation of cost of equity by CAPM Model
Capital asset pricing model is used to determine the required rate of return of an asset. It
predicts the relationship between the risk of an asserts and its expected returns. Cost of equity is
related to determining the cost of equity finance. With the help of cost of equity marks and
Spencer is able to make decision regarding these sources of funding to acquire for their operation
on the basis of cost of equity it will be able to understand the rate of return profitable for the
business.
Capital asset pricing model require three information which consist of rate of return, beta value
and the risk-free rate.
Calculation enclosed in appendix
From the above it can be interpreted that the cost of equity for marks and Spencer is
7.44% which shows that the company in order to get the equity finance is required to incur the
cost of about 7.44%. The data used in the calculation is because this data is required to identify
the cost of equity. Risk free rate of return shows the amount of the rate which will provide the
firm with return which does not contain any risk. Beta value shows the financial leverage. With
the help of cost of equity Marks and Spencer is able to understand the cost required to be
incurred to get the sources of equity finance. With the help of capital assets pricing model marks
1
2387
⊘ This is a preview!⊘
Do you want full access?
Subscribe today to unlock all pages.
Trusted by 1+ million students worldwide

and Spencer is able to calculate its cost of equity which will provide understanding about the
expenses to be incurred for getting the equity financing (Marks and Spencer Group PLC
(MKS.L), 2018). With the help of cost of equity calculated the Marks and Spencer can make
decision regarding the source of financing whether to get the equity finance of debt financing.
The market rate of return is the rate at which the equity finance is available in the
market. Cost of equity is required to be determined because with the help of this information
Marks and Spencer is able to make decision regarding which source of finance can be acquired
bat less cost. The capital assets pricing model is useful in determining the cost of capital because
it is an easy method and also it require less information for the calculation of cost of equity. So,
it can be justified that the cost of equity is 7.44% which shows that Marks and Spencer will be
required to incur this much cost in order to get the equity financing. Capital assets pricing model
is most effective way of calculating the equity financing as it helps in identifying accurate
information regarding the cost of equity which is beneficial for the firm in understanding the
nature of the equity (Dang, Li, Z and Yang, 2018).
The information included in this formula for calculating the cost of capital is relevant
because for identifying the cost of equity it is required to understand the market rate of return
because without this rate the firm is not able to make comparison between the return which are
more profitable for business (Foley and Manova, 2015). With the help of risk-free rate of return
marks and Spencer will be able to understand the rate at which the firm will incur no losses as at
that rate their will no risk of return. The risk-free rate provide understanding about the rate at
which the returns are risk free. So, it can be said that the above data considered for calculation of
cost of equity is accurate and revenant for determining the cost of equity as per the capital asset
pricing method.
The cost of equity provide understanding to the organisation about the cost required by
marks and Spencer to get the equity financing. By using the capital assets pricing model Marks
and Spencer can determine the cost of equity by gathering the information from the financial
statement of Marks and Spencer. The cost of equity finance is required to understand because its
assist in identifying the most beneficial investment opportunity which have the less cost of
acquisition. The cost of equity helps in understanding about the cost which will be incurred by
the company for acquiring the equity finance.
2
2387
Paraphrase This Document
Need a fresh take? Get an instant paraphrase of this document with our AI Paraphraser
b) Ungeared equity beta for deriving company's asset beta
Equity beta is a measurement that compares the fluctuation in the prices of security over
the period of returns against those of the market. It measures that risk factors in getting the equity
financing and includes the impact of company's capital structure. Asset beta provide
understanding about the risk factor associated with the assets of the company. It includes the
risk of the company without debt so that it is helpful in making various decision regarding the
company's financial health. For identifying the asset beta, it is required to unlevered the beta that
means to remove the impact of debt.
Calculation enclosed in appendix
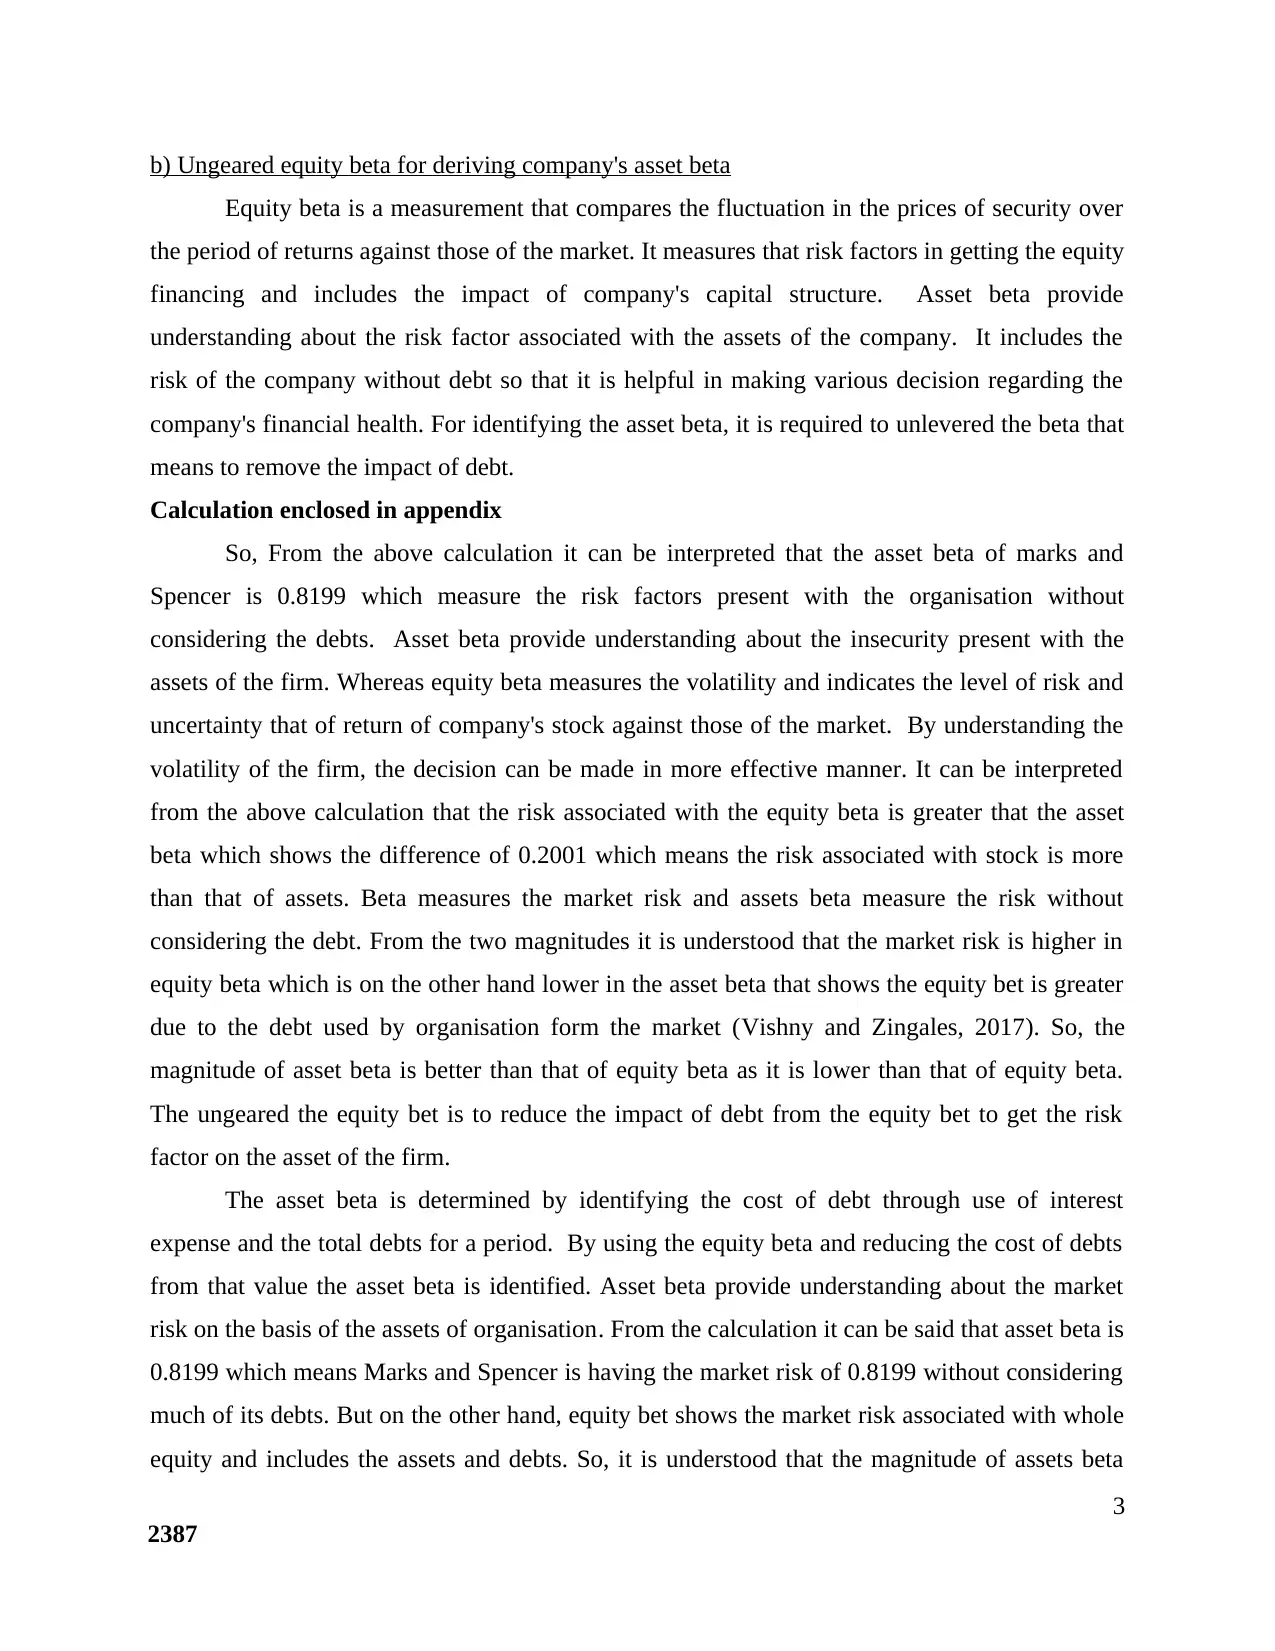
So, From the above calculation it can be interpreted that the asset beta of marks and
Spencer is 0.8199 which measure the risk factors present with the organisation without
considering the debts. Asset beta provide understanding about the insecurity present with the
assets of the firm. Whereas equity beta measures the volatility and indicates the level of risk and
uncertainty that of return of company's stock against those of the market. By understanding the
volatility of the firm, the decision can be made in more effective manner. It can be interpreted
from the above calculation that the risk associated with the equity beta is greater that the asset
beta which shows the difference of 0.2001 which means the risk associated with stock is more
than that of assets. Beta measures the market risk and assets beta measure the risk without
considering the debt. From the two magnitudes it is understood that the market risk is higher in
equity beta which is on the other hand lower in the asset beta that shows the equity bet is greater
due to the debt used by organisation form the market (Vishny and Zingales, 2017). So, the
magnitude of asset beta is better than that of equity beta as it is lower than that of equity beta.
The ungeared the equity bet is to reduce the impact of debt from the equity bet to get the risk
factor on the asset of the firm.
The asset beta is determined by identifying the cost of debt through use of interest
expense and the total debts for a period. By using the equity beta and reducing the cost of debts
from that value the asset beta is identified. Asset beta provide understanding about the market
risk on the basis of the assets of organisation. From the calculation it can be said that asset beta is
0.8199 which means Marks and Spencer is having the market risk of 0.8199 without considering
much of its debts. But on the other hand, equity bet shows the market risk associated with whole
equity and includes the assets and debts. So, it is understood that the magnitude of assets beta
3
2387
Equity beta is a measurement that compares the fluctuation in the prices of security over
the period of returns against those of the market. It measures that risk factors in getting the equity
financing and includes the impact of company's capital structure. Asset beta provide
understanding about the risk factor associated with the assets of the company. It includes the
risk of the company without debt so that it is helpful in making various decision regarding the
company's financial health. For identifying the asset beta, it is required to unlevered the beta that
means to remove the impact of debt.
Calculation enclosed in appendix
So, From the above calculation it can be interpreted that the asset beta of marks and
Spencer is 0.8199 which measure the risk factors present with the organisation without
considering the debts. Asset beta provide understanding about the insecurity present with the
assets of the firm. Whereas equity beta measures the volatility and indicates the level of risk and
uncertainty that of return of company's stock against those of the market. By understanding the
volatility of the firm, the decision can be made in more effective manner. It can be interpreted
from the above calculation that the risk associated with the equity beta is greater that the asset
beta which shows the difference of 0.2001 which means the risk associated with stock is more
than that of assets. Beta measures the market risk and assets beta measure the risk without
considering the debt. From the two magnitudes it is understood that the market risk is higher in
equity beta which is on the other hand lower in the asset beta that shows the equity bet is greater
due to the debt used by organisation form the market (Vishny and Zingales, 2017). So, the
magnitude of asset beta is better than that of equity beta as it is lower than that of equity beta.
The ungeared the equity bet is to reduce the impact of debt from the equity bet to get the risk
factor on the asset of the firm.
The asset beta is determined by identifying the cost of debt through use of interest
expense and the total debts for a period. By using the equity beta and reducing the cost of debts
from that value the asset beta is identified. Asset beta provide understanding about the market
risk on the basis of the assets of organisation. From the calculation it can be said that asset beta is
0.8199 which means Marks and Spencer is having the market risk of 0.8199 without considering
much of its debts. But on the other hand, equity bet shows the market risk associated with whole
equity and includes the assets and debts. So, it is understood that the magnitude of assets beta
3
2387

found for marks and Spencer is beneficial than that of equity beta (Rocheteau, Wright and
Zhang, 2018). So, with the help of equity beta and assets beta Marks and Spencer is able to
understand the difference between the risk associated with equity and without debts which will
help the firm in making decision regarding the equity funding other source of finance for their
operations.
c) Appropriate ratios of Marks and Spencer of 5 years for dividend policy
Dividend policy of the company is the set of guidelines used by the company on the basis
of which the earning of the shareholders is decided. The shareholders of marks and Spencer on
the basis of the dividend policy of company are able to understand the earning which will be
provided to them. The following are the ratios which are calculated on the basis of the financial
statement of Marks and Spencer. The dividend policy of the company assists in attracting more
customer towards the business which assist in increasing the capital of the business for
performing various business operations. With the help of dividend policy, the firm is able to
provide information to its shareholder regarding the return they are providing on the capital
invested by the shareholders.
calculation enclosed in appendix
From the information provided by the calculation it can be said that Marks and Spencer
is providing higher dividend over the years to its shareholders which means it has adopted the
increment dividend policy for its shareholders in which it provides the dividend higher in the
than the previous years to provide satisfaction to its shareholders it will make the shareholders
happy and assist in investing more in the company. With the help of above information which is
gathered from the financial statement it provided about the EPS and Dividend pay-out ratio.
The earning per share provided on the shares to the shareholders is the lowest in the years
which means the earning shown as per the ratio analysis it identified that the earning on per share
is decreasing over the years which means the earning on per share is reducing. But on the other
hand, the dividend pay-out ratio shows the increase in the amount paid to the shareholder over
the years which means the divined paid to the shareholders is increasing over the years. Dividend
pay-out ratio compares the dividend paid by the company to its earnings (Atanasov and Black,
2016). Dividend payout ratio show the relationship between dividend and earnings. The
dividend policy can be defined on the basis of this ratio as it describe the dividend which is paid
to shareholder from the earnings.
4
2387
⊘ This is a preview!⊘
Do you want full access?
Subscribe today to unlock all pages.
Trusted by 1+ million students worldwide
The dividend policy of Marks and Spencer is good as shown by the divined pay-out ratio
which show the divined paid out to the shareholder for increasing their wealth and assist in
retaining them in business for the future investment needs. By Satisfying the shareholders the
firm is able to motivate them to invest more in the future as it pays the higher dividend than the
other companies. Marks and Spencer through help of good dividend policy will attract the
potential shareholders towards the business and will enhance the investment to perform their
various business operations which is beneficial for the growth and success of the business. With
the help of attractive divided policy, the firm is able to attract the shareholders and can provided
them motivation to invest more in the business to increase their returns.
In the year 2014, Earning per share of the shareholders was 0.64 which shows that the
dividend policy of the company is not good as compares to the share prices as the shareholders
are provided with less divined. Also, it is decreasing over the period due to which the earning of
the shareholders is decreasing which is not beneficial for the company as well as shareholders.
The lower dividend means the company is not earning better due to which they are not able to
provide higher dividend to the shareholders (Finance, 2017). Also, the information provided by
the dividend pay-out ratio which shows the comparison between the earnings and dividend
which shows the dividend are provided more than the earning which means the company is
focusing on increasing shareholder's wealth.
The dividend policy assists in attracting the investors towards the brand which is useful
for getting the capital requirement to perform various operations. The dividend policy of Marks
and Spencer will help them in attracting more capital for performing its various activities. It is
required that the company should focus on increasing shareholder's wealth (Dang, Li and Yang,
2018). By using the dividend policy of the company, the investors are able to make decision
regarding investment in the business So, if the dividend policy of the organisation is better it will
attract the more investors for investing in the capital of the business whereas it will reduce the
investors if the firms is not paying good dividend to the shareholders.
The dividend policy of the company is provided by the calculation shows the number of
dividends provided by Marks and Spencer to the shareholders is increasing over the years which
means the dividend policy of the firm is incremental and is beneficial for attracting more
investors towards the firm.
5
2387
Paraphrase This Document
Need a fresh take? Get an instant paraphrase of this document with our AI Paraphraser
d) CAPM – Derived cost of equity finance is suitable for investment appraisal process or
dividend growth model is reliable
Capital asset pricing model is used for identifying the relationship between risk and the
expected return for assets and particularly it undertakes the stock. It is used to calculate the
required rate of return on risky assets. Whereas dividend growth model is based on the current
value of the stock shares on the total future value of their dividends. Capital asset pricing model
is more effective which is been used in the (Part a) because it takes into consideration the factors
which are required to understand the cost of finance. CAPM model is effective to use for
calculating the cost of equity as it takes into consideration the risk factor and market rate of
return to determine the cost of equity. The dividend growth model is effective for calculating the
intrinsic value of stock exclusive of current market conditions. The capital asset pricing model is
best suited for calculating the cost of equity. The capital asset pricing model is a widely used
return model that is easily calculated, and stress tested. Capital assets pricing model take into
consideration systematic risk which is not considered in another model such as dividend growth
model. Market risk is an important variable because it is unforeseen and for that reason, often
cannot be completely mitigated.
Moreover, this model provides useful outcome than the dividend growth model which
means using this model for calculating the cost of equity is beneficial then using the dividend
growth model. Also, the dividend growth model does not take into account non-dividend factors.
This model is based on the assumptions that the company's growth rate is stable. So, it can be
said that the capital assets pricing model is best suited for the calculation of cost of equity. By
using the capital asset pricing model, it will assist in identifying the cost of equity which means
the shareholders required rate of return on the equity investment (Fracassi, 2016). It is the rate
which is earning by putting the money into a different investment with equal risk. The capital
asset pricing method is suitable for company investment appraisal process as it provides more
relevant information that the dividend discount rate.
With the help of cost of equity derived through capital asset pricing model. It will assist
in making effective decision regarding the investment based on the cost of equity to identify the
cost associated with the equity finance. By using the capital asset pricing model will assist in
identifying the information regarding the investment and the risk associated with the investment.
6
2387
By using the capital asset pricing model which will help in identifying the best area for the
investment which will provide higher return on the basis of cost of equity.
The capital assets pricing model will assist in making the investment process easier and
identify the areas which will provided higher return. The capital asset pricing model will be
calculating the accurate information regarding the risk associated with the investment to make
the investment and choosing the lowest risk areas for investment (Ehrhardt and Brigham, 2016).
Dividend growth model is not accurate as it is based on assumptions and dopes not identify the
risk associated with the investment its only focus in identifying the growth in the dividend for the
shareholders. The calculation of the marks and Spencer shows the dividend paid by the company
for the 5 years which shows that the dividend paid by the company are increasing over the years
which means they are focusing on increasing the shareholder wealth.
CONCLUSION
From the above study it has concluded about the current cost of equity which is derived
as 7.44% which means the cost of acquiring the equity finance is this percentage. The company
has used the capital asset pricing model for calculating the cost of equity as it is the most
effective method to identify the cost of equity because it also considers the risk factor associated
with the cost of equity finance. Moreover, with the help of financial ratios it has been identified
that the dividend policy of Marks and Spencer is goof as shown by the dividend pay-out ratio
which shows increment in the dividend over the years. By using the financial statement of Marks
and Spencer it is identified that the earning per share is decreasing over the years which is not
good for the company as well as shareholders. Moreover, it has concluded that there is another
model which is dividend growth model that is considered for the company's investment appraisal
processes because it does not consider the risk factor associated with the investment.
7
2387
⊘ This is a preview!⊘
Do you want full access?
Subscribe today to unlock all pages.
Trusted by 1+ million students worldwide
REFERENCES
Dang, C., Li, Z.F. and Yang, C., 2018. Measuring firm size in empirical corporate finance.
Journal of Banking & Finance. 86. pp.159-176.
Rocheteau, G., Wright, R. and Zhang, C., 2018. Corporate finance and monetary policy.
American Economic Review. 108(4-5). pp.1147-86.
Damodaran, A., 2016. Damodaran on valuation: security analysis for investment and corporate
finance (Vol. 324). John Wiley & Sons.
Ehrhardt, M. C. and Brigham, E. F., 2016. Corporate finance: A focused approach. Cengage
learning.
Fracassi, C., 2016. Corporate finance policies and social networks. Management Science, 63(8),
pp.2420-2438.
Dang, C., Li, Z. F. and Yang, C., 2018. Measuring firm size in empirical corporate
finance. Journal of Banking & Finance. 86. pp.159-176.
Finance, C., 2017. Empirical Corporate Finance. A Cap. 1.
Atanasov, V. A. and Black, B. S., 2016. Shock-based causal inference in corporate finance and
accounting research. Critical Finance Review. 5.pp.207-304.
Foley, C. F. and Manova, K., 2015. International trade, multinational activity, and corporate
finance. Economics. 7(1). pp.119-146.
Vishny, R. and Zingales, L., 2017. Corporate Finance. Journal of Political Economy. 125(6).
pp.1805-1812.
Online
Marks and Spencer Group PLC (MKS.L). 2018.[Online]. Available through
:<https://www.reuters.com/finance/stocks/overview/MKS.L>
Marks and Spencer Group PLC (MKS.BE). 2018.[Online].Available through
:<https://www.reuters.com/finance/stocks/financial-highlights/MKS.BE>
8
2387
Paraphrase This Document
Need a fresh take? Get an instant paraphrase of this document with our AI Paraphraser
Appendix
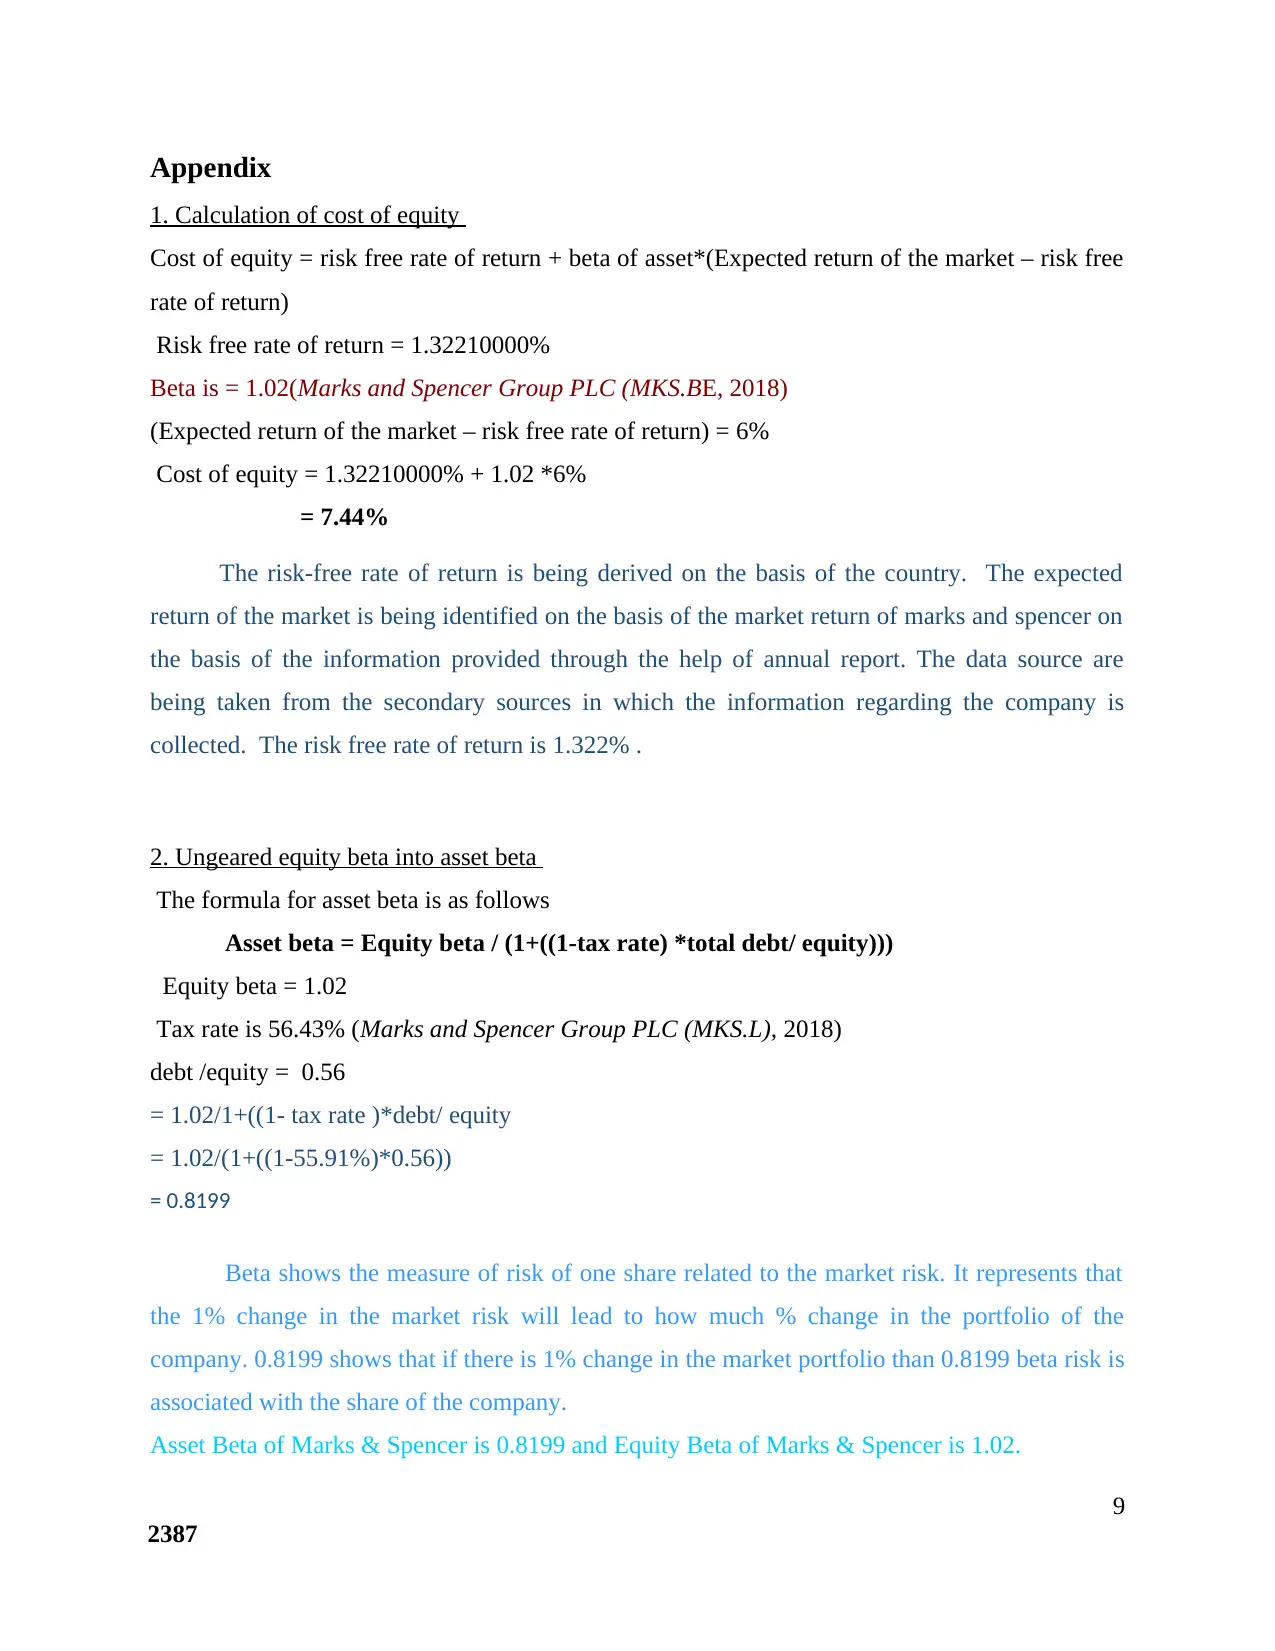
1. Calculation of cost of equity
Cost of equity = risk free rate of return + beta of asset*(Expected return of the market – risk free
rate of return)
Risk free rate of return = 1.32210000%
Beta is = 1.02(Marks and Spencer Group PLC (MKS.BE, 2018)
(Expected return of the market – risk free rate of return) = 6%
Cost of equity = 1.32210000% + 1.02 *6%
= 7.44%
The risk-free rate of return is being derived on the basis of the country. The expected
return of the market is being identified on the basis of the market return of marks and spencer on
the basis of the information provided through the help of annual report. The data source are
being taken from the secondary sources in which the information regarding the company is
collected. The risk free rate of return is 1.322% .
2. Ungeared equity beta into asset beta
The formula for asset beta is as follows
Asset beta = Equity beta / (1+((1-tax rate) *total debt/ equity)))
Equity beta = 1.02
Tax rate is 56.43% (Marks and Spencer Group PLC (MKS.L), 2018)
debt /equity = 0.56
= 1.02/1+((1- tax rate )*debt/ equity
= 1.02/(1+((1-55.91%)*0.56))
= 0.8199
Beta shows the measure of risk of one share related to the market risk. It represents that
the 1% change in the market risk will lead to how much % change in the portfolio of the
company. 0.8199 shows that if there is 1% change in the market portfolio than 0.8199 beta risk is
associated with the share of the company.
Asset Beta of Marks & Spencer is 0.8199 and Equity Beta of Marks & Spencer is 1.02.
9
2387
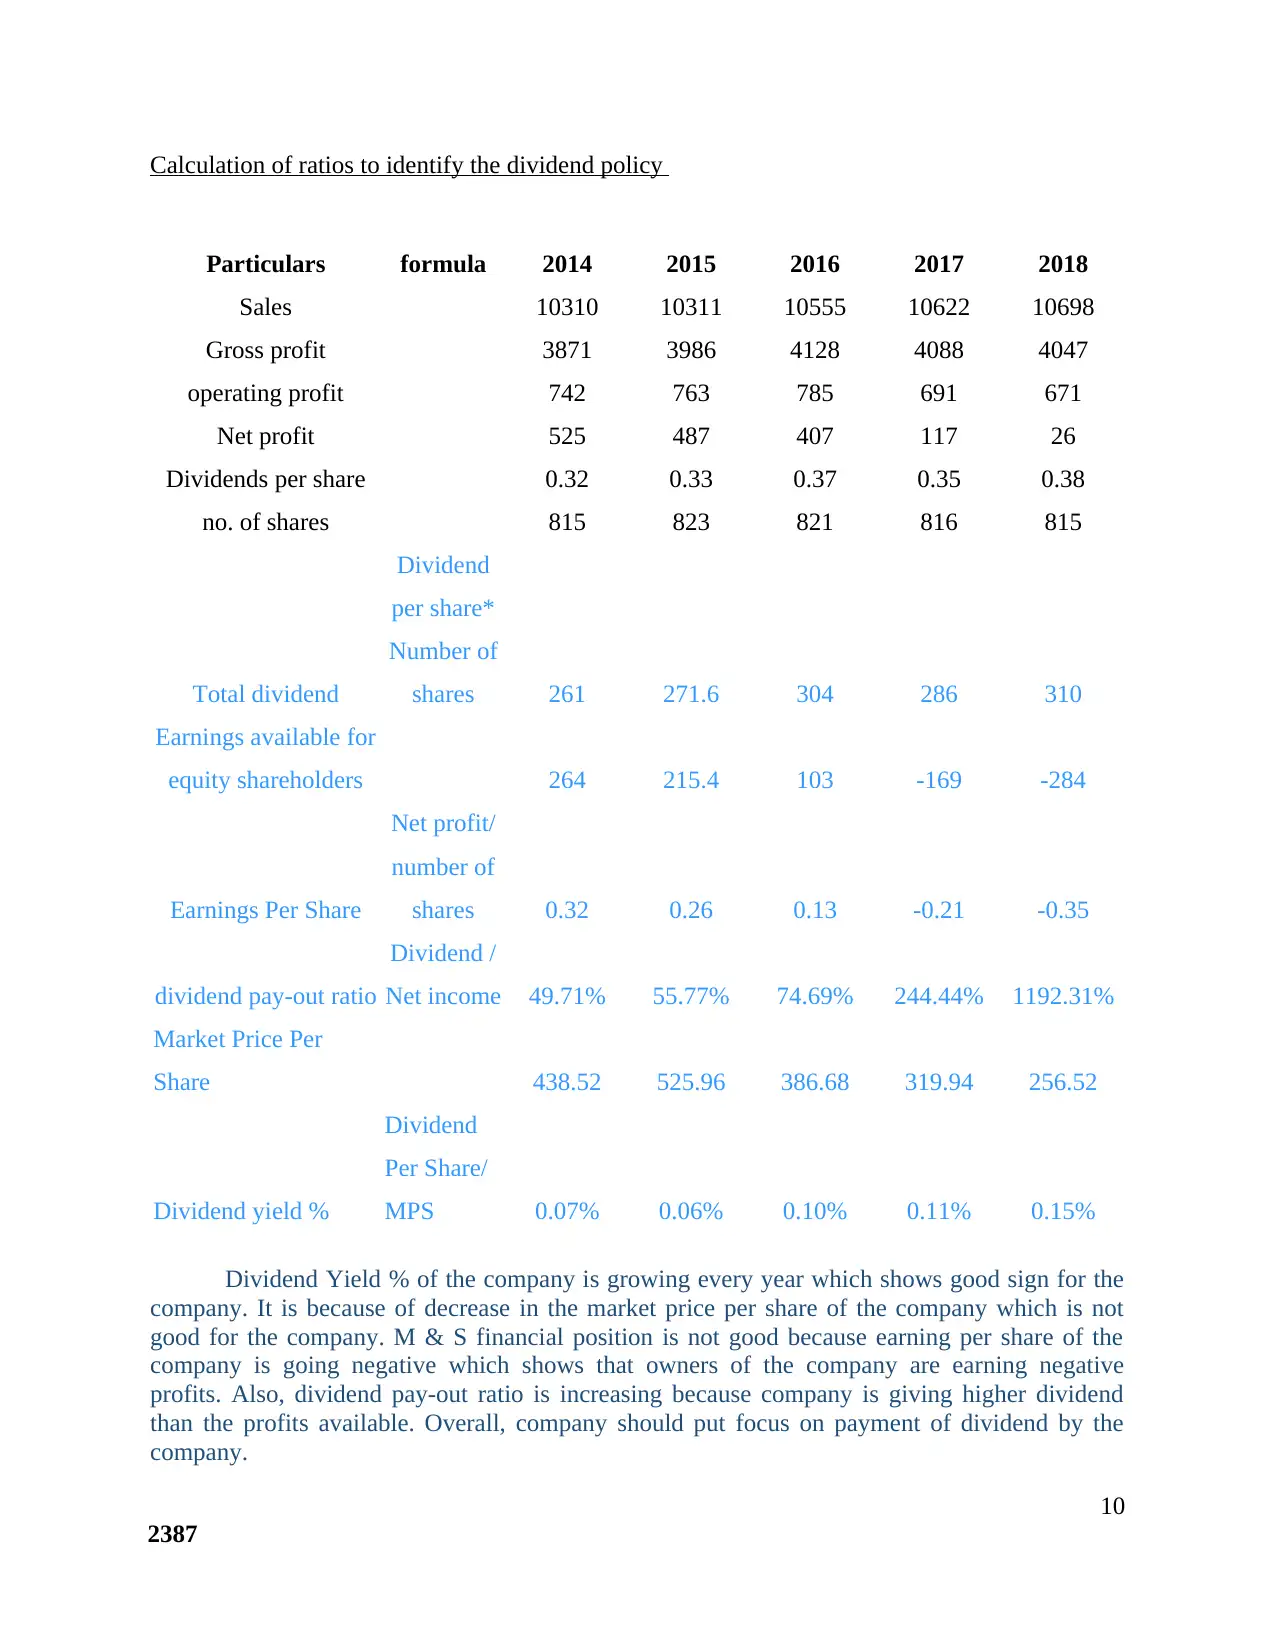
Calculation of ratios to identify the dividend policy
Particulars formula 2014 2015 2016 2017 2018
Sales 10310 10311 10555 10622 10698
Gross profit 3871 3986 4128 4088 4047
operating profit 742 763 785 691 671
Net profit 525 487 407 117 26
Dividends per share 0.32 0.33 0.37 0.35 0.38
no. of shares 815 823 821 816 815
Total dividend
Dividend
per share*
Number of
shares 261 271.6 304 286 310
Earnings available for
equity shareholders 264 215.4 103 -169 -284
Earnings Per Share
Net profit/
number of
shares 0.32 0.26 0.13 -0.21 -0.35
dividend pay-out ratio
Dividend /
Net income 49.71% 55.77% 74.69% 244.44% 1192.31%
Market Price Per
Share 438.52 525.96 386.68 319.94 256.52
Dividend yield %
Dividend
Per Share/
MPS 0.07% 0.06% 0.10% 0.11% 0.15%
Dividend Yield % of the company is growing every year which shows good sign for the
company. It is because of decrease in the market price per share of the company which is not
good for the company. M & S financial position is not good because earning per share of the
company is going negative which shows that owners of the company are earning negative
profits. Also, dividend pay-out ratio is increasing because company is giving higher dividend
than the profits available. Overall, company should put focus on payment of dividend by the
company.
10
2387
⊘ This is a preview!⊘
Do you want full access?
Subscribe today to unlock all pages.
Trusted by 1+ million students worldwide
1 out of 14
Related Documents


Your All-in-One AI-Powered Toolkit for Academic Success.
+13062052269
info@desklib.com
Available 24*7 on WhatsApp / Email
![[object Object]](/_next/static/media/star-bottom.7253800d.svg)
Unlock your academic potential
Copyright © 2020–2026 A2Z Services. All Rights Reserved. Developed and managed by ZUCOL.