Financial Analysis and Corporate Governance of Marks & Spencer Plc

Verified

Added on  2023/06/12

|18
|3922
|53
Report
AI Summary
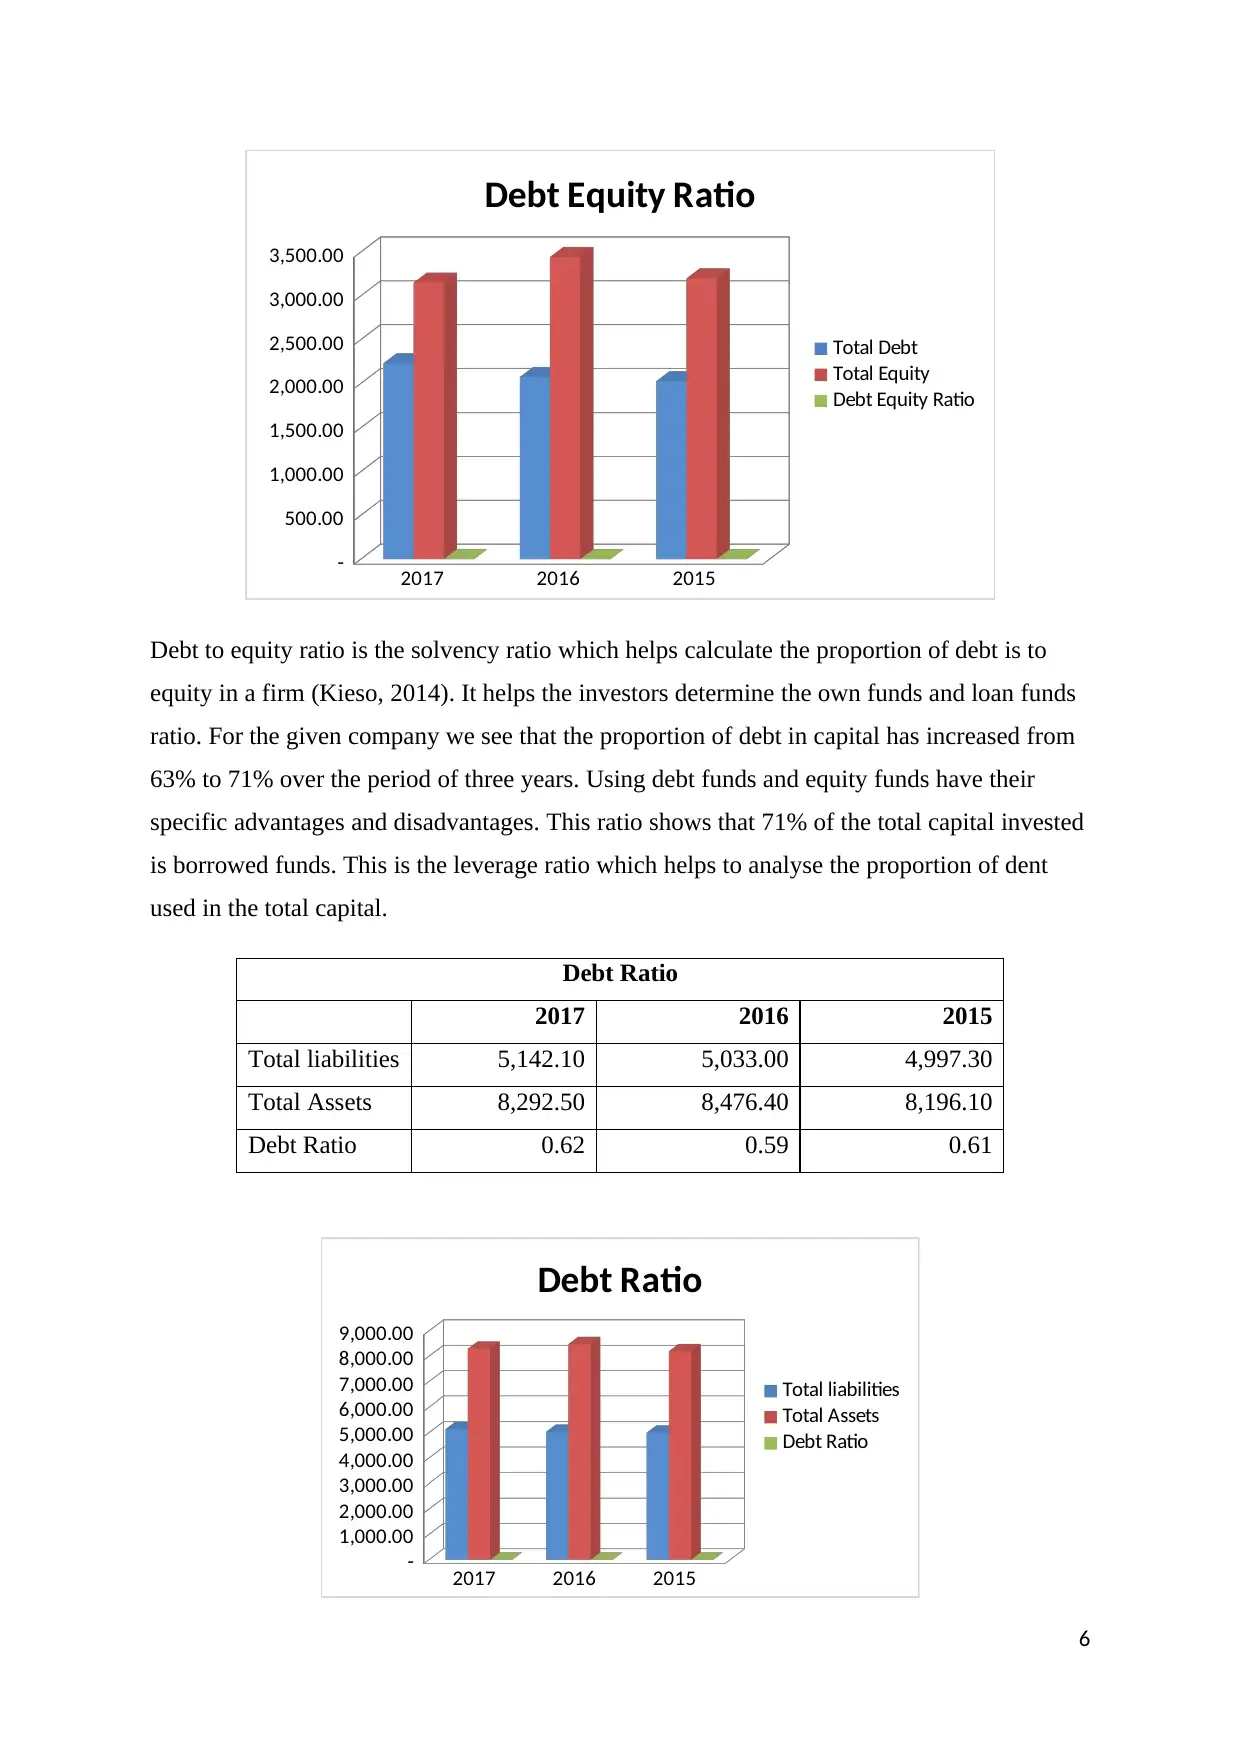
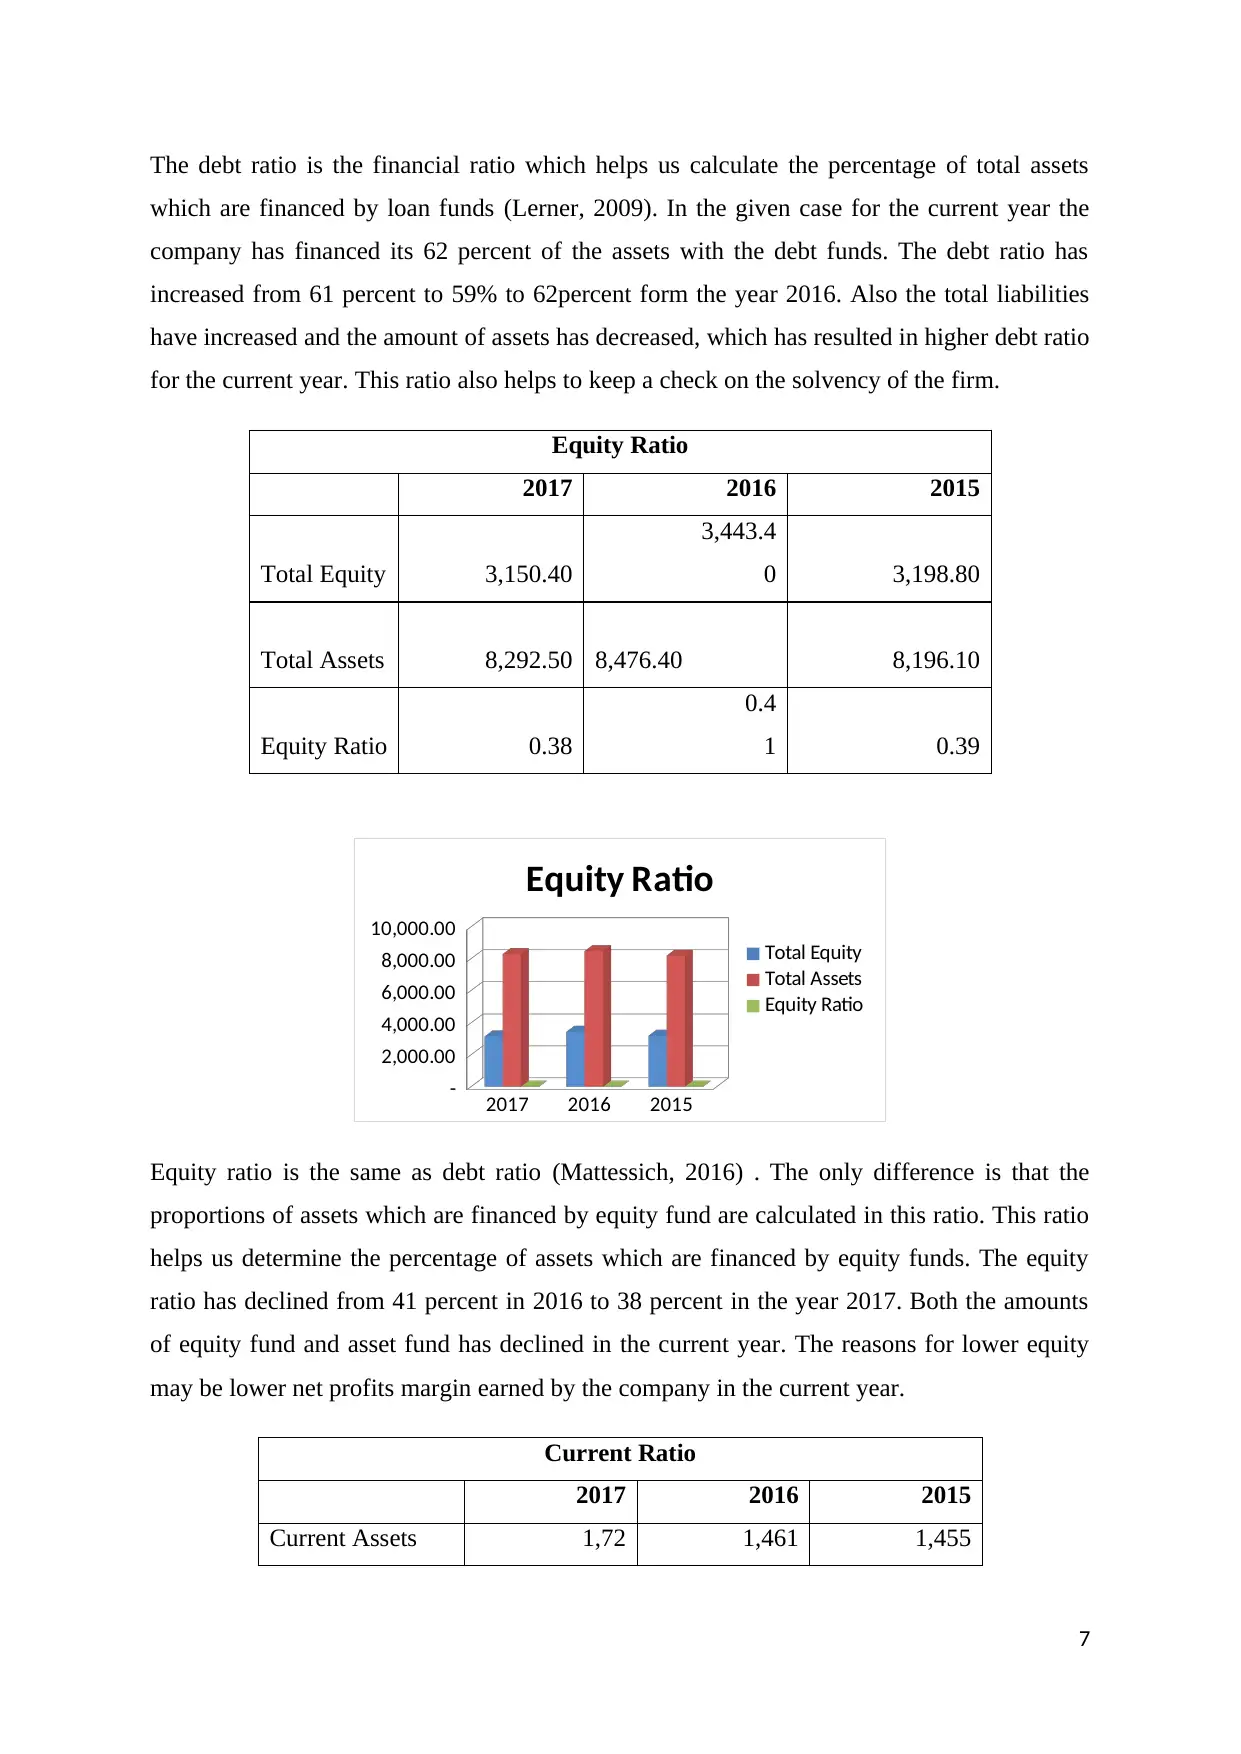
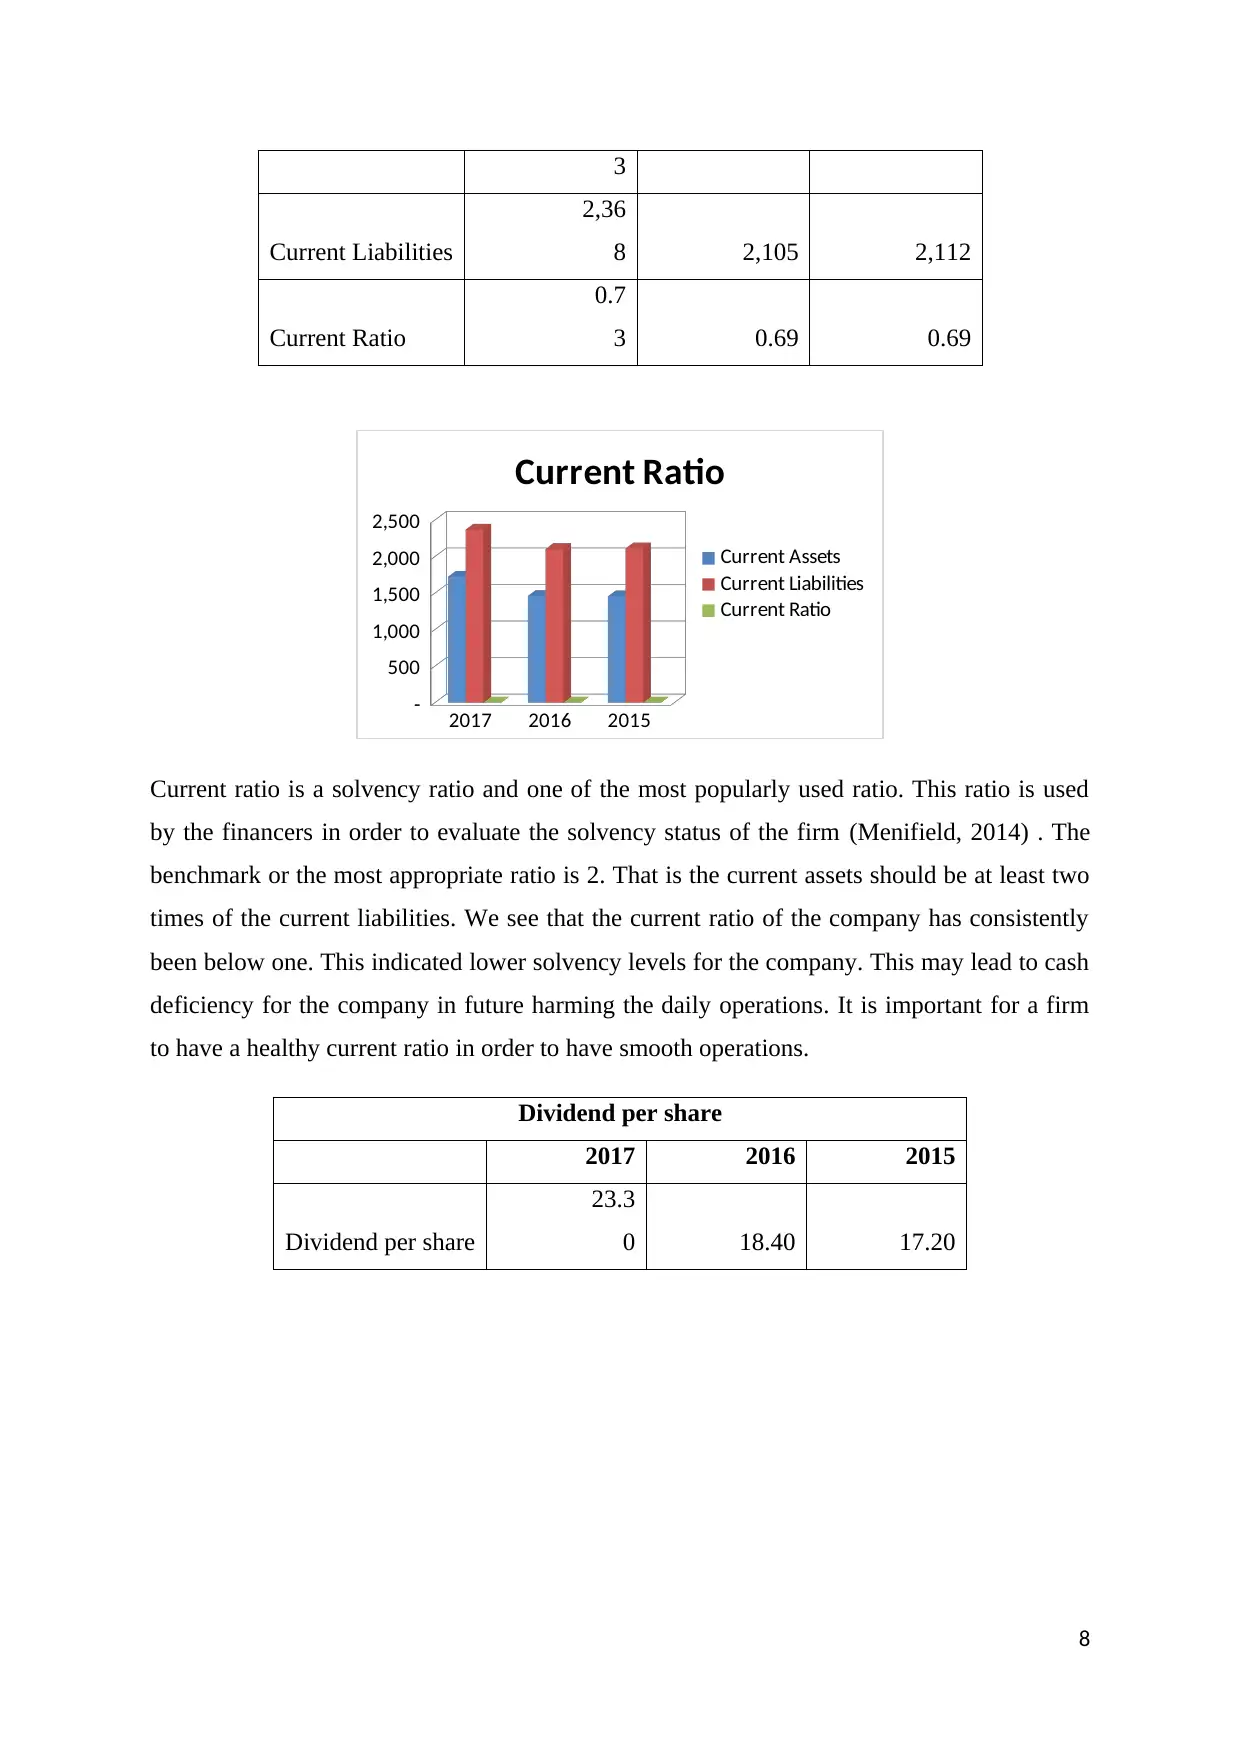
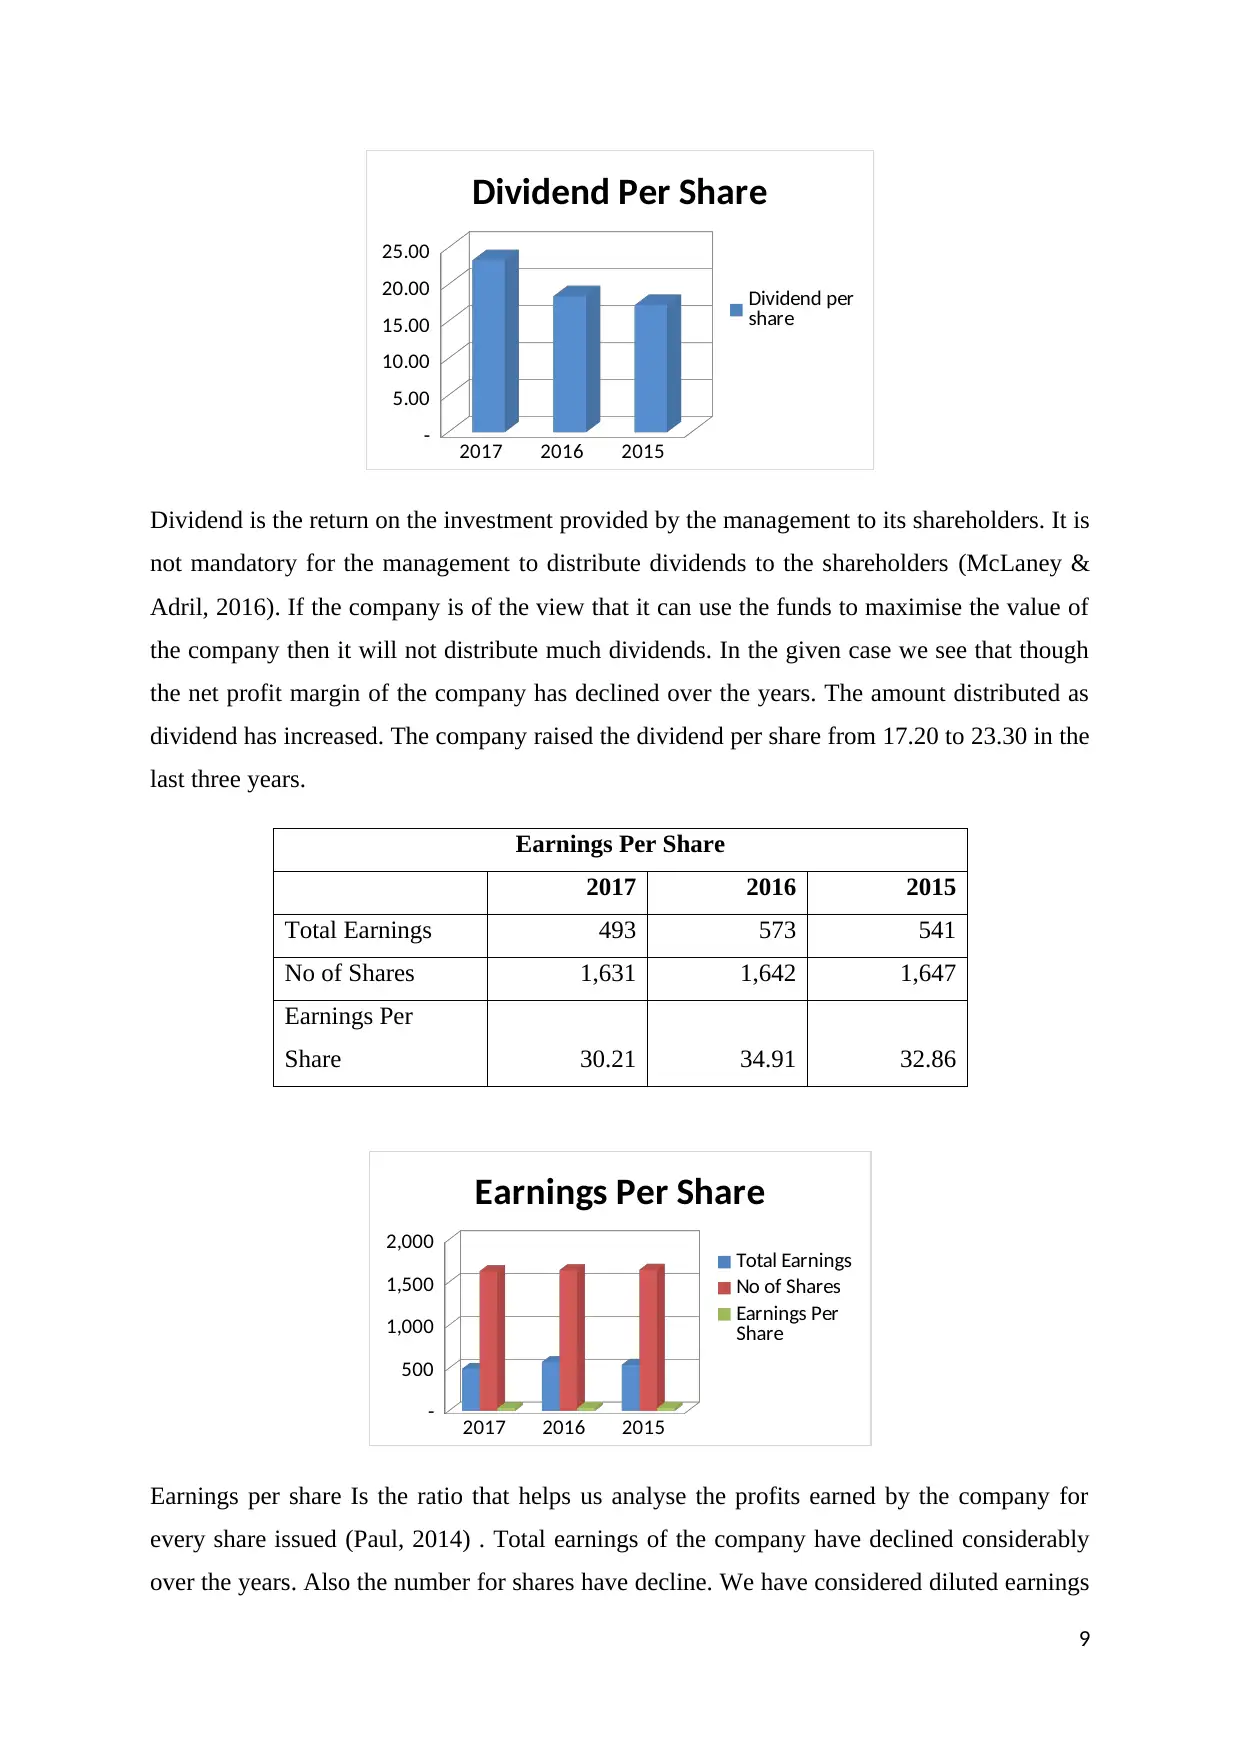
This report provides a comprehensive financial analysis of Marks & Spencer Plc, a leading British brand, using ratio analysis to evaluate the company's financial performance from 2015 to 2017. Key ratios such as Return on Assets, Net Profit Margin, Debt Equity Ratio, Debt Ratio, Equity Ratio, and Current Ratio are analyzed to assess profitability, solvency, and operational efficiency. The report identifies a decline in several key financial metrics, particularly in 2017, and attributes this to decreased revenues from the clothing line. In addition to quantitative analysis, the report discusses qualitative factors affecting the company's future performance, including its business model, competitive advantages, management strategies, relationships with third parties, and corporate governance practices. The analysis also considers the impact of declining market capitalization on shareholder wealth, concluding that while the company's standalone performance in the current year is reasonable, the overall trend indicates a need for improved operational efficiency and strategic adjustments to enhance profitability and shareholder value. This document is available on Desklib, a platform offering a wide range of study resources including past papers and solved assignments to support students in their academic endeavors.
Document Page
Marks & Spencer’s
1
tabler-icon-diamond-filled.svg

Paraphrase This Document

Need a fresh take? Get an instant paraphrase of this document with our AI Paraphraser
Document Page
Contents
Introduction-About the Company..............................................................................................3
Financial Analysis......................................................................................................................3
Qualitative factors affecting future performance of the company.............................................8
Corporate Governance of the Company.....................................................................................9
Conclusion................................................................................................................................10
2
Document Page
Introduction-About the Company
Marks and Spencer’s is one of the leading British brands, which have its headquarters located
in London. The company is listed on London stock exchange. The primary activities of the
company are selling branded line of clothes and foods. Over the years, the revenue generation
form clothing line has decreased and that from food has increased. The last reported market
capitalisation of the company was 4.56 billion GBP. The company has over 1433 stores
spread worldwide and is also engages in online trading. (Marks and Spencer's Group Plc,
2017)
In our discussion below we will cover the financial performance of the company along with
its future prospects and also its corporate governance strategies.
3
Document Page
Financial Analysis
In order to analyse the financial status of the company we have conducted ratio analysis.
Ratio analysis is the financial tool which helps us calculate the returns and financial
performance in quantitative data. This helps us analyse the company performance and make
decisions (Bragg, 2016).
Return on Assets
2017 2016 2015
Net Income 116 404 482
Total Assets 8,293 8,476 8,196
Return on Assets 1.40 4.77 5.88
2017 2016 2015
-
1,000
2,000
3,000
4,000
5,000
6,000
7,000
8,000
9,000
Return on Assets
Net Income
Total Assets
Return on Assets
Return on assets is the profitability ratio which helps the investor calculates the return they
earn in terms of percentage of assets (Fridson & Alvarez, 2012). Return on assets ratio is also
referred to as return on investment ratio. The return on assets of the company has been
declining over the years. The company reported a return of 5.88% in 2015, it declined to
4.77% in 2016 and finally the lowest return of 1.40% was reported by the company in 2017.
There has been decline in the investment and net income in 2017 as compared to last years.
Net Profit Margin
2017 2016 2015
Net Income 116 404 482
Sales Revenue 10,622 10,555 10,311.40
4
tabler-icon-diamond-filled.svg

Paraphrase This Document

Need a fresh take? Get an instant paraphrase of this document with our AI Paraphraser
Document Page
Net Profit
Margin 1.09 3.83 4.67
2017 2016 2015
-
2,000
4,000
6,000
8,000
10,000
12,000
Net Profit Margin
Net Income
Sales Revenue
Net Profit Margin
Net profit margin is the ratio that helps calculate the net margin earned by the company
(Girard, 2014). It helps calculate the efficiency of the company in cost reduction. There has
been decline in the net profit margin of the company over the years. The net profit margin fell
from 4.67 % in 2015 to 1.09% in 2017. This is something for which the company should be
concerned about. We see that the sales amount has increased and profit has decreased. This
aims towards lower operating efficiency. The company needs to improve its operational
efficiency in order to increase the net profit margin.
Debt Equity Ratio
2017 2016 2015
Total Debt 2,229.70
2,072.2
0 2,025.30
Total Equity 3,150.40
3,443.4
0 3,198.80
Debt Equity Ratio 0.71
0.6
0 0.63
5
Document Page
2017 2016 2015
-
500.00
1,000.00
1,500.00
2,000.00
2,500.00
3,000.00
3,500.00
Debt Equity Ratio
Total Debt
Total Equity
Debt Equity Ratio
Debt to equity ratio is the solvency ratio which helps calculate the proportion of debt is to
equity in a firm (Kieso, 2014). It helps the investors determine the own funds and loan funds
ratio. For the given company we see that the proportion of debt in capital has increased from
63% to 71% over the period of three years. Using debt funds and equity funds have their
specific advantages and disadvantages. This ratio shows that 71% of the total capital invested
is borrowed funds. This is the leverage ratio which helps to analyse the proportion of dent
used in the total capital.
Debt Ratio
2017 2016 2015
Total liabilities 5,142.10 5,033.00 4,997.30
Total Assets 8,292.50 8,476.40 8,196.10
Debt Ratio 0.62 0.59 0.61
2017 2016 2015
-
1,000.00
2,000.00
3,000.00
4,000.00
5,000.00
6,000.00
7,000.00
8,000.00
9,000.00
Debt Ratio
Total liabilities
Total Assets
Debt Ratio
6
Document Page
The debt ratio is the financial ratio which helps us calculate the percentage of total assets
which are financed by loan funds (Lerner, 2009). In the given case for the current year the
company has financed its 62 percent of the assets with the debt funds. The debt ratio has
increased from 61 percent to 59% to 62percent form the year 2016. Also the total liabilities
have increased and the amount of assets has decreased, which has resulted in higher debt ratio
for the current year. This ratio also helps to keep a check on the solvency of the firm.
Equity Ratio
2017 2016 2015
Total Equity 3,150.40
3,443.4
0 3,198.80
Total Assets 8,292.50 8,476.40 8,196.10
Equity Ratio 0.38
0.4
1 0.39
2017 2016 2015
-
2,000.00
4,000.00
6,000.00
8,000.00
10,000.00
Equity Ratio
Total Equity
Total Assets
Equity Ratio
Equity ratio is the same as debt ratio (Mattessich, 2016) . The only difference is that the
proportions of assets which are financed by equity fund are calculated in this ratio. This ratio
helps us determine the percentage of assets which are financed by equity funds. The equity
ratio has declined from 41 percent in 2016 to 38 percent in the year 2017. Both the amounts
of equity fund and asset fund has declined in the current year. The reasons for lower equity
may be lower net profits margin earned by the company in the current year.
Current Ratio
2017 2016 2015
Current Assets 1,72 1,461 1,455
7
tabler-icon-diamond-filled.svg

Paraphrase This Document

Need a fresh take? Get an instant paraphrase of this document with our AI Paraphraser
Document Page
3
Current Liabilities
2,36
8 2,105 2,112
Current Ratio
0.7
3 0.69 0.69
2017 2016 2015
-
500
1,000
1,500
2,000
2,500
Current Ratio
Current Assets
Current Liabilities
Current Ratio
Current ratio is a solvency ratio and one of the most popularly used ratio. This ratio is used
by the financers in order to evaluate the solvency status of the firm (Menifield, 2014) . The
benchmark or the most appropriate ratio is 2. That is the current assets should be at least two
times of the current liabilities. We see that the current ratio of the company has consistently
been below one. This indicated lower solvency levels for the company. This may lead to cash
deficiency for the company in future harming the daily operations. It is important for a firm
to have a healthy current ratio in order to have smooth operations.
Dividend per share
2017 2016 2015
Dividend per share
23.3
0 18.40 17.20
8
Document Page
2017 2016 2015
-
5.00
10.00
15.00
20.00
25.00
Dividend Per Share
Dividend per
share
Dividend is the return on the investment provided by the management to its shareholders. It is
not mandatory for the management to distribute dividends to the shareholders (McLaney &
Adril, 2016). If the company is of the view that it can use the funds to maximise the value of
the company then it will not distribute much dividends. In the given case we see that though
the net profit margin of the company has declined over the years. The amount distributed as
dividend has increased. The company raised the dividend per share from 17.20 to 23.30 in the
last three years.
Earnings Per Share
2017 2016 2015
Total Earnings 493 573 541
No of Shares 1,631 1,642 1,647
Earnings Per
Share 30.21 34.91 32.86
2017 2016 2015
-
500
1,000
1,500
2,000
Earnings Per Share
Total Earnings
No of Shares
Earnings Per
Share
Earnings per share Is the ratio that helps us analyse the profits earned by the company for
every share issued (Paul, 2014) . Total earnings of the company have declined considerably
over the years. Also the number for shares have decline. We have considered diluted earnings
9
Document Page
per share for the calculation of above ratio. The diluted earnings per share of the company
were 32.86 in the year2015, 34.91 in 2016 and it fell to 30.21 in the year 2017. The decline in
EPS for the current year is due to lower profits earned by the company. There has been
operation inefficiency in the company for current year which has reported in lower ratios for
the current year.
Therefore we see that the financial performance of the company has been good over the
years, but due to some reasons, in the current year lower returns were earned. The major
reason for decline in income id due to fall in the revenues from the clothing line of business.
The revenue for the food lone has increased by 4.2% in the current year. This has overall
affected the net profit margin of the company. Due to decline in profits, there has been
decline in other ratios as well.
Comparing the performance of the company from previous years we can say that the
performance has decline, but we see that standalone performance of the current year, we can
say that the company has performed well taking the market into consideration. The
shareholders wealth is created when the market cap of the company increases (Piper, 2015).
The market cap of the company in has declined by almost 18 percent. This has decreased the
shareholders wealth. Its is not the EPS or Net profit margin that is relevant in considering the
performance of the company, but how much wealth it creates is important. Since there has
been a decline in the share price of the company by 19 % in year, it has resulted in decrease
in shareholders wealth.
10
tabler-icon-diamond-filled.svg

Paraphrase This Document

Need a fresh take? Get an instant paraphrase of this document with our AI Paraphraser
Document Page
Qualitative factors affecting future performance of the company
Qualitative factors are factors other than financial factors which are to affect the future
performance of the company. These factors include factors such as the business model of the
company, management of the company, past performance, corporate governance, etc
(Rayman, 2009). These factors do not involve value directly, but decisions relating to any of
these factors will affect the value of the company.
Business model of Marks & Spencer’s: the business model of the company involves stores
at various locations which are spread worldwide. There are about 1433 stores of the company
which are spread worldwide. A recent news update showed that the company is planning to
close one of its stores in Warrington, which is likely to affect the employment of 450
employees. The company aims at acquiring best quality raw material and goods and then
distribute them with a brand name. Therefore, qualitative factors such as these are to affect
the performance of the company.
Competitive Advantage: Marks and Spencer’s has become a brand name which is not only
famous in London but is also famous world-wide. The company has a reputation for its brand
name which has assisted in creating value. This has generated value for years and is likely to
continue in near future. As per one of the famous business model a company should have two
kinds of competitive advantage in order to overcome the competition, these are low cost with
differentiated products (Rivenbark, Vogt, & Marlowe, 2009) . The company has both the
facts which has assisted it maintain the brand name over all these years.
Management of the company: management plays a very important role in the performance
and growth of the company (Ittelson, 2009) . Lack of good management can collapse a well
built business empire. The management of the company has laid down a business plan names
Plan A, which aims the company towards sustainability development along with growth of
the company.
Relationship with third parties: it is important that the company engaged in business which
has taken over the retail market needs to have relation with third parties for smooth flow of
goods and services (Pratt, 2009). Marks and Spencer’s, used its competitive advantage to
maintain a close relationship with their suppliers. They empowered their suppliers and
11
Document Page
manufacturers with design management which proved to be very advantageous for the
company.
Corporate governance: corporate governance speaks a lot about a company’s image. It
depicts the relationship amongst its management, employees and customers. It is important to
have a strong relationship and good corporate governance strategies in order to have a strong
financial future. As per the UK corporate governance code the companies are required to
provide a statement on the long term viability of the company (Rogers, 2015) . The company
has assessed there risks involved and concluded that the Marks and Spencer’s is a viable
business.
Therefore, we see that all the qualitative factors of the company aim towards a healthy future
of the company. The increasing competition and progressive economy has had some effects
on the workings of the company, but the financial future of the company seems altogether
strong and efficient. (Rosenfield, 2009)
12
chevron_up_icon
1 out of 18
circle_padding
hide_on_mobile
zoom_out_icon
[object Object]