Financial Management Analysis: Marks and Spencer Group Plc Report
VerifiedAdded on 2023/06/03
|15
|4035
|106
Report
AI Summary
This report provides a comprehensive financial analysis of Marks and Spencer Group Plc, covering a five-year period. It assesses liquidity through current and quick ratios, revealing a potential liquidity crisis. Profitability is examined using net, operating, and gross profit margins, indicating declining profitability trends. The report also touches upon efficiency ratios such as inventory, receivable, and payable turnover. Capital structure management and stock market performance are briefly discussed. The analysis identifies limitations and offers recommendations for improvement. Desklib provides access to similar solved assignments and study resources for students.

ANALYSIS OF BUSINESS OF MARKS AND SPENCER
Paraphrase This Document
Need a fresh take? Get an instant paraphrase of this document with our AI Paraphraser

Table of Content
Purpose of Report.................................................................................................................................3
Introduction...........................................................................................................................................3
Products................................................................................................................................................4
Key Personnel........................................................................................................................................4
Liquidity Analysis...................................................................................................................................4
Current Ratio.........................................................................................................................................5
Quick Ratio............................................................................................................................................6
Profitability Analysis..............................................................................................................................7
Net Profit Margin...................................................................................................................................7
Operating Profit Margin........................................................................................................................8
Gross Profit Margin...............................................................................................................................9
Inventory Turnover ratio.....................................................................................................................10
Receivable Turnover ratio...................................................................................................................11
Payable Turnover ratio........................................................................................................................12
Capital Structure Management...........................................................................................................12
Stock Market Performance..................................................................................................................13
Problems and Limitations....................................................................................................................13
Recommendation for Improvements..................................................................................................14
References:..........................................................................................................................................14

Purpose of Report
The report has been prepared to analyse the business of Marks and Spencer and involves
analysis of business prospect over a period of 5 years with focus on the following segments:
(a) Liquidity analysis involving computation of Current Ratio and Quick Ratio;
(b) Profitability analysis involving computation of Gross Profit Margin, Net Profit Margin
and Operating Profit Margin;
(c) Working Capital Margin Analysis involving computation of Cash Conversion Cycle;
(d) Capital Structure Management analysis involving computation of debt to equity ratio
and capital gearing ratio;
(e) Stock Market Performance and involves computation of Price to Equity Ratio
Post above, the report deals with the limitation of analysis and recommendation for
improvement of analysis.
Introduction
Marks and Spencer Group Plc is a listed entity in London Stock Exchange with principal
operations under the retail segment. (Reuters.com, 2018)The company makes its presence
⊘ This is a preview!⊘
Do you want full access?
Subscribe today to unlock all pages.
Trusted by 1+ million students worldwide

pan world with more than 1380 stores globally. Marks has two segments of operation one is
domestic and other is international. Under the domestic segment it operated through its own
stores and through franchisee. The product dealt include food, clothing and home products. It
marks it presence digitally too. (Anon., n.d.) The company is headquartered in London. The
price of the shares quoted on London Stock Exchange on 6:09 AM EDT is 286.10 GBP.
Products
The company deals in following products and businesses:
(a) Food Industry: The Company has 696 food stores and contributes to 61% of UK
Revenue of the company. (Anon., 2018)
(b) Clothing and Home Sector: The company has 11.1 M Sqft clothing space in UK and the
business accounts for 39% of UK revenue of the company. (Anon., 2018)
Key Personnel
The key Personnel of the company along with a brief description of their profile is given
here-in-below:
(a) Archie Norman: Mr. Archie is the chairman of the company since September 2017. He
had prior stint in ITV, Lazard UK, Asda etc. He has a long track of creating value in
companies and changeover of many British Companies.
(b) Steve Rowe: Mr. Steve is the Chief Executive and Executive Director of the company
and has been since 2016. He is a veteran in e-commerce and retail business and he has
worked in all the areas of business.
(c) Humphrey Singer: He is Chief Financial Officer of the company and has been since
2018. He has past stint with Dixons Carphone Plc. He has played key roles in Finance
in various companies.
(d) Amanda Mellor: She is Group Secretary and group head of Corporate Governance of
the company. She has been since 2004 with the company and has diverse knowledge.
Her past stint was with James Capel, Robert Fleming etc.
(e) Katie Bickerstaffe: She is Non-Executive director of the company and has a diversified
knowledge in finance. She had a bright career with Ernst and Young, big four Audit
Company of the world. (Reuters.com, 2018)
Other directors include Pip McCrostie, Alison Brittain, Andrew Fisher, Andrew Halford.
Liquidity Analysis
This analysis measure the ability of the company to repays its liabilities in a timely manner as
and when due. The analysis is crucial to determine the company financial position in short
term and whether the company shall repay its debt in a timely manner. This ratio impact the
financial liquidity of the company and continuity of day-to-day operations of the company.
These analysis is based on items present in statement of financial position.
Paraphrase This Document
Need a fresh take? Get an instant paraphrase of this document with our AI Paraphraser

Current Ratio
This ratio is one of the simplest and most common tool of analysis used for analysis the
current asset and liability position of the company. The idle ratio is 2:1. However, the same is
not guarantee that company shall meet its short term obligations. (Accounting Coach, 2018)
The formula for computation of Current ratio has been detailed here-in-below:
Current Ratio: Current Asset/ Current Liability
The data has been used for past 5 years to analyse the current ratio of the company. The table
has been enumerated here-in-below:
Current Ratio
('000)
Sl
No Particulars Current Asset (A) Current Liability (B) Current Ratio (A/B)
1 2018 1317900 1826000 0.722
2 2017 1723300 2368000 0.728
3 2016 1461400 2104800 0.694
4 2015 1455000 2111600 0.689
5 2014 1368500 2349300 0.583

On perusal of the above table, it shall be seen that company’s current ratio is below 2 over the
period of 5 years and has been gradually improving over the years which is a good sign but
the company suffers from acute liquidity crisis as understandable from low current ratio and
has only 72 cents assets for 1 GBP of liability which is not good and is impacting the
financial position of the company (Anon., 2018)
Quick Ratio
Quick Ratio is also a significant tool for analysing the liquidity position of the company. The
major difference between current ratio and quick ratio is that it goes for further in depth
analysis and excludes inventory and prepaid expense from current asset for computation of
ratio. (Investing Answers, 2018) The idle quick ratio is 1:1.The formula for computation of
quick ratio has been detailed here-in-below
Quick Ratio: (Current Asset- Inventory- Prepaid Expense)/Current Liability
The data has been used for past 5 years to analyse the quick ratio of the company. The table
has been enumerated here-in-below:
Quick Ratio
('000)
Sl No Particulars Quick Asset (A) Current Liability (B) Quick Ratio (A/B)
1 2018 536900 1826000 0.294
2 2017 964800 2368000 0.407
3 2016 661500 2104800 0.314
4 2015 657200 2111600 0.311
5 2014 523000 2349300 0.223
2013 2014 2015 2016 2017 2018 2019
0.000
0.100
0.200
0.300
0.400
0.500
0.600
0.700
0.800 0.7220.728
0.6940.689
0.583
Current Ratio (A/B)
Current Ratio (A/B)
⊘ This is a preview!⊘
Do you want full access?
Subscribe today to unlock all pages.
Trusted by 1+ million students worldwide

On perusal of the above table, it shall be seen that company’s quick ratio is below 1 over the
period of 5 years and has been gradually improving over the years which is a good sign but
the company suffers from acute liquidity crisis as understandable from low quick ratio and
has only 30 cents assets for 1 GBP of liability which is not good and is impacting the
financial position of the company. It is also evident that inventory forms a major chunk of
current asset of the company which is not a positive signal in short term. (Anon., 2018)
Further, the cash reserves of the company are acute low.
Profitability Analysis
The second segment of analysis is based on profitability of the company. It is an important
for a company to earn profit for sustaining the business and expanding in future. The key
ratios that has been analysed to understand the profitability of the company include (a) Net
Profit Margin, (b) Gross Profit Margin, (c) Operating profit Margin
Net Profit Margin
This is a significant tool in analysing the profitability that is in hand of the company post tax
and meeting expenses of the company. This profit is available for distribution to equity and
preference shareholders. Further, the higher the margin the better the owners of the company
are taken care of. The ratio is computed by using the following formula:
Net Profit Margin= (Net Profit/ Sales)
The data has been used for past 5 years to analyse the net profit margin of the company. The
table has been enumerated here-in-below:
Net Profit Margin
('000)
Sl No Particulars Net Profit (A) Sales (B) Net Profit Margin (A/B)
1 2018 25700 10698200 0.2%
2 2017 117100 10622000 1.1%
3 2016 406900 10555400 3.9%
4 2015 486500 10311400 4.7%
5 2014 506000 10309700 4.9%
2013.5 2014 2014.5 2015 2015.5 2016 2016.5 2017 2017.5 2018 2018.5
0.000
0.050
0.100
0.150
0.200
0.250
0.300
0.350
0.400
0.450
0.294
0.407
0.3140.311
0.223
Quick Ratio
Series2
Paraphrase This Document
Need a fresh take? Get an instant paraphrase of this document with our AI Paraphraser

On perusal of the above table, it shall be seen that company’s Net Profit margin has been very
low over the years and has reached bottom in 2018 as reflected in the curve above. Thus, it
can be inferred that company has not been generating significant profits from its two
divisions and is not providing fair return to its investors. Further, a lower profit margin shall
impact the future business of the company a turnover strategy is must. Accordingly, a new
chairman with experience in turnaround strategies has been seated. (Anon., 2018)
Operating Profit Margin
This is also a significant tool for analysing the profitability of the company. The ratio takes
into account the profitability of the company from its continuous operations before tax and
finance cost. The higher the operating margin the better the investors are taken care of. The
formula for computation of margin has been detailed here-in-below:\
Operating Profit Margin=Operating Profit/Sales
The data has been used for past 5 years to analyse the operating profit margin of the
company. The table has been enumerated here-in-below:
2013.5 2014 2014.5 2015 2015.5 2016 2016.5 2017 2017.5 2018 2018.5
0.0%
1.0%
2.0%
3.0%
4.0%
5.0%
6.0%
0.2%
1.1%
3.9%
4.7%
4.9%
Net Profit Margin
Series2

Operating Profit Margin
('000)
Sl
No Particulars Operating Profit (A) Sales (B) Operating Profit Margin (A/B)
1 2018 29100 10698200 0.272%
2 2017 115700 10622000 1.089%
3 2016 404400 10555400 3.831%
4 2015 481700 10311400 4.672%
5 2014 694500 10309700 6.736%
On perusal of the above table, it shall be seen that company’s Operating Profit margin has
been very low over the years and has reached bottom in 2018 as reflected in the curve above.
Thus, it can be inferred that company has not been generating significant profits from its two
divisions and is not providing fair return to its investors. Further, a lower profit margin shall
impact the future business of the company a turnover strategy is must. Accordingly, a new
chairman with experience in turnaround strategies has been seated.
Gross Profit Margin
Gross Profit Margin is an indicator of profit earned after deducting direct expense incurred
for earning such profit. The ratio is significant for analysing the profit earned by the company
from its business before reduction of any indirect expense. The higher the gross profit margin
the better the investors are taken care of. The formula for computation of margin has been
detailed here-in-below:
Gross Profit Margin=Gross Profit/Sales
The data has been used for past 5 years to analyse the gross profit margin of the company.
The table has been enumerated here-in-below:
2013.5 2014 2014.5 2015 2015.5 2016 2016.5 2017 2017.5 2018 2018.5
0.000%
1.000%
2.000%
3.000%
4.000%
5.000%
6.000%
7.000%
8.000%
0.272%
1.089%
3.831%
4.672%
6.736%
Operating Profit Margin
Series2
⊘ This is a preview!⊘
Do you want full access?
Subscribe today to unlock all pages.
Trusted by 1+ million students worldwide

Gross Profit Margin
('000)
Sl No Particulars Gross Profit (A) Sales (B) Gross Profit Margin (A/B)
1 2018 3952600 10698200 36.95%
2 2017 3992700 10622000 37.59%
3 2016 4028900 10555400 38.17%
4 2015 3880600 10311400 37.63%
5 2014 3870700 10309700 37.54%
On perusal of the above table, it shall be seen that company’s Gross Profit margin has been
good over the years and has reached bottom in 2018 as reflected in the curve above. Despite
that the net profit and operating profit of the company has been low on account of significant
indirect expense of the company. (Anon., 2018)
Efficiency Ratio
These ratio analyse the effectiveness of the company to manage its asset and liability in a
prudent manner. Further, it also analyse the efficiency of the company to utilise the assets to
generate revenue. (MyAccountingCourse.com, 2018)
The ratios that have been analysed includes inventory turnover ratio, receivable turnover ratio and
Account payable turnover ratio.
2013.5 2014 2014.5 2015 2015.5 2016 2016.5 2017 2017.5 2018 2018.5
36.00%
36.50%
37.00%
37.50%
38.00%
38.50%
36.95%
37.59%
38.17%
37.63%
37.54%
Gross Profit Margin
Series2
Paraphrase This Document
Need a fresh take? Get an instant paraphrase of this document with our AI Paraphraser
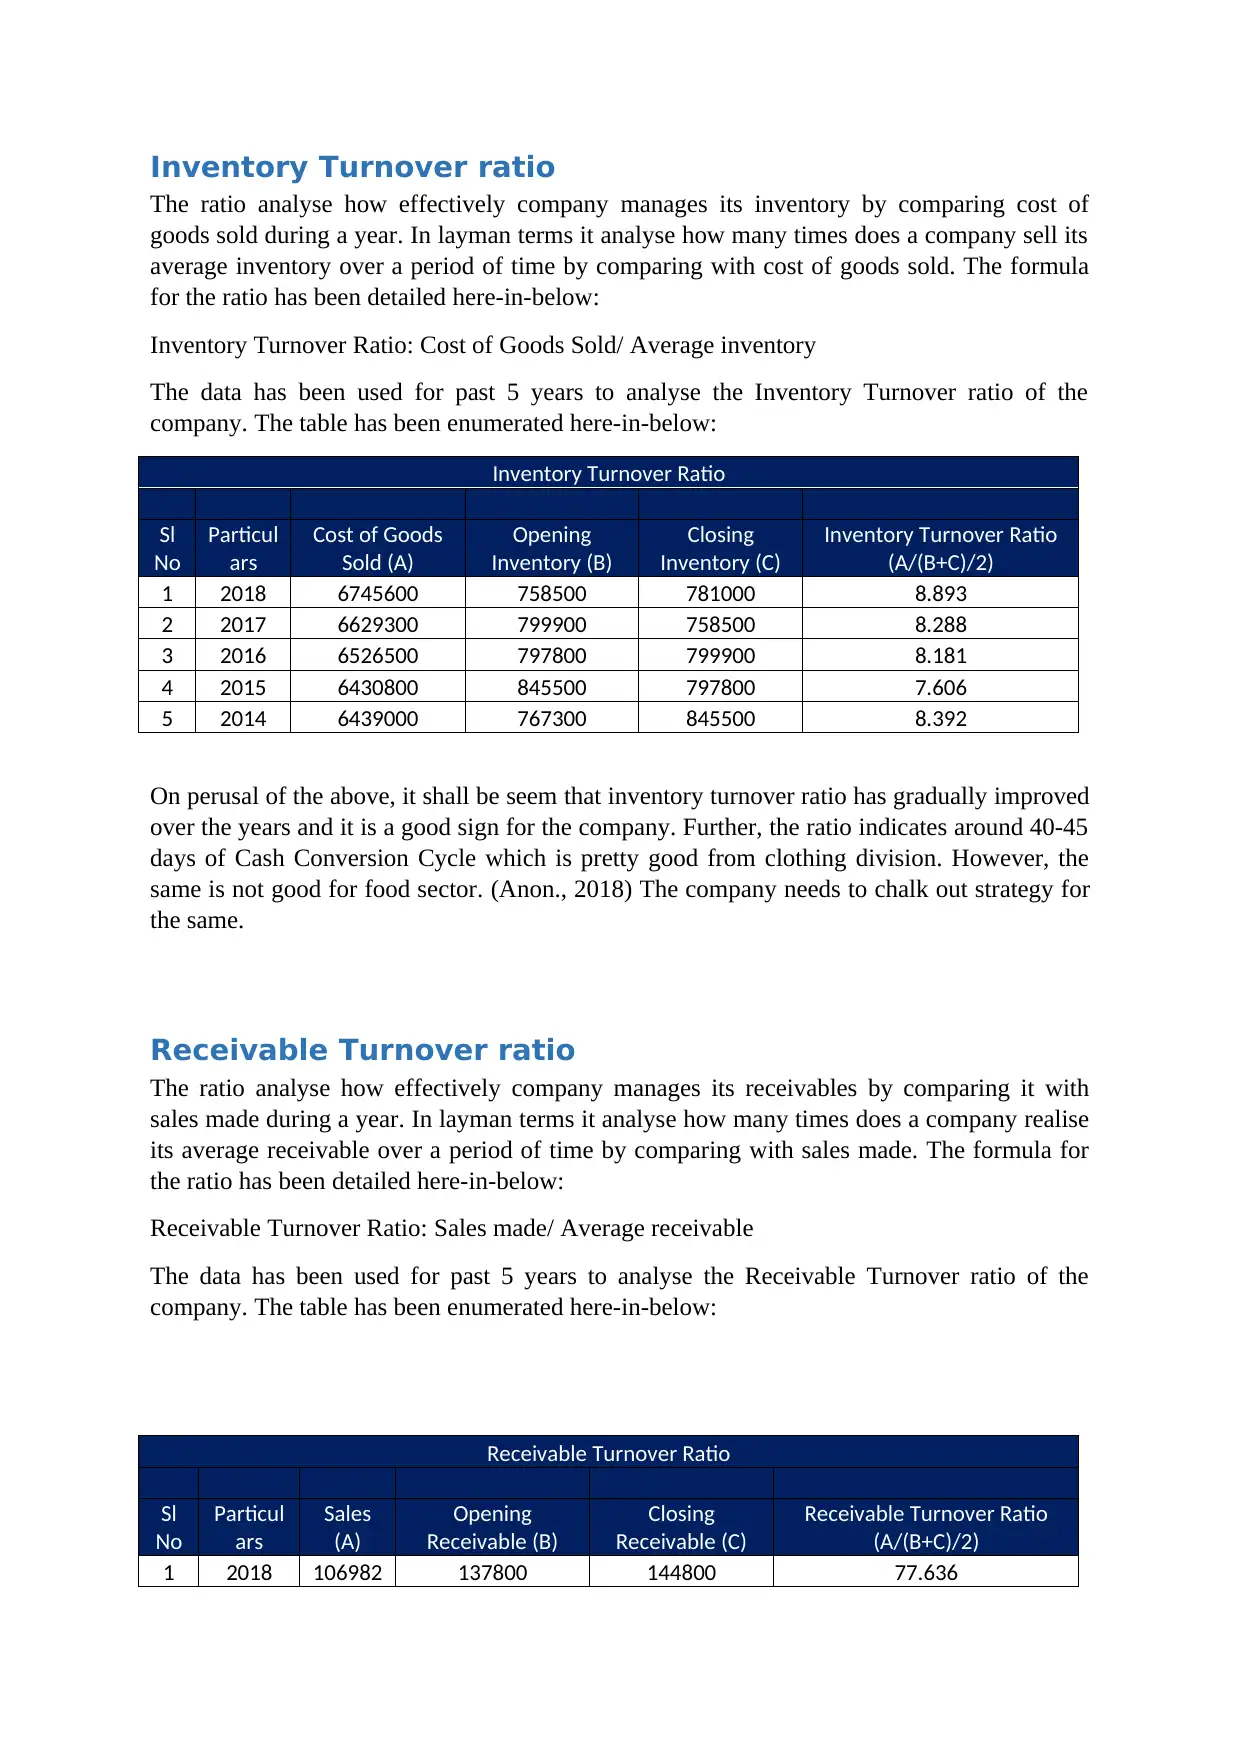
Inventory Turnover ratio
The ratio analyse how effectively company manages its inventory by comparing cost of
goods sold during a year. In layman terms it analyse how many times does a company sell its
average inventory over a period of time by comparing with cost of goods sold. The formula
for the ratio has been detailed here-in-below:
Inventory Turnover Ratio: Cost of Goods Sold/ Average inventory
The data has been used for past 5 years to analyse the Inventory Turnover ratio of the
company. The table has been enumerated here-in-below:
Inventory Turnover Ratio
Sl
No
Particul
ars
Cost of Goods
Sold (A)
Opening
Inventory (B)
Closing
Inventory (C)
Inventory Turnover Ratio
(A/(B+C)/2)
1 2018 6745600 758500 781000 8.893
2 2017 6629300 799900 758500 8.288
3 2016 6526500 797800 799900 8.181
4 2015 6430800 845500 797800 7.606
5 2014 6439000 767300 845500 8.392
On perusal of the above, it shall be seem that inventory turnover ratio has gradually improved
over the years and it is a good sign for the company. Further, the ratio indicates around 40-45
days of Cash Conversion Cycle which is pretty good from clothing division. However, the
same is not good for food sector. (Anon., 2018) The company needs to chalk out strategy for
the same.
Receivable Turnover ratio
The ratio analyse how effectively company manages its receivables by comparing it with
sales made during a year. In layman terms it analyse how many times does a company realise
its average receivable over a period of time by comparing with sales made. The formula for
the ratio has been detailed here-in-below:
Receivable Turnover Ratio: Sales made/ Average receivable
The data has been used for past 5 years to analyse the Receivable Turnover ratio of the
company. The table has been enumerated here-in-below:
Receivable Turnover Ratio
Sl
No
Particul
ars
Sales
(A)
Opening
Receivable (B)
Closing
Receivable (C)
Receivable Turnover Ratio
(A/(B+C)/2)
1 2018 106982 137800 144800 77.636

Receivable Turnover Ratio
00
2 2017
106220
00 167800 137800 63.302
3 2016
105554
00 177000 167800 59.635
4 2015
103114
00 309500 177000 33.316
5 2014
103097
00 245000 309500 42.080
On perusal of the above, it shall be seem that receivable turnover ratio has gradually
improved over the years and it is a good sign for the company. Further, the ratio indicates
around 5- 10 days of Cash Conversion Cycle which is pretty good and shows the
effectiveness of management in marinating its working capital.
Payable Turnover ratio
The ratio analyse how effectively company manages its payables by comparing it with
purchases made during a year. In layman terms it analyse how many times does a company
pays its average payable over a period of time by comparing with purchases made. The
formula for the ratio has been detailed here-in-below:
Purchase Turnover Ratio: Purchases made/ Average payable
Purchases: Cost of goods sold +Opening Stock- Closing Stock
The data has been used for past 5 years to analyse the Receivable Turnover ratio of the
company. The table has been enumerated here-in-below:
Payable Turnover Ratio
Sl
No
Particul
ars
Purchases
(A)
Opening
Payable (B)
Closing
Receivable (C)
Payable Turnover Ratio
(A/(B+C)/2)
1 2018 6768100 967500 872900 6.995
2 2017 6587900 1021900 967500 6.447
3 2016 6528600 967600 1021900 6.747
4 2015 6383100 1692800 967600 3.771
5 2014 6517200 1503800 1692800 4.334
The company has been very slow in making payment to its creditors as indicated by a low
turnover ratio. The same justifies the reason for lower current ratio and quick ratio. However,
a lower ratio is also an indicator of a weaker bargaining power in the hands of the company.
The average payment days lies between 80-90 days resulting in a negative cash conversion
cycle.
⊘ This is a preview!⊘
Do you want full access?
Subscribe today to unlock all pages.
Trusted by 1+ million students worldwide
1 out of 15
Related Documents


Your All-in-One AI-Powered Toolkit for Academic Success.
+13062052269
info@desklib.com
Available 24*7 on WhatsApp / Email
![[object Object]](/_next/static/media/star-bottom.7253800d.svg)
Unlock your academic potential
Copyright © 2020–2026 A2Z Services. All Rights Reserved. Developed and managed by ZUCOL.