Analysis of Financial Reports and Statements: Marshall Motor Holdings
VerifiedAdded on 2020/04/13
|21
|4181
|84
Project
AI Summary
This project report provides a comprehensive financial analysis of Marshall Motor Holdings PLC, focusing on its financial statements and performance within the automotive industry. The report begins with an introduction and company overview, followed by an industry analysis highlighting trends and market dynamics. The core of the report involves a detailed financial statement analysis, including calculations of sales, operating profit, earnings, and cash flow changes from 2015 to 2016. Ratio analysis is performed to evaluate liquidity, solvency, debt, and profitability positions, with data spanning several years. The analysis includes key metrics like net profit margin, return on equity, current ratio, acid test ratio, and debt-to-equity ratio. The report's findings reveal improvements in sales, operating profit, and other financial indicators, reflecting the company's enhanced market position and profitability. The report uses data from financial statements to provide a thorough evaluation of Marshall Motor Holdings PLC's financial health and performance.
Running Head: Financial reports and statements
1
Project Report: Financial reports and statements
1
Project Report: Financial reports and statements
Paraphrase This Document
Need a fresh take? Get an instant paraphrase of this document with our AI Paraphraser
Financial reports and statements 2
Contents
Introduction.......................................................................................................................3
Company overview...........................................................................................................3
Industry Overview............................................................................................................3
Financial statement analysis.............................................................................................4
Ratio analysis................................................................................................................5
Horizontal analysis.....................................................................................................10
Conclusion......................................................................................................................14
References.......................................................................................................................15
Appendix.........................................................................................................................17
Financial reports and statements 3
Introduction:
This report has been prepared to evaluate and identify the impact of the financial
statement of a company over various aspects and the variables of the company. Financial
statement is the main reports to analyze the performance and the position of the company in
terms of finance. Financial statement analysis is done by the financial analyst, chief financial
officer and the investors of the company to analyze and evaluate the position of the company
so that a better decision could be made. This analysis also assists the companies to evaluate
their market position so that the new diversifications, strategies and policies could be made.
In this report, automotive industry has been taken into the concern. This report has
been prepared over Marshall Motor Holdings plc. For this analysis, firstly an overview study
has been done over the company and the automotive industry. Further, various financial
analysis methods have been used to identify the changes into the financial position of the
company so that it could be evaluated that how the position of the company has been
enhanced.
Company overview:
Marshall Motor holdings plc is operating its business into international market. The
analysis over company depict that the primarily, this company evaluates and performs the
automotive industry’s work. This company is selling and repairing numerous vehicles related
to commercial and passenger’s purpose. Currently, this company has diversified its market
into 25 countries. 103 franchises of this company have contracted with 25 brands of
automotive industry to transport the vehicles into the global market (Home, 2017). This
company has 28 sites to manage and administer the operations and the performance of the
company. Through the analysis over the internal and external factors of the company, it has
been evaluated that the performance of the company has been enhanced and it assist the
company to manage the position of the company in the industry as well as in international
market.
Industry Overview:
Further, the overview study over the industry depict that the automotive industry is
growing up rapidly. The automotive industry share has been enhanced in the economy share.
Through the analysis over automotive industry, it has been found that the global presence of
the automotive industry is enhancing and due to it the performance of the companies which
⊘ This is a preview!⊘
Do you want full access?
Subscribe today to unlock all pages.
Trusted by 1+ million students worldwide
Financial reports and statements 4
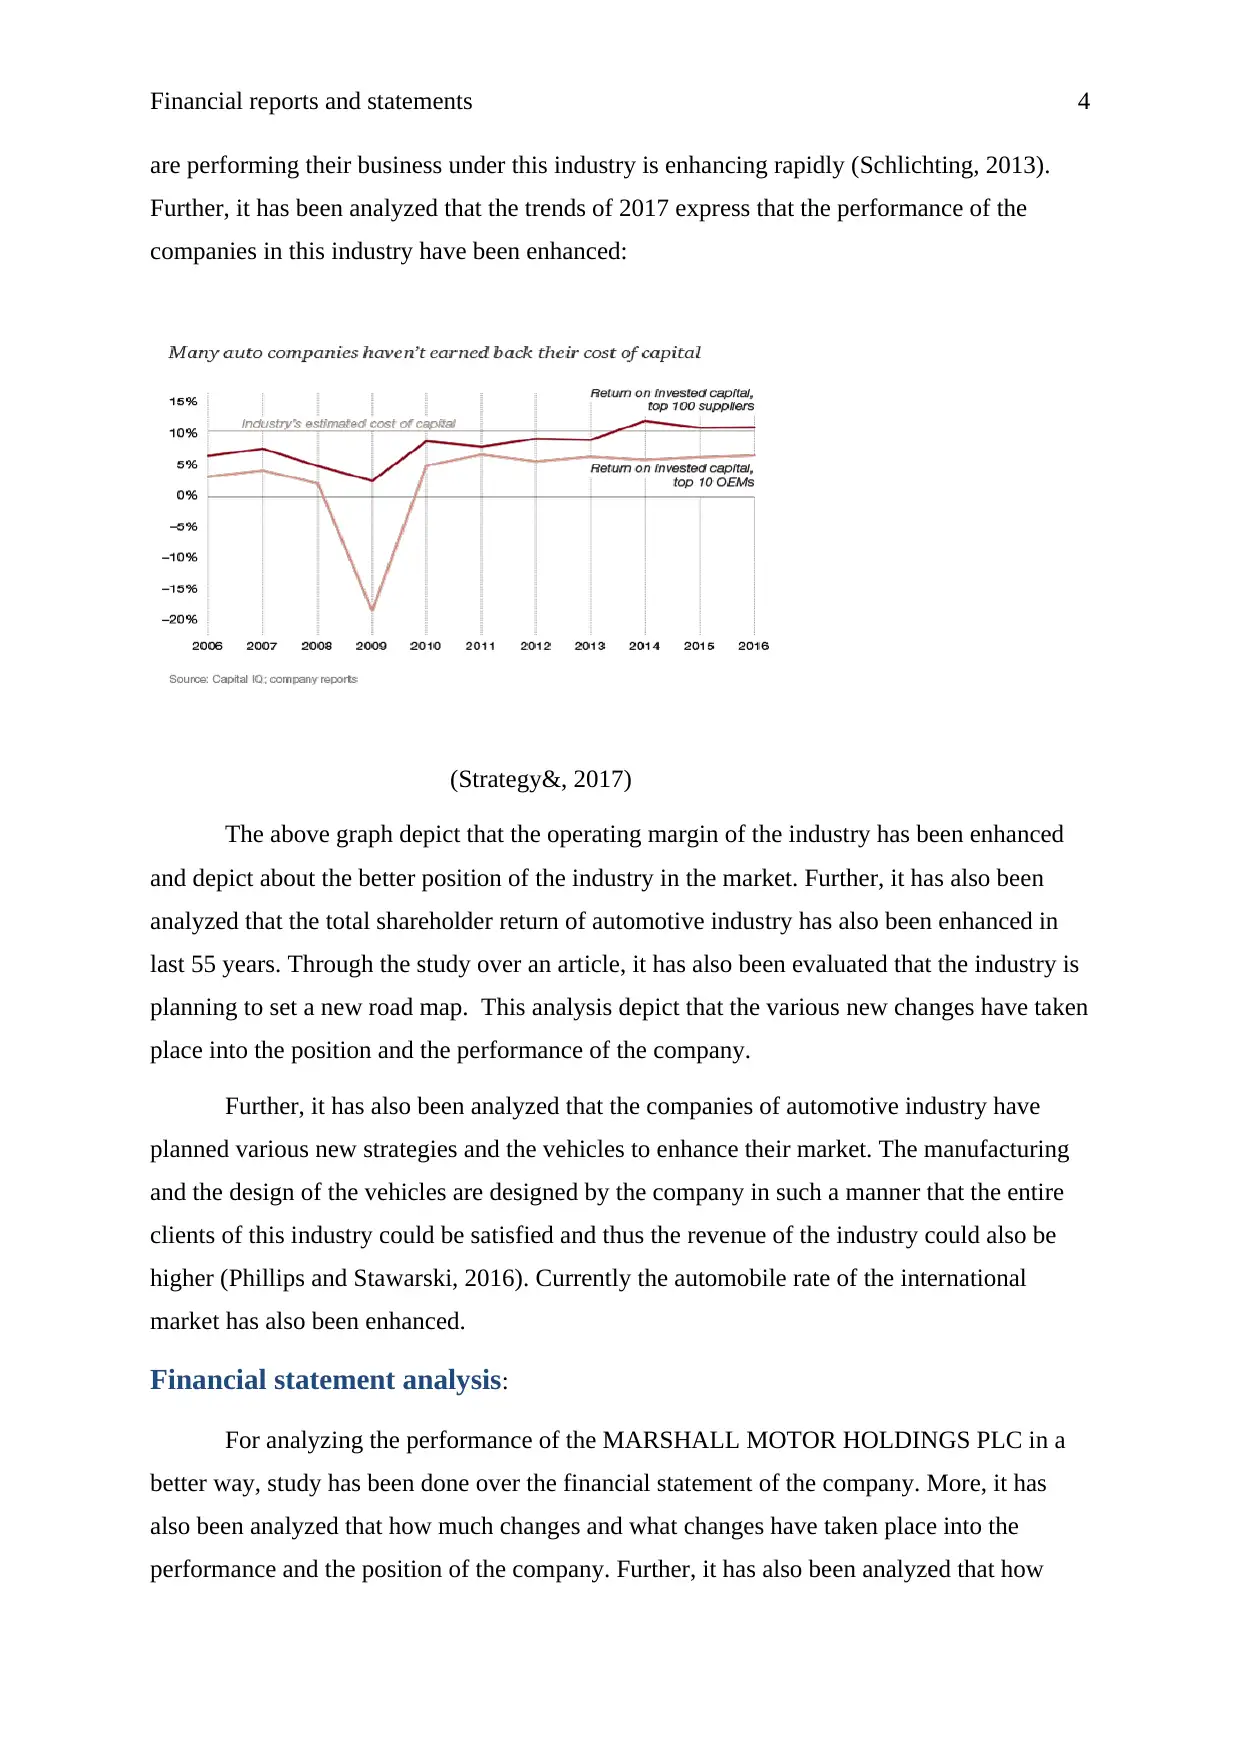
are performing their business under this industry is enhancing rapidly (Schlichting, 2013).
Further, it has been analyzed that the trends of 2017 express that the performance of the
companies in this industry have been enhanced:
(Strategy&, 2017)
The above graph depict that the operating margin of the industry has been enhanced
and depict about the better position of the industry in the market. Further, it has also been
analyzed that the total shareholder return of automotive industry has also been enhanced in
last 55 years. Through the study over an article, it has also been evaluated that the industry is
planning to set a new road map. This analysis depict that the various new changes have taken
place into the position and the performance of the company.
Further, it has also been analyzed that the companies of automotive industry have
planned various new strategies and the vehicles to enhance their market. The manufacturing
and the design of the vehicles are designed by the company in such a manner that the entire
clients of this industry could be satisfied and thus the revenue of the industry could also be
higher (Phillips and Stawarski, 2016). Currently the automobile rate of the international
market has also been enhanced.
Financial statement analysis:
For analyzing the performance of the MARSHALL MOTOR HOLDINGS PLC in a
better way, study has been done over the financial statement of the company. More, it has
also been analyzed that how much changes and what changes have taken place into the
performance and the position of the company. Further, it has also been analyzed that how
Paraphrase This Document
Need a fresh take? Get an instant paraphrase of this document with our AI Paraphraser
Financial reports and statements 5
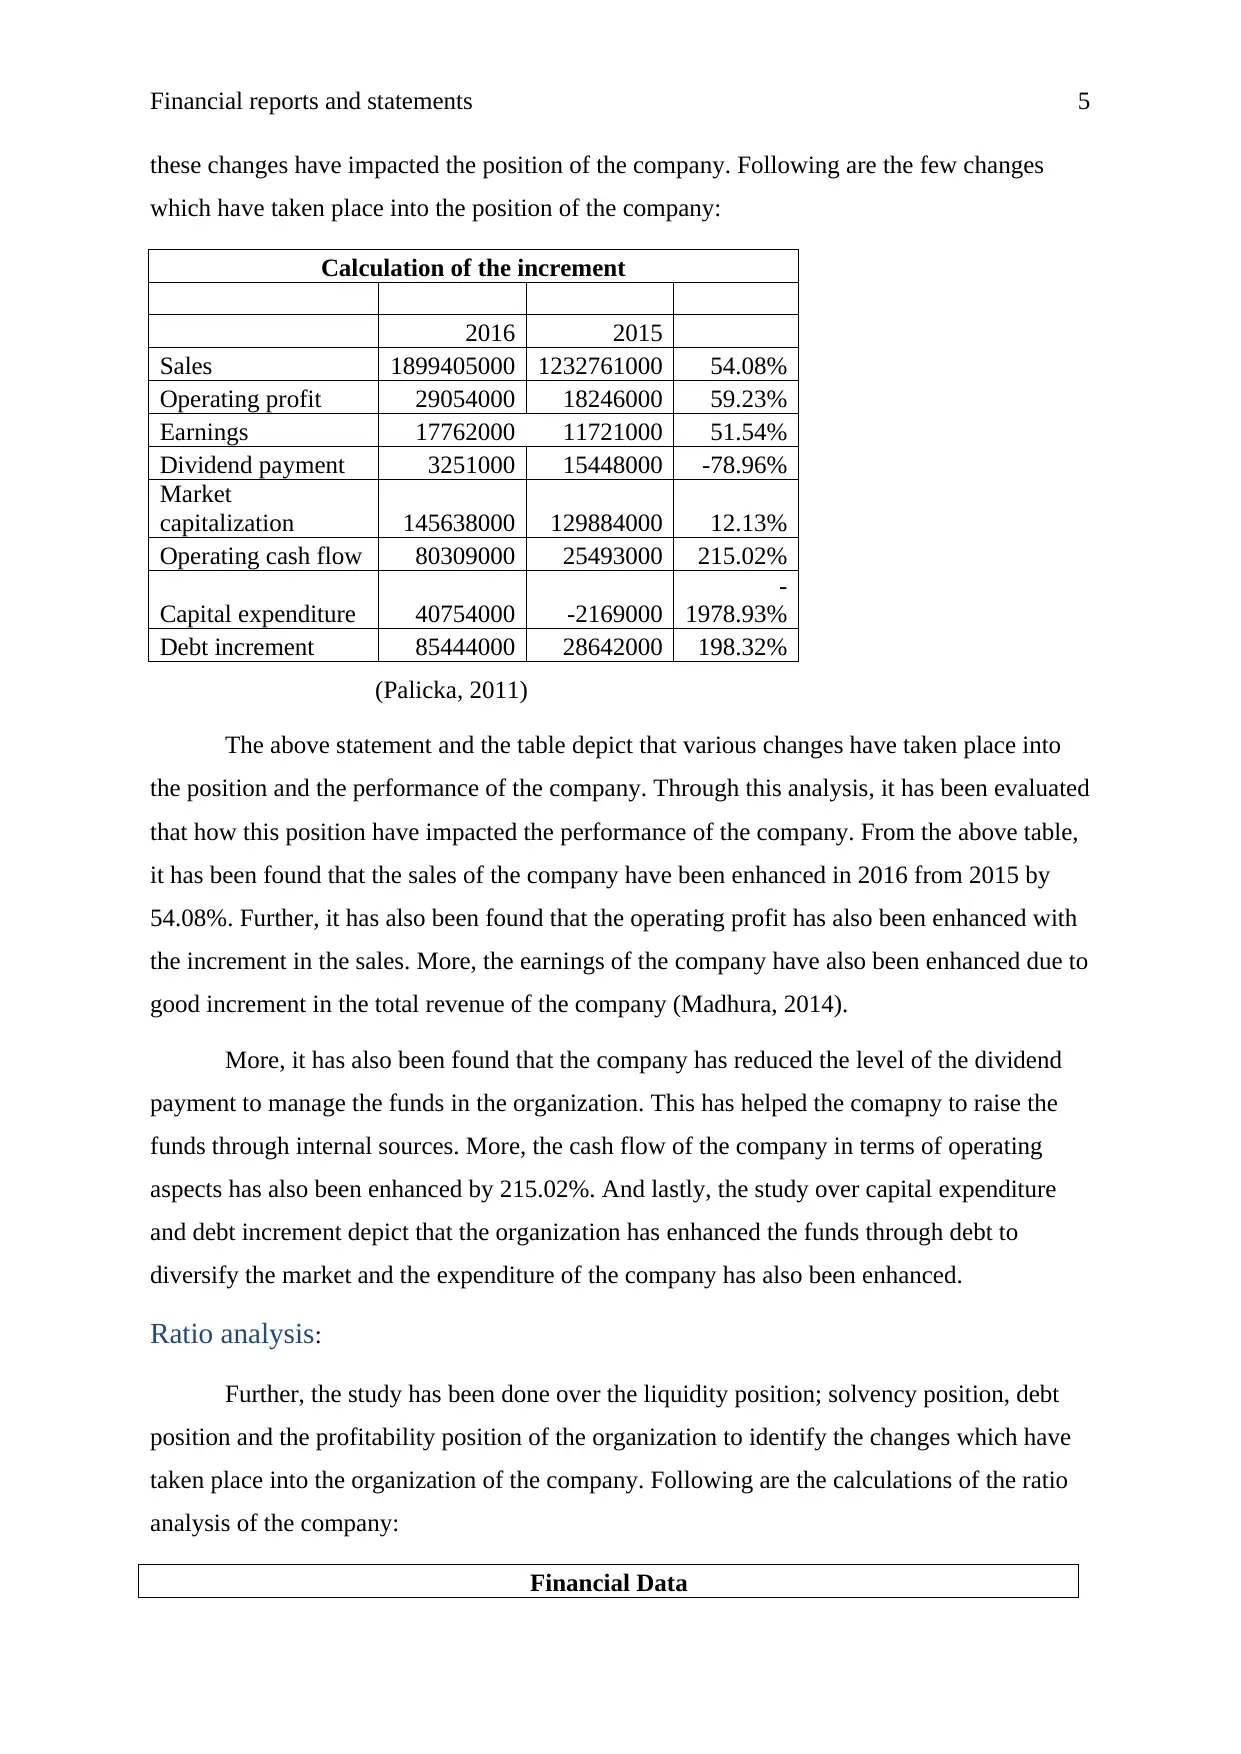
these changes have impacted the position of the company. Following are the few changes
which have taken place into the position of the company:
Calculation of the increment
2016 2015
Sales 1899405000 1232761000 54.08%
Operating profit 29054000 18246000 59.23%
Earnings 17762000 11721000 51.54%
Dividend payment 3251000 15448000 -78.96%
Market
capitalization 145638000 129884000 12.13%
Operating cash flow 80309000 25493000 215.02%
Capital expenditure 40754000 -2169000
-
1978.93%
Debt increment 85444000 28642000 198.32%
(Palicka, 2011)
The above statement and the table depict that various changes have taken place into
the position and the performance of the company. Through this analysis, it has been evaluated
that how this position have impacted the performance of the company. From the above table,
it has been found that the sales of the company have been enhanced in 2016 from 2015 by
54.08%. Further, it has also been found that the operating profit has also been enhanced with
the increment in the sales. More, the earnings of the company have also been enhanced due to
good increment in the total revenue of the company (Madhura, 2014).
More, it has also been found that the company has reduced the level of the dividend
payment to manage the funds in the organization. This has helped the comapny to raise the
funds through internal sources. More, the cash flow of the company in terms of operating
aspects has also been enhanced by 215.02%. And lastly, the study over capital expenditure
and debt increment depict that the organization has enhanced the funds through debt to
diversify the market and the expenditure of the company has also been enhanced.
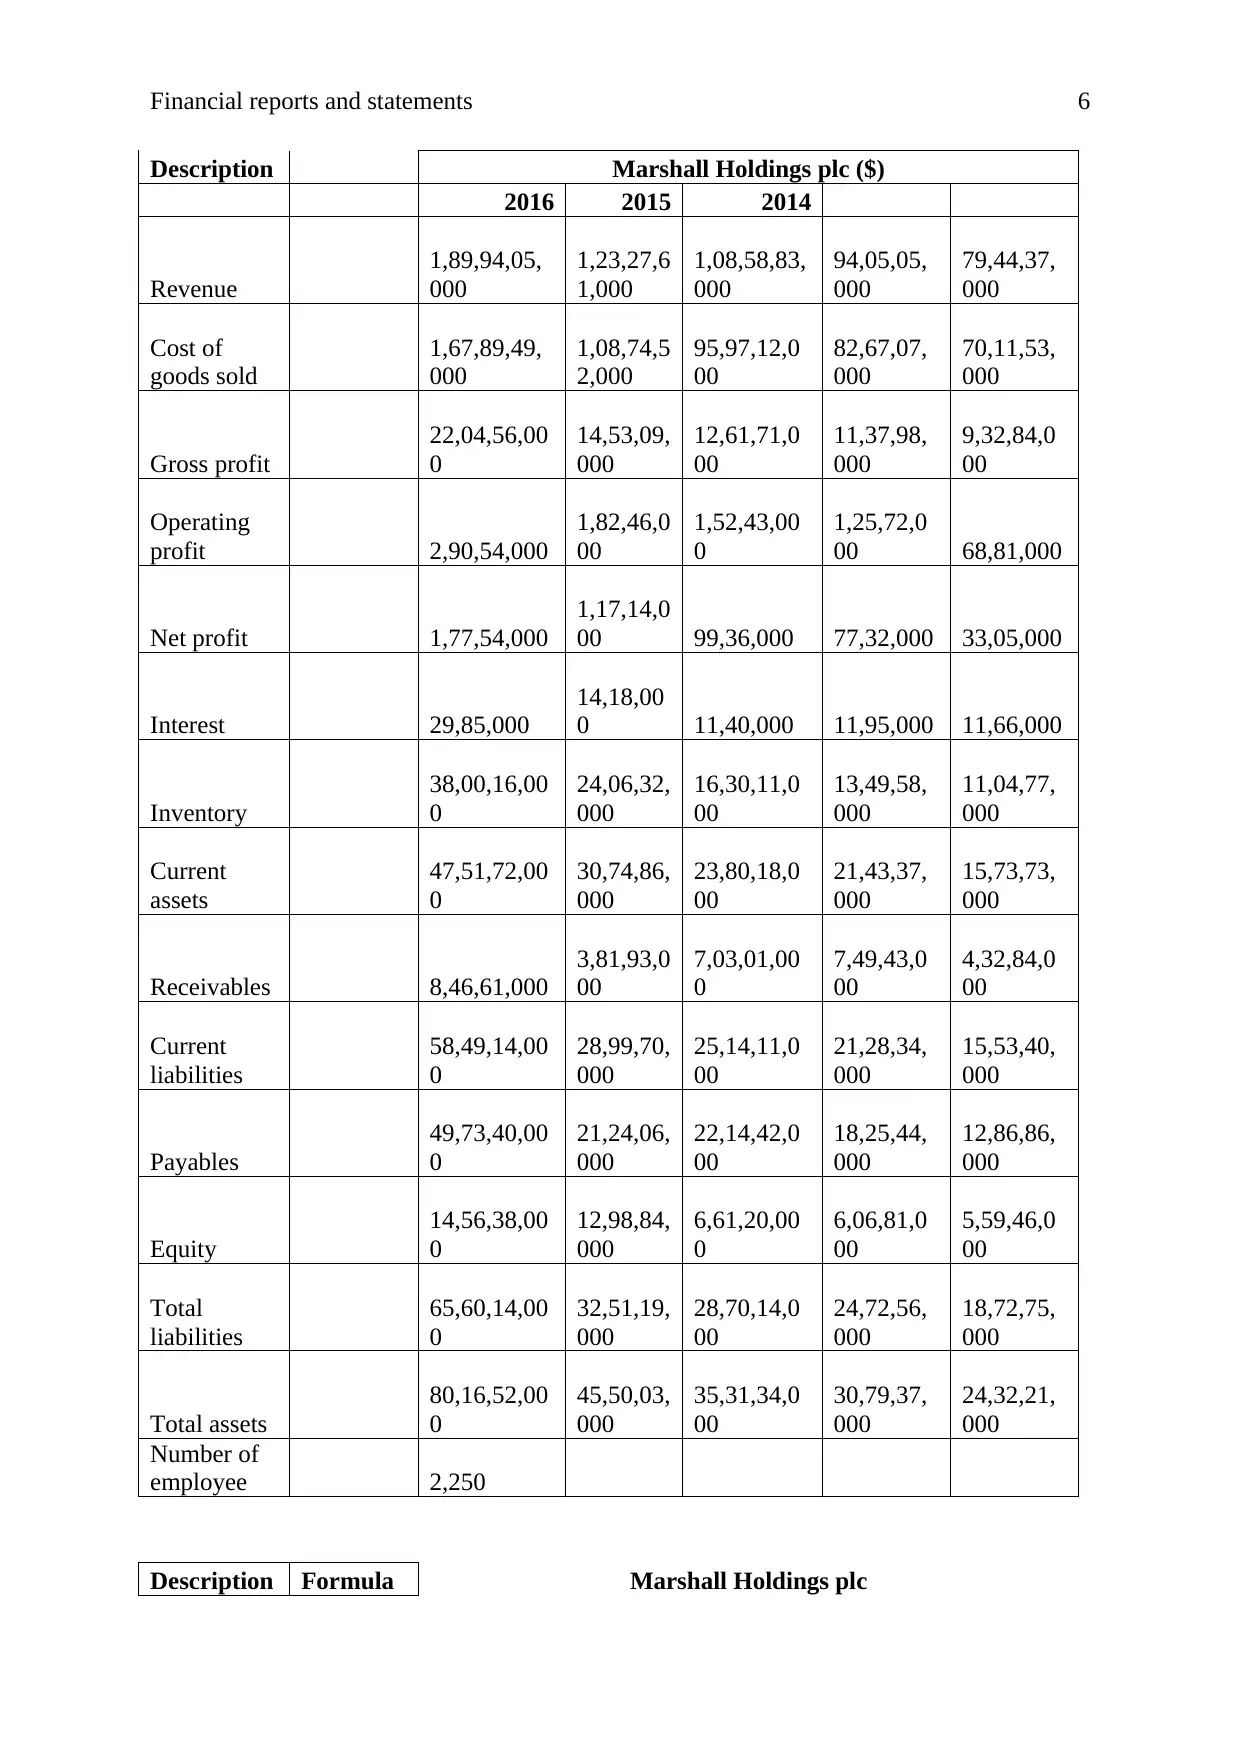
Ratio analysis:
Further, the study has been done over the liquidity position; solvency position, debt
position and the profitability position of the organization to identify the changes which have
taken place into the organization of the company. Following are the calculations of the ratio
analysis of the company:
Financial Data
these changes have impacted the position of the company. Following are the few changes
which have taken place into the position of the company:
Calculation of the increment
2016 2015
Sales 1899405000 1232761000 54.08%
Operating profit 29054000 18246000 59.23%
Earnings 17762000 11721000 51.54%
Dividend payment 3251000 15448000 -78.96%
Market
capitalization 145638000 129884000 12.13%
Operating cash flow 80309000 25493000 215.02%
Capital expenditure 40754000 -2169000
-
1978.93%
Debt increment 85444000 28642000 198.32%
(Palicka, 2011)
The above statement and the table depict that various changes have taken place into
the position and the performance of the company. Through this analysis, it has been evaluated
that how this position have impacted the performance of the company. From the above table,
it has been found that the sales of the company have been enhanced in 2016 from 2015 by
54.08%. Further, it has also been found that the operating profit has also been enhanced with
the increment in the sales. More, the earnings of the company have also been enhanced due to
good increment in the total revenue of the company (Madhura, 2014).
More, it has also been found that the company has reduced the level of the dividend
payment to manage the funds in the organization. This has helped the comapny to raise the
funds through internal sources. More, the cash flow of the company in terms of operating
aspects has also been enhanced by 215.02%. And lastly, the study over capital expenditure
and debt increment depict that the organization has enhanced the funds through debt to
diversify the market and the expenditure of the company has also been enhanced.
Ratio analysis:
Further, the study has been done over the liquidity position; solvency position, debt
position and the profitability position of the organization to identify the changes which have
taken place into the organization of the company. Following are the calculations of the ratio
analysis of the company:
Financial Data
Financial reports and statements 6
Description Marshall Holdings plc ($)
2016 2015 2014
Revenue
1,89,94,05,
000
1,23,27,6
1,000
1,08,58,83,
000
94,05,05,
000
79,44,37,
000
Cost of
goods sold
1,67,89,49,
000
1,08,74,5
2,000
95,97,12,0
00
82,67,07,
000
70,11,53,
000
Gross profit
22,04,56,00
0
14,53,09,
000
12,61,71,0
00
11,37,98,
000
9,32,84,0
00
Operating
profit 2,90,54,000
1,82,46,0
00
1,52,43,00
0
1,25,72,0
00 68,81,000
Net profit 1,77,54,000
1,17,14,0
00 99,36,000 77,32,000 33,05,000
Interest 29,85,000
14,18,00
0 11,40,000 11,95,000 11,66,000
Inventory
38,00,16,00
0
24,06,32,
000
16,30,11,0
00
13,49,58,
000
11,04,77,
000
Current
assets
47,51,72,00
0
30,74,86,
000
23,80,18,0
00
21,43,37,
000
15,73,73,
000
Receivables 8,46,61,000
3,81,93,0
00
7,03,01,00
0
7,49,43,0
00
4,32,84,0
00
Current
liabilities
58,49,14,00
0
28,99,70,
000
25,14,11,0
00
21,28,34,
000
15,53,40,
000
Payables
49,73,40,00
0
21,24,06,
000
22,14,42,0
00
18,25,44,
000
12,86,86,
000
Equity
14,56,38,00
0
12,98,84,
000
6,61,20,00
0
6,06,81,0
00
5,59,46,0
00
Total
liabilities
65,60,14,00
0
32,51,19,
000
28,70,14,0
00
24,72,56,
000
18,72,75,
000
Total assets
80,16,52,00
0
45,50,03,
000
35,31,34,0
00
30,79,37,
000
24,32,21,
000
Number of
employee 2,250
Description Formula Marshall Holdings plc
⊘ This is a preview!⊘
Do you want full access?
Subscribe today to unlock all pages.
Trusted by 1+ million students worldwide
Financial reports and statements 7
2016 2015 2014 2013 2012
Profitabilit
y
Net margin
Net
profit/reve
nues 0.93% 0.95% 0.92% 0.82% 0.42%
Return on
equity
Net
profit/Equ
ity 12.19% 9.02% 15.03% 12.74% 5.91%
Sales
employee
Sales /
number of
employee 844180
Liquidity
Current ratio
Current
assets/curr
ent
liabilities 0.81 1.06 0.95 1.01 1.01
Acid test
Current
assets-
Inventory/
current
liabilities 0.16 0.23 0.30 0.37 0.30
Efficiency
Receivables
collection
period
Receivabl
es/ Total
sales*365 16.27 11.31 23.63 29.08 19.89
Payables
collection
period
Payables/
Cost of
sales*365 108.12 71.29 84.22 80.60 66.99
Asset
turnover
ratio
Total
sales/
Total
assets 2.37 2.71 3.07 3.05 3.27
Solvency
Debt to
Equity Ratio
Debt/
Equity 4.50 2.50 4.34 4.07 3.35
Debt to
assets
Debt/
Total
assets 0.82 0.71 0.81 0.80 0.77
Interest
cover
EBIT /
interest
expenses 9.73 12.87 13.37 10.52 5.90
Paraphrase This Document
Need a fresh take? Get an instant paraphrase of this document with our AI Paraphraser
Financial reports and statements 8
Gearing
ratio
Long term
liabilities
/ capital
employed 0.22 0.24 0.31 0.37 0.37
Return on
capital
employed
Operating
profit /
total
assets -
current
liabilities 0.41 0.52 0.43 0.37 0.22
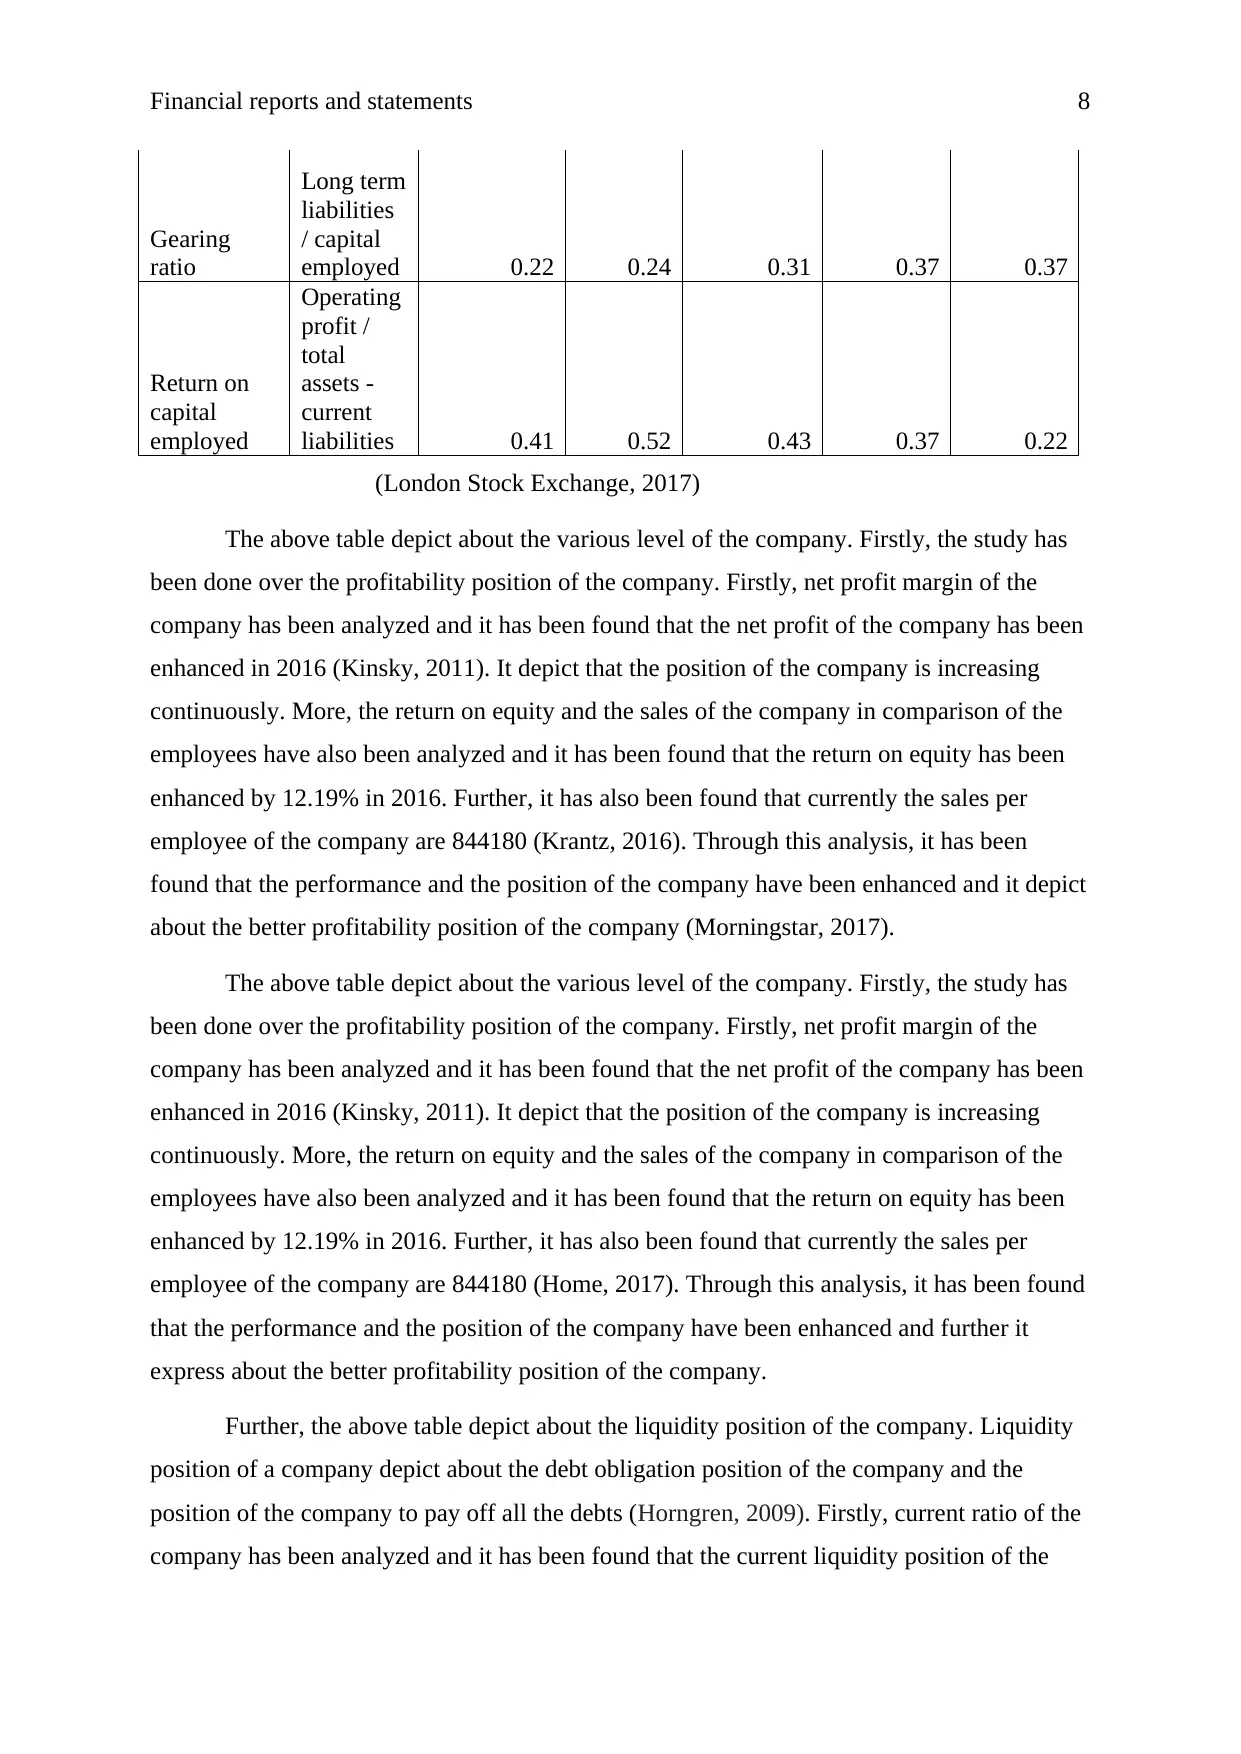
(London Stock Exchange, 2017)
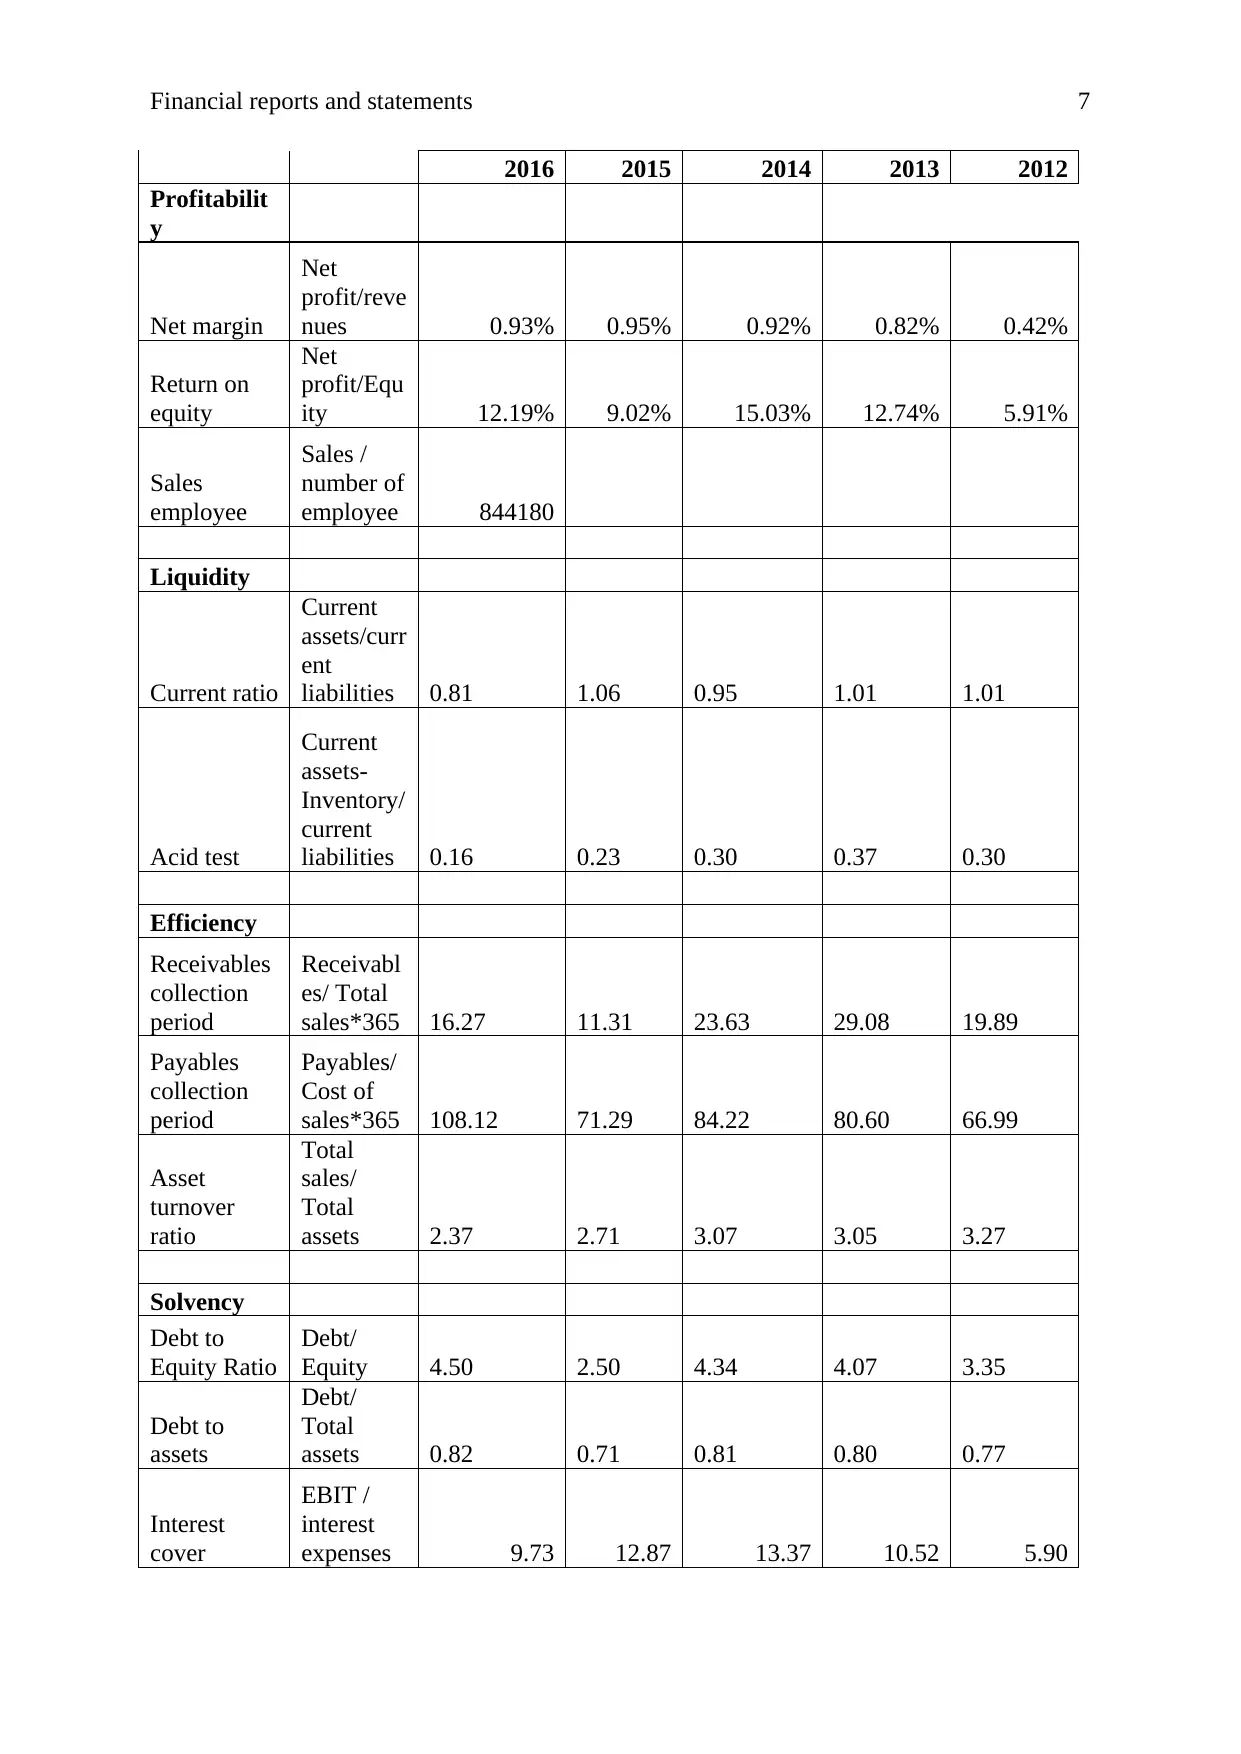
The above table depict about the various level of the company. Firstly, the study has
been done over the profitability position of the company. Firstly, net profit margin of the
company has been analyzed and it has been found that the net profit of the company has been
enhanced in 2016 (Kinsky, 2011). It depict that the position of the company is increasing
continuously. More, the return on equity and the sales of the company in comparison of the
employees have also been analyzed and it has been found that the return on equity has been
enhanced by 12.19% in 2016. Further, it has also been found that currently the sales per
employee of the company are 844180 (Krantz, 2016). Through this analysis, it has been
found that the performance and the position of the company have been enhanced and it depict
about the better profitability position of the company (Morningstar, 2017).
The above table depict about the various level of the company. Firstly, the study has
been done over the profitability position of the company. Firstly, net profit margin of the
company has been analyzed and it has been found that the net profit of the company has been
enhanced in 2016 (Kinsky, 2011). It depict that the position of the company is increasing
continuously. More, the return on equity and the sales of the company in comparison of the
employees have also been analyzed and it has been found that the return on equity has been
enhanced by 12.19% in 2016. Further, it has also been found that currently the sales per
employee of the company are 844180 (Home, 2017). Through this analysis, it has been found
that the performance and the position of the company have been enhanced and further it
express about the better profitability position of the company.
Further, the above table depict about the liquidity position of the company. Liquidity
position of a company depict about the debt obligation position of the company and the
position of the company to pay off all the debts (Horngren, 2009). Firstly, current ratio of the
company has been analyzed and it has been found that the current liquidity position of the
Gearing
ratio
Long term
liabilities
/ capital
employed 0.22 0.24 0.31 0.37 0.37
Return on
capital
employed
Operating
profit /
total
assets -
current
liabilities 0.41 0.52 0.43 0.37 0.22
(London Stock Exchange, 2017)
The above table depict about the various level of the company. Firstly, the study has
been done over the profitability position of the company. Firstly, net profit margin of the
company has been analyzed and it has been found that the net profit of the company has been
enhanced in 2016 (Kinsky, 2011). It depict that the position of the company is increasing
continuously. More, the return on equity and the sales of the company in comparison of the
employees have also been analyzed and it has been found that the return on equity has been
enhanced by 12.19% in 2016. Further, it has also been found that currently the sales per
employee of the company are 844180 (Krantz, 2016). Through this analysis, it has been
found that the performance and the position of the company have been enhanced and it depict
about the better profitability position of the company (Morningstar, 2017).
The above table depict about the various level of the company. Firstly, the study has
been done over the profitability position of the company. Firstly, net profit margin of the
company has been analyzed and it has been found that the net profit of the company has been
enhanced in 2016 (Kinsky, 2011). It depict that the position of the company is increasing
continuously. More, the return on equity and the sales of the company in comparison of the
employees have also been analyzed and it has been found that the return on equity has been
enhanced by 12.19% in 2016. Further, it has also been found that currently the sales per
employee of the company are 844180 (Home, 2017). Through this analysis, it has been found
that the performance and the position of the company have been enhanced and further it
express about the better profitability position of the company.
Further, the above table depict about the liquidity position of the company. Liquidity
position of a company depict about the debt obligation position of the company and the
position of the company to pay off all the debts (Horngren, 2009). Firstly, current ratio of the
company has been analyzed and it has been found that the current liquidity position of the
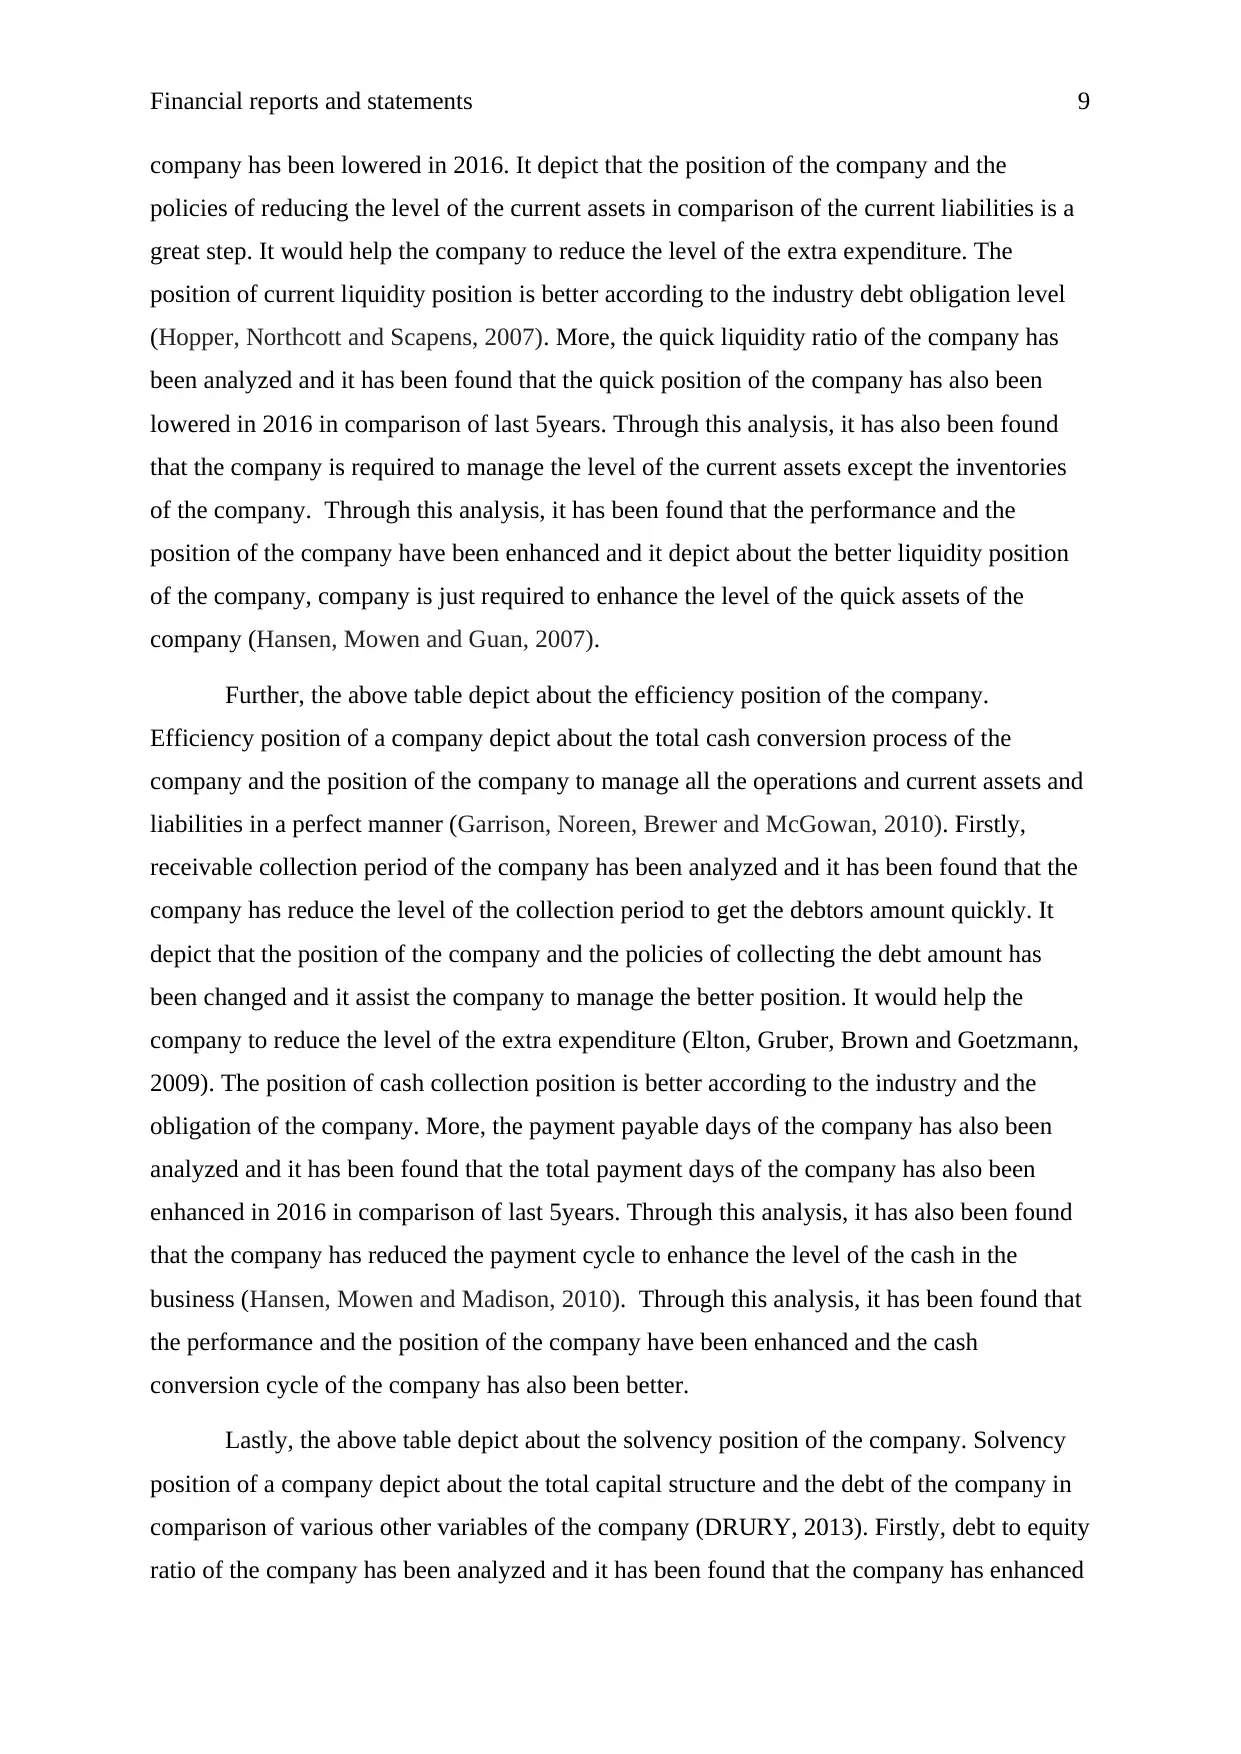
Financial reports and statements 9
company has been lowered in 2016. It depict that the position of the company and the
policies of reducing the level of the current assets in comparison of the current liabilities is a
great step. It would help the company to reduce the level of the extra expenditure. The
position of current liquidity position is better according to the industry debt obligation level
(Hopper, Northcott and Scapens, 2007). More, the quick liquidity ratio of the company has
been analyzed and it has been found that the quick position of the company has also been
lowered in 2016 in comparison of last 5years. Through this analysis, it has also been found
that the company is required to manage the level of the current assets except the inventories
of the company. Through this analysis, it has been found that the performance and the
position of the company have been enhanced and it depict about the better liquidity position
of the company, company is just required to enhance the level of the quick assets of the
company (Hansen, Mowen and Guan, 2007).
Further, the above table depict about the efficiency position of the company.
Efficiency position of a company depict about the total cash conversion process of the
company and the position of the company to manage all the operations and current assets and
liabilities in a perfect manner (Garrison, Noreen, Brewer and McGowan, 2010). Firstly,
receivable collection period of the company has been analyzed and it has been found that the
company has reduce the level of the collection period to get the debtors amount quickly. It
depict that the position of the company and the policies of collecting the debt amount has
been changed and it assist the company to manage the better position. It would help the
company to reduce the level of the extra expenditure (Elton, Gruber, Brown and Goetzmann,
2009). The position of cash collection position is better according to the industry and the
obligation of the company. More, the payment payable days of the company has also been
analyzed and it has been found that the total payment days of the company has also been
enhanced in 2016 in comparison of last 5years. Through this analysis, it has also been found
that the company has reduced the payment cycle to enhance the level of the cash in the
business (Hansen, Mowen and Madison, 2010). Through this analysis, it has been found that
the performance and the position of the company have been enhanced and the cash
conversion cycle of the company has also been better.
Lastly, the above table depict about the solvency position of the company. Solvency
position of a company depict about the total capital structure and the debt of the company in
comparison of various other variables of the company (DRURY, 2013). Firstly, debt to equity
ratio of the company has been analyzed and it has been found that the company has enhanced
⊘ This is a preview!⊘
Do you want full access?
Subscribe today to unlock all pages.
Trusted by 1+ million students worldwide
Financial reports and statements 10
the level of the debt in comparison on the equity to reduce the level of the cost in the
company. It depict that the position of the company and the policies of managing the debt and
equity has been changed but it has impacted over the risk level of the company (Bhimani,
Horngren, Datar and Foster, 2008). Further, the debt to assets level of the company has also
been analyzed and it has been found that the debt level of the company has enhanced in
comparison of total assets in last 5 years. Through this analysis, it has also been found that
the company has managed the debt, equity and total assets level to manage the performance
and the position of the company. Through this analysis, it has been found that the
performance and the position of the company have been enhanced and the company is
required to reduce the level of the debt and equity.
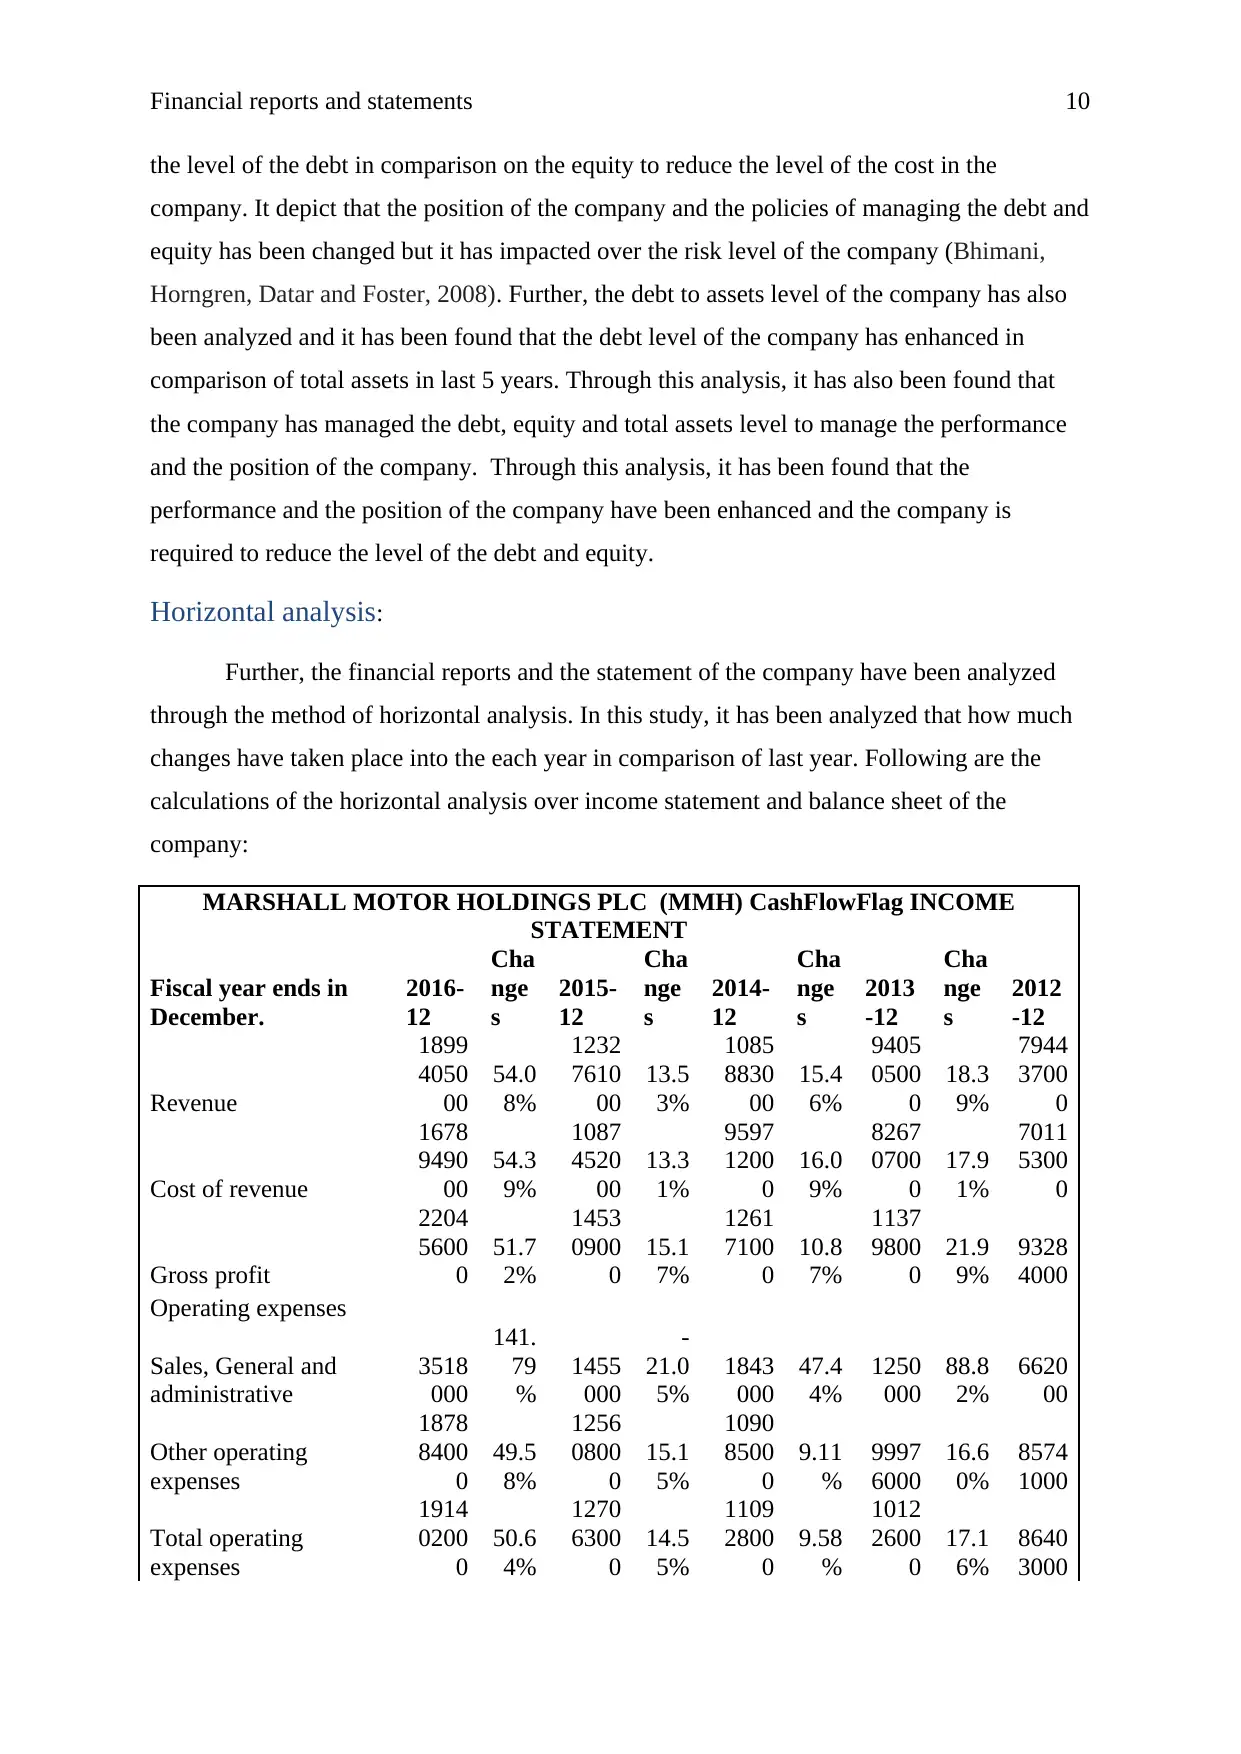
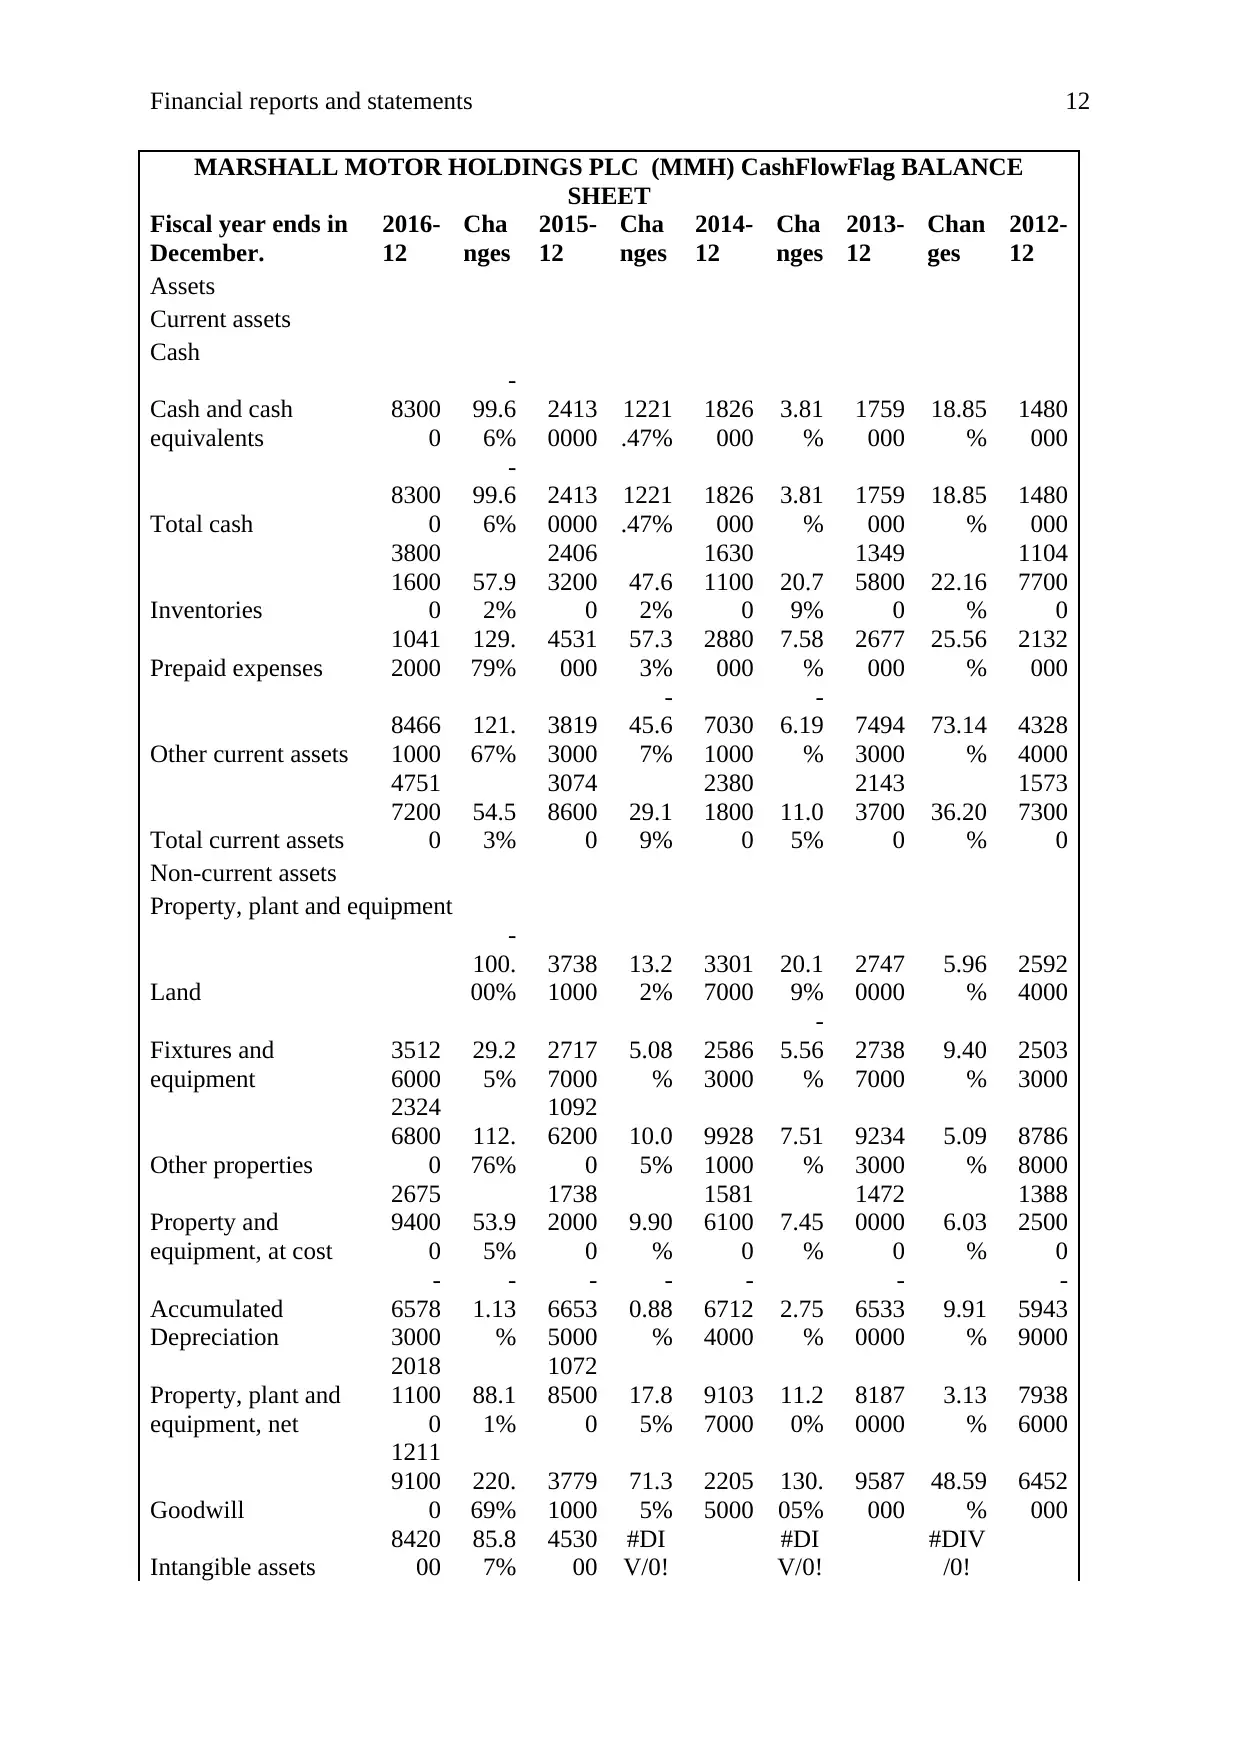
Horizontal analysis:
Further, the financial reports and the statement of the company have been analyzed
through the method of horizontal analysis. In this study, it has been analyzed that how much
changes have taken place into the each year in comparison of last year. Following are the
calculations of the horizontal analysis over income statement and balance sheet of the
company:
MARSHALL MOTOR HOLDINGS PLC (MMH) CashFlowFlag INCOME
STATEMENT
Fiscal year ends in
December.
2016-
12
Cha
nge
s
2015-
12
Cha
nge
s
2014-
12
Cha
nge
s
2013
-12
Cha
nge
s
2012
-12
Revenue
1899
4050
00
54.0
8%
1232
7610
00
13.5
3%
1085
8830
00
15.4
6%
9405
0500
0
18.3
9%
7944
3700
0
Cost of revenue
1678
9490
00
54.3
9%
1087
4520
00
13.3
1%
9597
1200
0
16.0
9%
8267
0700
0
17.9
1%
7011
5300
0
Gross profit
2204
5600
0
51.7
2%
1453
0900
0
15.1
7%
1261
7100
0
10.8
7%
1137
9800
0
21.9
9%
9328
4000
Operating expenses
Sales, General and
administrative
3518
000
141.
79
%
1455
000
-
21.0
5%
1843
000
47.4
4%
1250
000
88.8
2%
6620
00
Other operating
expenses
1878
8400
0
49.5
8%
1256
0800
0
15.1
5%
1090
8500
0
9.11
%
9997
6000
16.6
0%
8574
1000
Total operating
expenses
1914
0200
0
50.6
4%
1270
6300
0
14.5
5%
1109
2800
0
9.58
%
1012
2600
0
17.1
6%
8640
3000
the level of the debt in comparison on the equity to reduce the level of the cost in the
company. It depict that the position of the company and the policies of managing the debt and
equity has been changed but it has impacted over the risk level of the company (Bhimani,
Horngren, Datar and Foster, 2008). Further, the debt to assets level of the company has also
been analyzed and it has been found that the debt level of the company has enhanced in
comparison of total assets in last 5 years. Through this analysis, it has also been found that
the company has managed the debt, equity and total assets level to manage the performance
and the position of the company. Through this analysis, it has been found that the
performance and the position of the company have been enhanced and the company is
required to reduce the level of the debt and equity.
Horizontal analysis:
Further, the financial reports and the statement of the company have been analyzed
through the method of horizontal analysis. In this study, it has been analyzed that how much
changes have taken place into the each year in comparison of last year. Following are the
calculations of the horizontal analysis over income statement and balance sheet of the
company:
MARSHALL MOTOR HOLDINGS PLC (MMH) CashFlowFlag INCOME
STATEMENT
Fiscal year ends in
December.
2016-
12
Cha
nge
s
2015-
12
Cha
nge
s
2014-
12
Cha
nge
s
2013
-12
Cha
nge
s
2012
-12
Revenue
1899
4050
00
54.0
8%
1232
7610
00
13.5
3%
1085
8830
00
15.4
6%
9405
0500
0
18.3
9%
7944
3700
0
Cost of revenue
1678
9490
00
54.3
9%
1087
4520
00
13.3
1%
9597
1200
0
16.0
9%
8267
0700
0
17.9
1%
7011
5300
0
Gross profit
2204
5600
0
51.7
2%
1453
0900
0
15.1
7%
1261
7100
0
10.8
7%
1137
9800
0
21.9
9%
9328
4000
Operating expenses
Sales, General and
administrative
3518
000
141.
79
%
1455
000
-
21.0
5%
1843
000
47.4
4%
1250
000
88.8
2%
6620
00
Other operating
expenses
1878
8400
0
49.5
8%
1256
0800
0
15.1
5%
1090
8500
0
9.11
%
9997
6000
16.6
0%
8574
1000
Total operating
expenses
1914
0200
0
50.6
4%
1270
6300
0
14.5
5%
1109
2800
0
9.58
%
1012
2600
0
17.1
6%
8640
3000
Paraphrase This Document
Need a fresh take? Get an instant paraphrase of this document with our AI Paraphraser
Financial reports and statements 11
Operating income
2905
4000
59.2
3%
1824
6000
19.7
0%
1524
3000
21.2
5%
1257
2000
82.7
1%
6881
000
Interest Expense
2985
000
110.
51
%
1418
000
24.3
9%
1140
000
-
4.60
%
1195
000
2.49
%
1166
000
Other income
(expense)
-
3918
000
167.
44
%
-
1465
000
21.0
7%
-
1210
000
3.95
%
-
1164
000
0.09
%
-
1163
000
Income before income
taxes
2215
1000
44.1
8%
1536
3000
19.1
6%
1289
3000
26.2
4%
1021
3000
124.
36
%
4552
000
Provision for income
taxes
4397
000
20.5
0%
3649
000
23.4
0%
2957
000
19.1
9%
2481
000
98.9
6%
1247
000
Minority interest -8000
14.2
9% -7000
133.
33
% -3000
0.00
%
-
3000
-
40.0
0%
-
5000
Other income -8000
14.2
9% -7000
133.
33
% -3000
0.00
%
-
3000
-
40.0
0%
-
5000
Net income from
continuing operations
1775
4000
51.5
6%
1171
4000
17.8
9%
9936
000
28.5
0%
7732
000
133.
95
%
3305
000
Other 8000
14.2
9% 7000
133.
33
% 3000
0.00
% 3000
-
40.0
0% 5000
Net income
1776
2000
51.5
4%
1172
1000
17.9
3%
9939
000
28.4
9%
7735
000
133.
69
%
3310
000
Net income available
to common
shareholders
1776
2000
51.5
4%
1172
1000
17.9
3%
9939
000
28.4
9%
7735
000
133.
69
%
3310
000
Earnings per share
Basic 0.23
15.0
0% 0.2
53.8
5% 0.13
30.0
0% 0.1
150.
00
% 0.04
Diluted 0.22
15.7
9% 0.19
46.1
5% 0.13
30.0
0% 0.1
150.
00
% 0.04
Weighted average shares
outstanding
Basic
7732
6970
30.1
2%
5942
5171
-
23.0
6%
7723
6263
0.00
%
7723
6263
0.00
%
7723
6263
Diluted
7950
0548
30.2
3%
6104
6875
-
20.9
6%
7723
6263
0.00
%
7723
6263
0.00
%
7723
6263
EBITDA
4936
9000
30.3
7%
3786
8000
8.11
%
3502
8000
9.40
%
3201
8000
30.3
4%
2456
5000
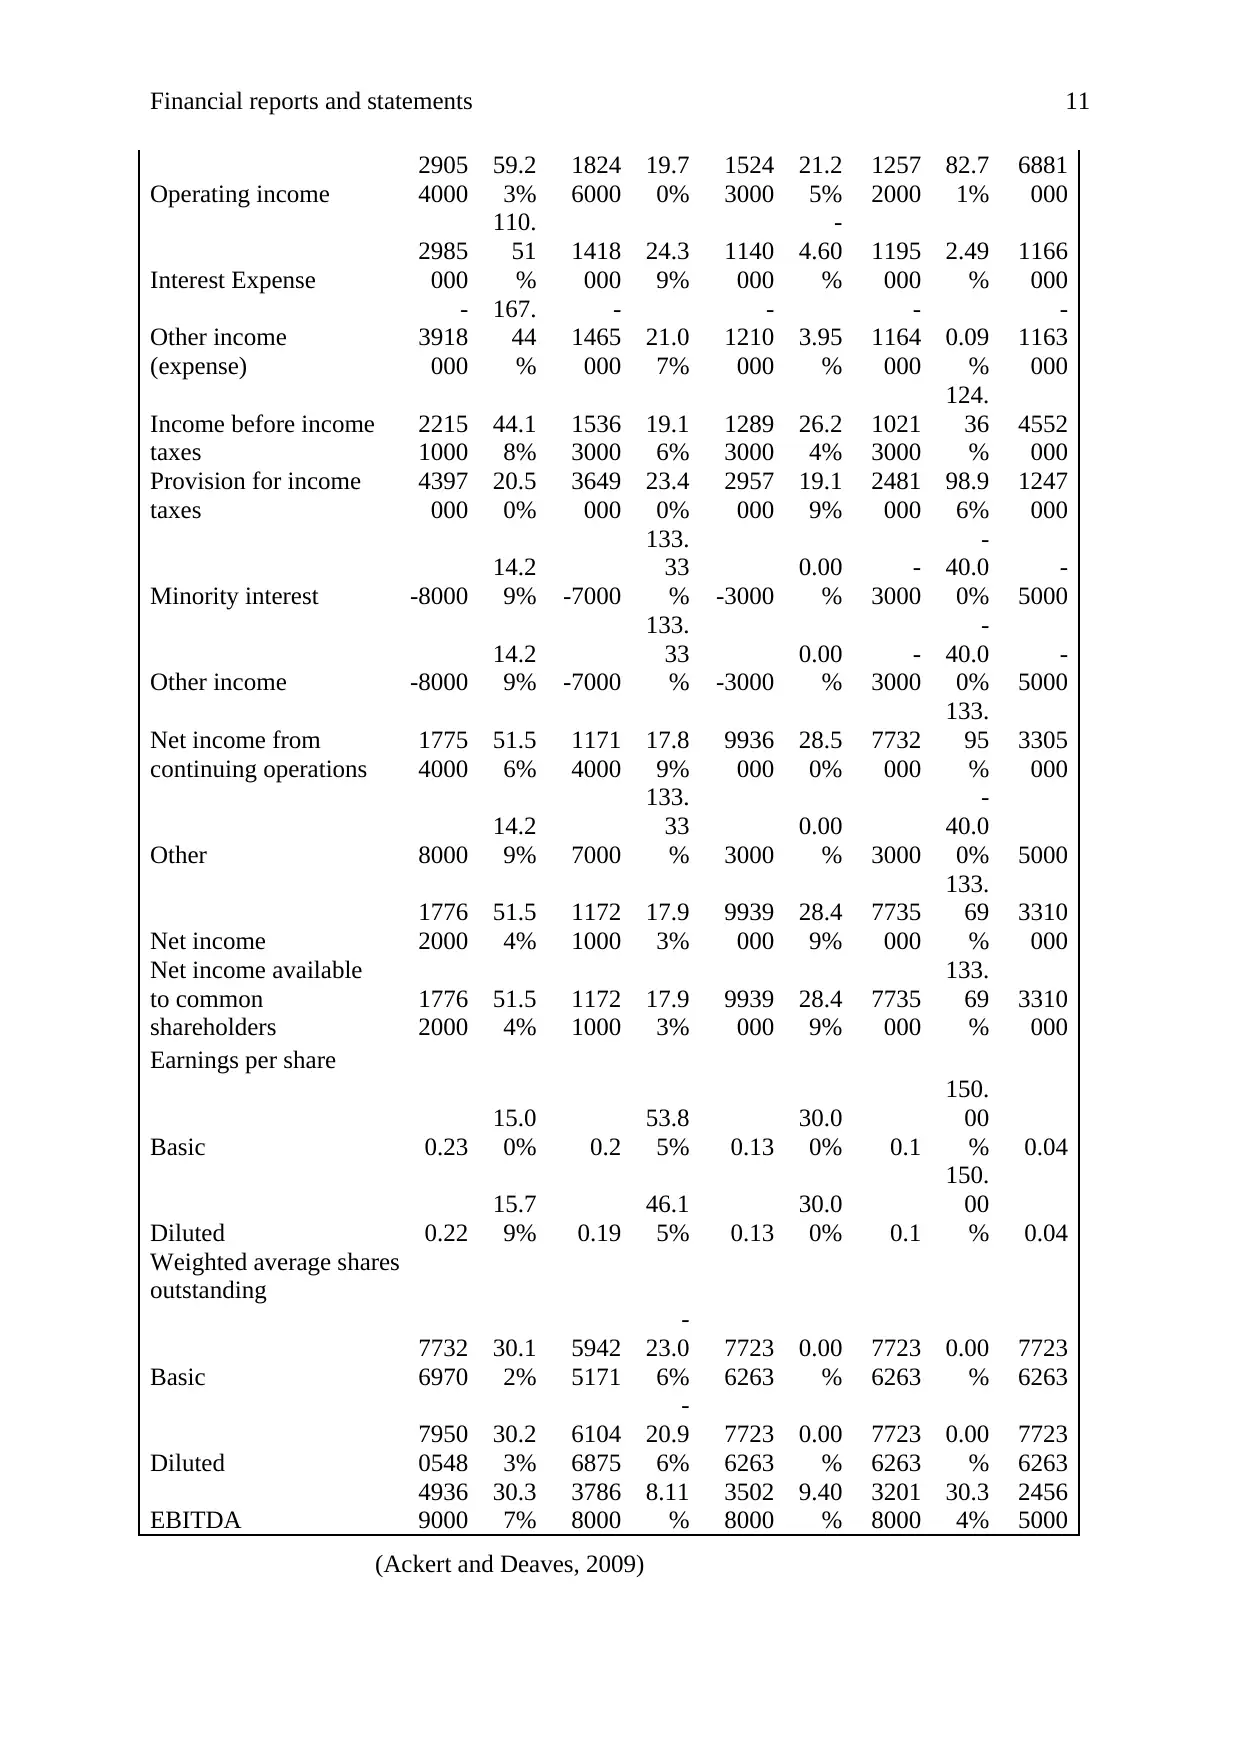
(Ackert and Deaves, 2009)
Operating income
2905
4000
59.2
3%
1824
6000
19.7
0%
1524
3000
21.2
5%
1257
2000
82.7
1%
6881
000
Interest Expense
2985
000
110.
51
%
1418
000
24.3
9%
1140
000
-
4.60
%
1195
000
2.49
%
1166
000
Other income
(expense)
-
3918
000
167.
44
%
-
1465
000
21.0
7%
-
1210
000
3.95
%
-
1164
000
0.09
%
-
1163
000
Income before income
taxes
2215
1000
44.1
8%
1536
3000
19.1
6%
1289
3000
26.2
4%
1021
3000
124.
36
%
4552
000
Provision for income
taxes
4397
000
20.5
0%
3649
000
23.4
0%
2957
000
19.1
9%
2481
000
98.9
6%
1247
000
Minority interest -8000
14.2
9% -7000
133.
33
% -3000
0.00
%
-
3000
-
40.0
0%
-
5000
Other income -8000
14.2
9% -7000
133.
33
% -3000
0.00
%
-
3000
-
40.0
0%
-
5000
Net income from
continuing operations
1775
4000
51.5
6%
1171
4000
17.8
9%
9936
000
28.5
0%
7732
000
133.
95
%
3305
000
Other 8000
14.2
9% 7000
133.
33
% 3000
0.00
% 3000
-
40.0
0% 5000
Net income
1776
2000
51.5
4%
1172
1000
17.9
3%
9939
000
28.4
9%
7735
000
133.
69
%
3310
000
Net income available
to common
shareholders
1776
2000
51.5
4%
1172
1000
17.9
3%
9939
000
28.4
9%
7735
000
133.
69
%
3310
000
Earnings per share
Basic 0.23
15.0
0% 0.2
53.8
5% 0.13
30.0
0% 0.1
150.
00
% 0.04
Diluted 0.22
15.7
9% 0.19
46.1
5% 0.13
30.0
0% 0.1
150.
00
% 0.04
Weighted average shares
outstanding
Basic
7732
6970
30.1
2%
5942
5171
-
23.0
6%
7723
6263
0.00
%
7723
6263
0.00
%
7723
6263
Diluted
7950
0548
30.2
3%
6104
6875
-
20.9
6%
7723
6263
0.00
%
7723
6263
0.00
%
7723
6263
EBITDA
4936
9000
30.3
7%
3786
8000
8.11
%
3502
8000
9.40
%
3201
8000
30.3
4%
2456
5000
(Ackert and Deaves, 2009)
Financial reports and statements 12
MARSHALL MOTOR HOLDINGS PLC (MMH) CashFlowFlag BALANCE
SHEET
Fiscal year ends in
December.
2016-
12
Cha
nges
2015-
12
Cha
nges
2014-
12
Cha
nges
2013-
12
Chan
ges
2012-
12
Assets
Current assets
Cash
Cash and cash
equivalents
8300
0
-
99.6
6%
2413
0000
1221
.47%
1826
000
3.81
%
1759
000
18.85
%
1480
000
Total cash
8300
0
-
99.6
6%
2413
0000
1221
.47%
1826
000
3.81
%
1759
000
18.85
%
1480
000
Inventories
3800
1600
0
57.9
2%
2406
3200
0
47.6
2%
1630
1100
0
20.7
9%
1349
5800
0
22.16
%
1104
7700
0
Prepaid expenses
1041
2000
129.
79%
4531
000
57.3
3%
2880
000
7.58
%
2677
000
25.56
%
2132
000
Other current assets
8466
1000
121.
67%
3819
3000
-
45.6
7%
7030
1000
-
6.19
%
7494
3000
73.14
%
4328
4000
Total current assets
4751
7200
0
54.5
3%
3074
8600
0
29.1
9%
2380
1800
0
11.0
5%
2143
3700
0
36.20
%
1573
7300
0
Non-current assets
Property, plant and equipment
Land
-
100.
00%
3738
1000
13.2
2%
3301
7000
20.1
9%
2747
0000
5.96
%
2592
4000
Fixtures and
equipment
3512
6000
29.2
5%
2717
7000
5.08
%
2586
3000
-
5.56
%
2738
7000
9.40
%
2503
3000
Other properties
2324
6800
0
112.
76%
1092
6200
0
10.0
5%
9928
1000
7.51
%
9234
3000
5.09
%
8786
8000
Property and
equipment, at cost
2675
9400
0
53.9
5%
1738
2000
0
9.90
%
1581
6100
0
7.45
%
1472
0000
0
6.03
%
1388
2500
0
Accumulated
Depreciation
-
6578
3000
-
1.13
%
-
6653
5000
-
0.88
%
-
6712
4000
2.75
%
-
6533
0000
9.91
%
-
5943
9000
Property, plant and
equipment, net
2018
1100
0
88.1
1%
1072
8500
0
17.8
5%
9103
7000
11.2
0%
8187
0000
3.13
%
7938
6000
Goodwill
1211
9100
0
220.
69%
3779
1000
71.3
5%
2205
5000
130.
05%
9587
000
48.59
%
6452
000
Intangible assets
8420
00
85.8
7%
4530
00
#DI
V/0!
#DI
V/0!
#DIV
/0!
⊘ This is a preview!⊘
Do you want full access?
Subscribe today to unlock all pages.
Trusted by 1+ million students worldwide
1 out of 21
Related Documents


Your All-in-One AI-Powered Toolkit for Academic Success.
+13062052269
info@desklib.com
Available 24*7 on WhatsApp / Email
![[object Object]](/_next/static/media/star-bottom.7253800d.svg)
Unlock your academic potential
Copyright © 2020–2026 A2Z Services. All Rights Reserved. Developed and managed by ZUCOL.