Analysis of Mastermind Limited Financial Statements 2018 & 2019 Report

Verified

Added on  2023/01/10

|28
|3162
|69
Report
AI Summary
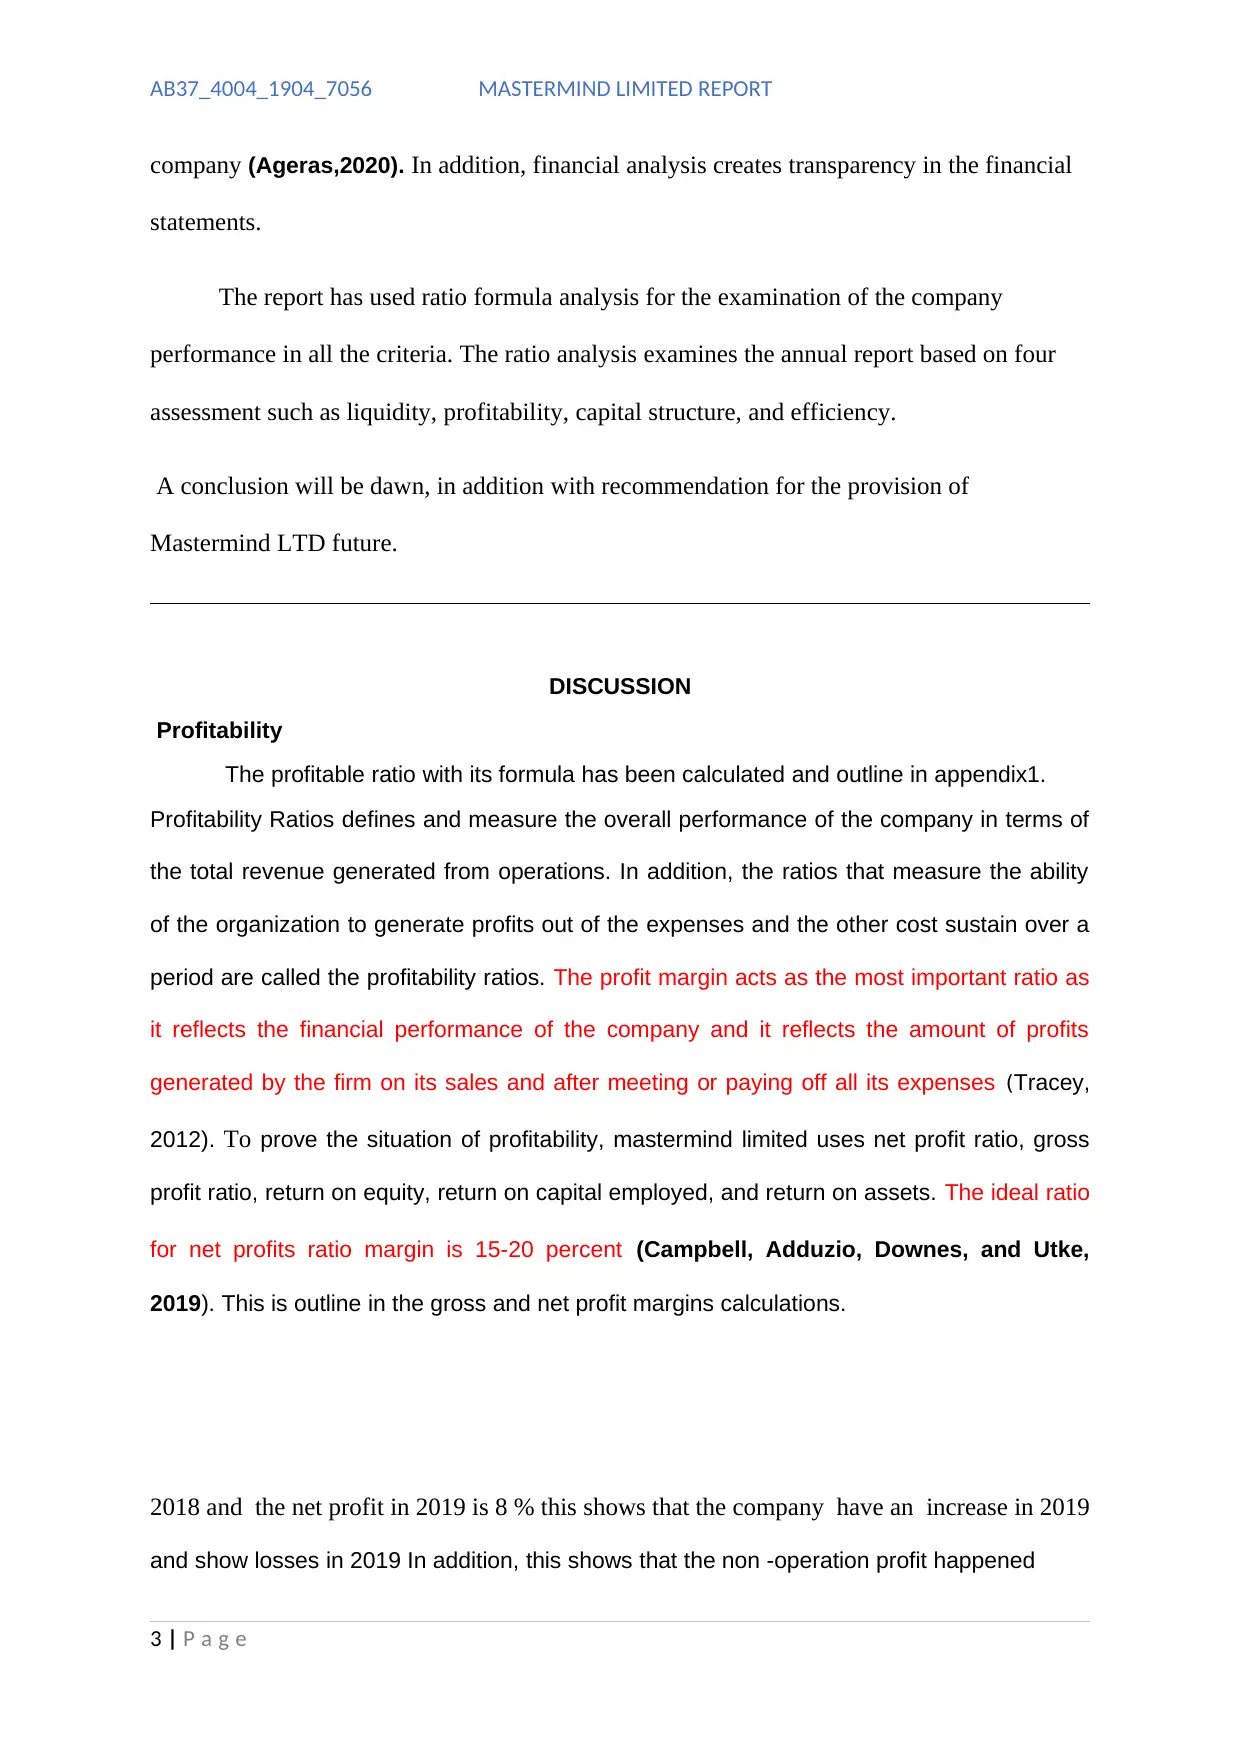
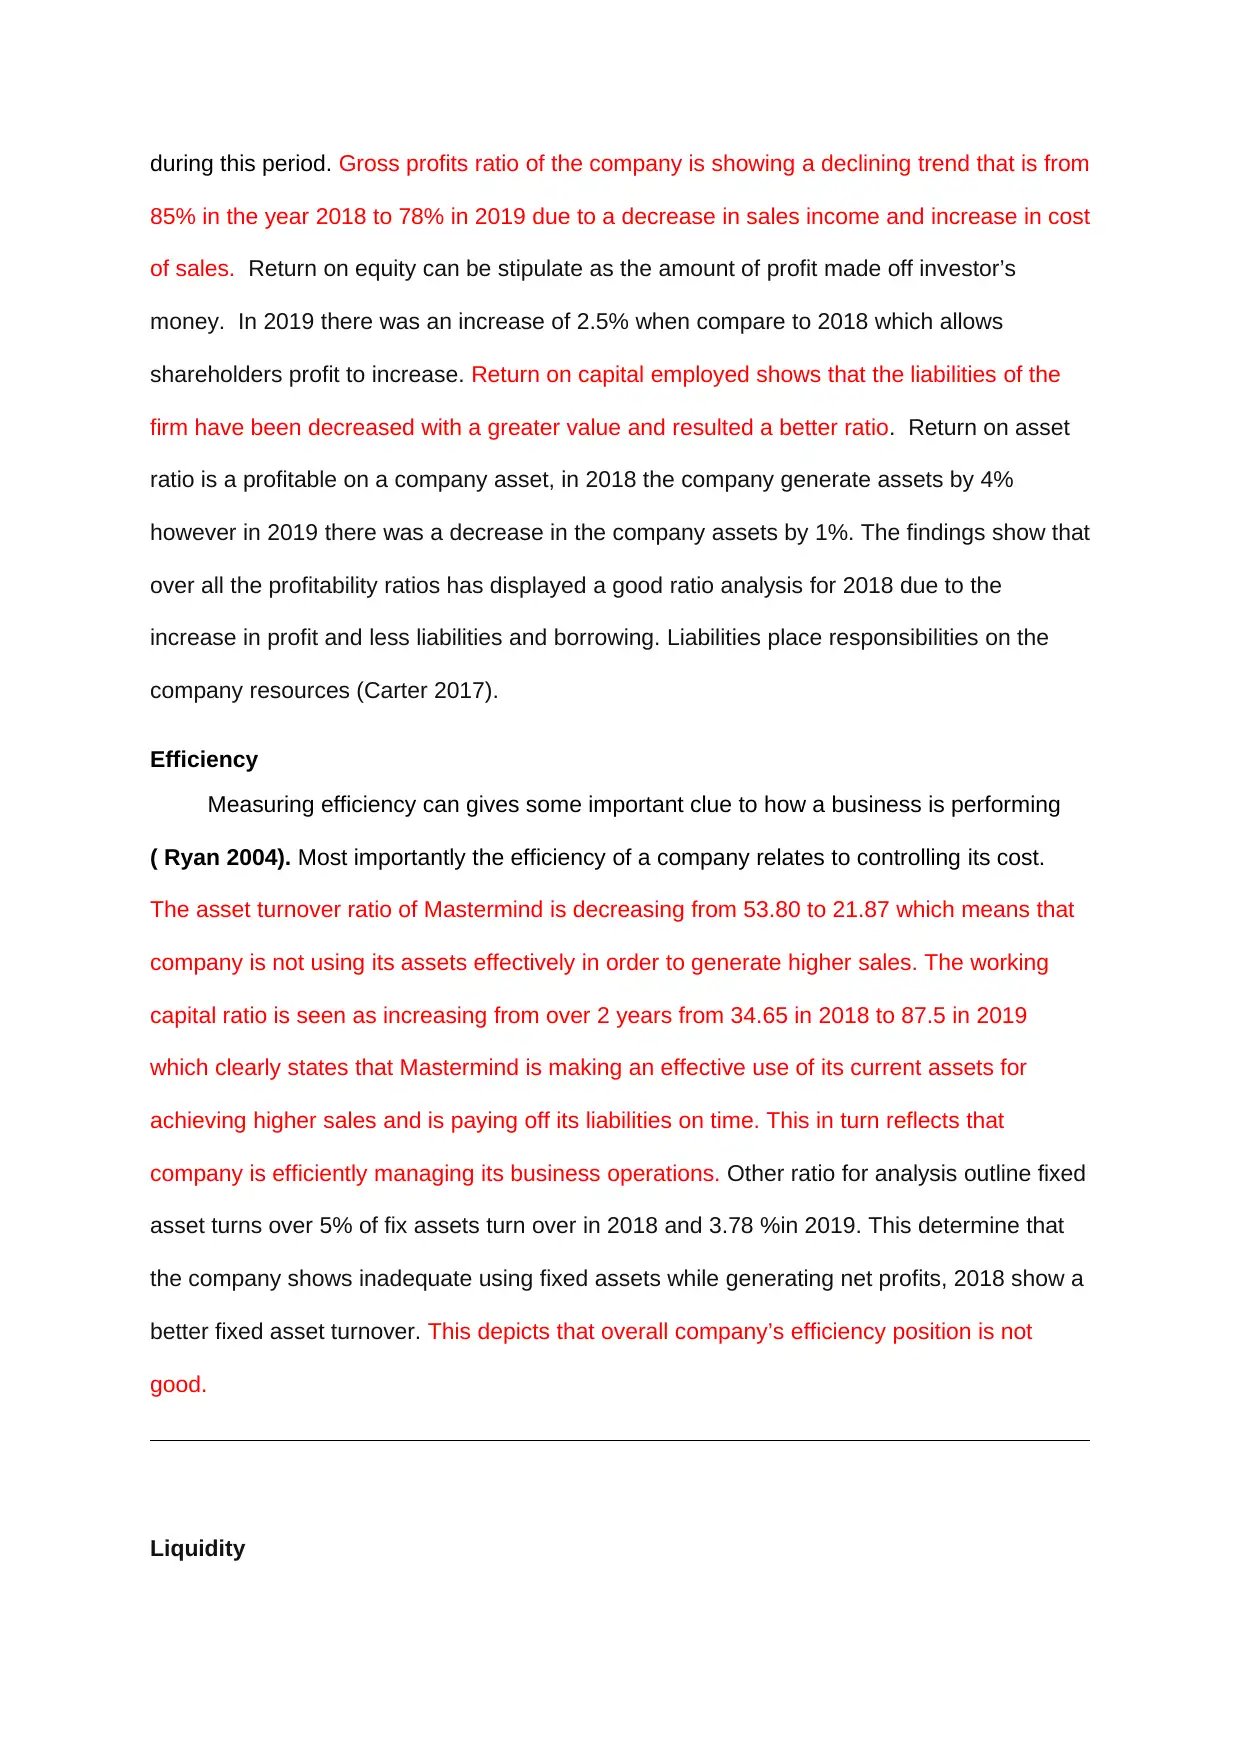
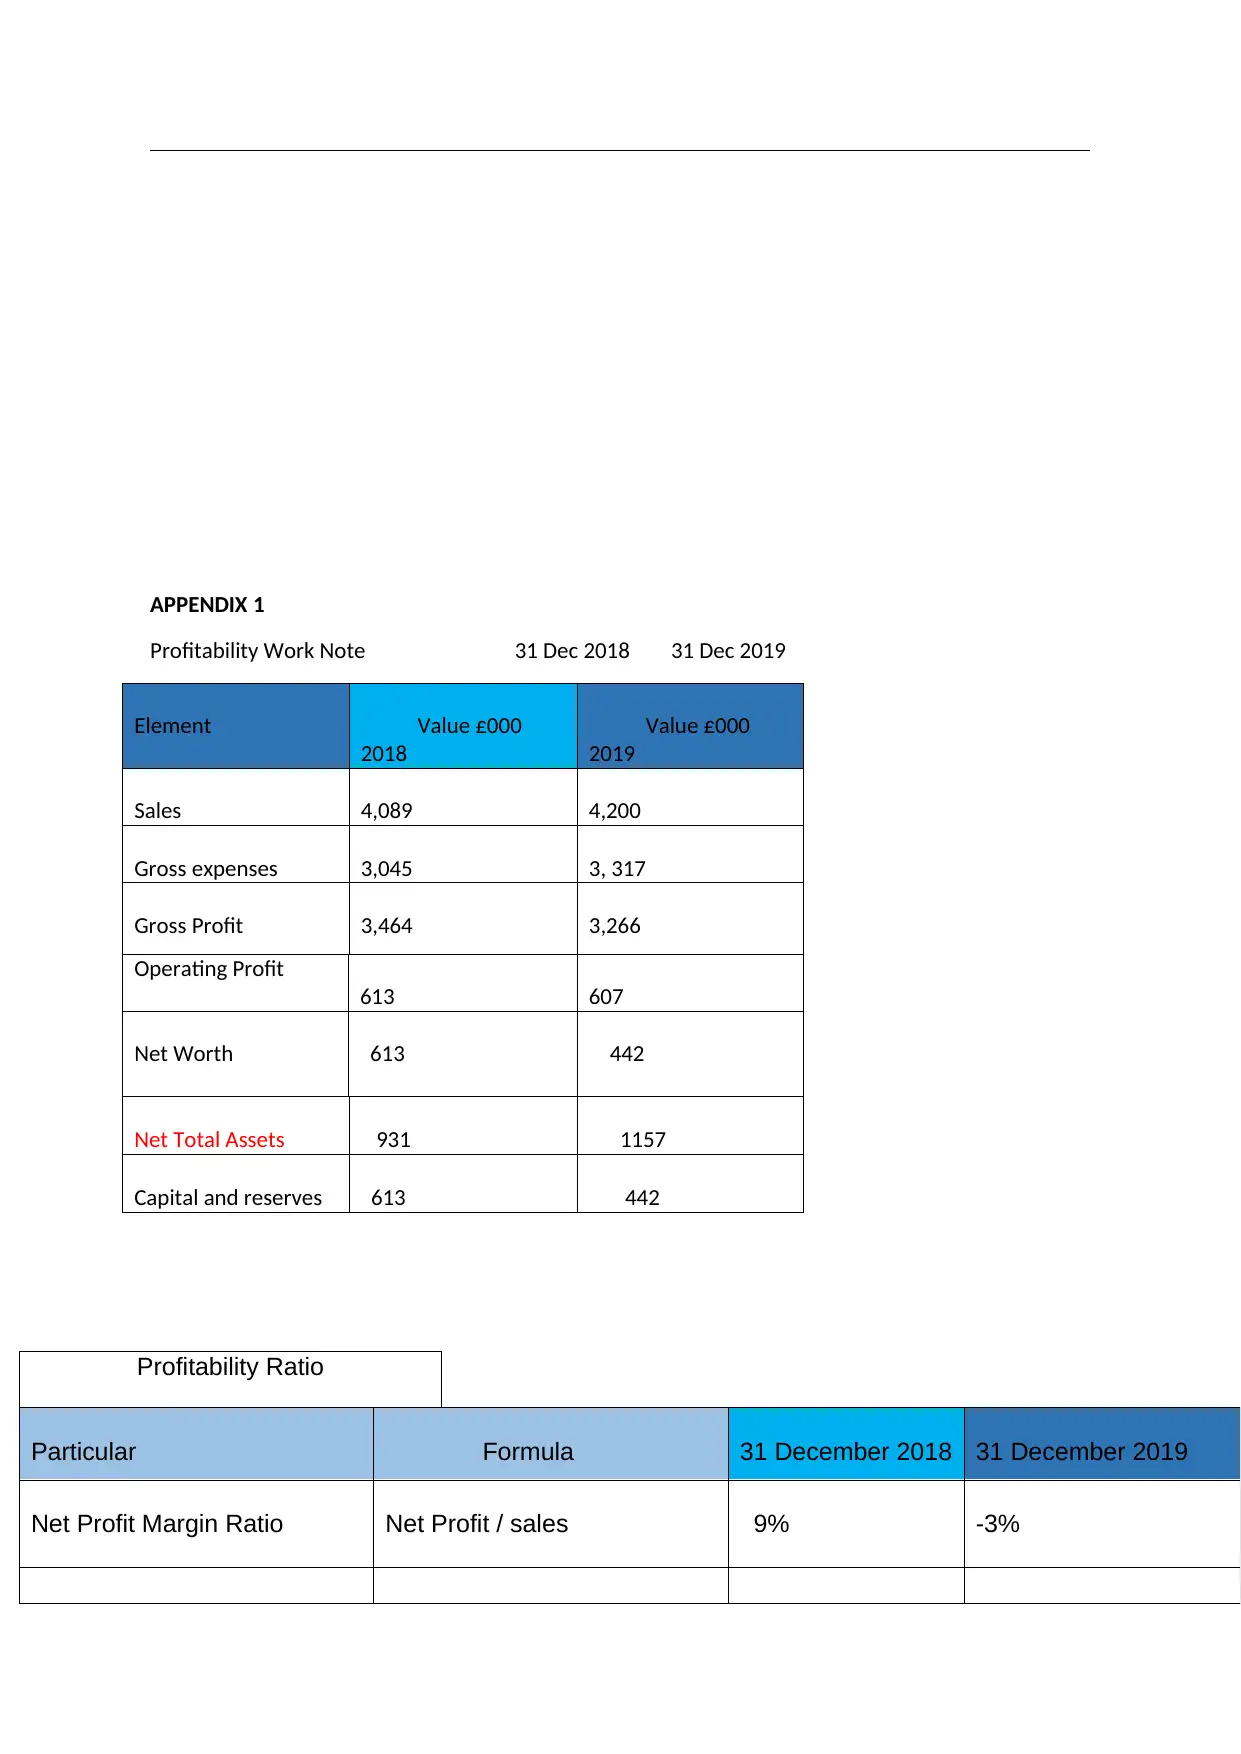
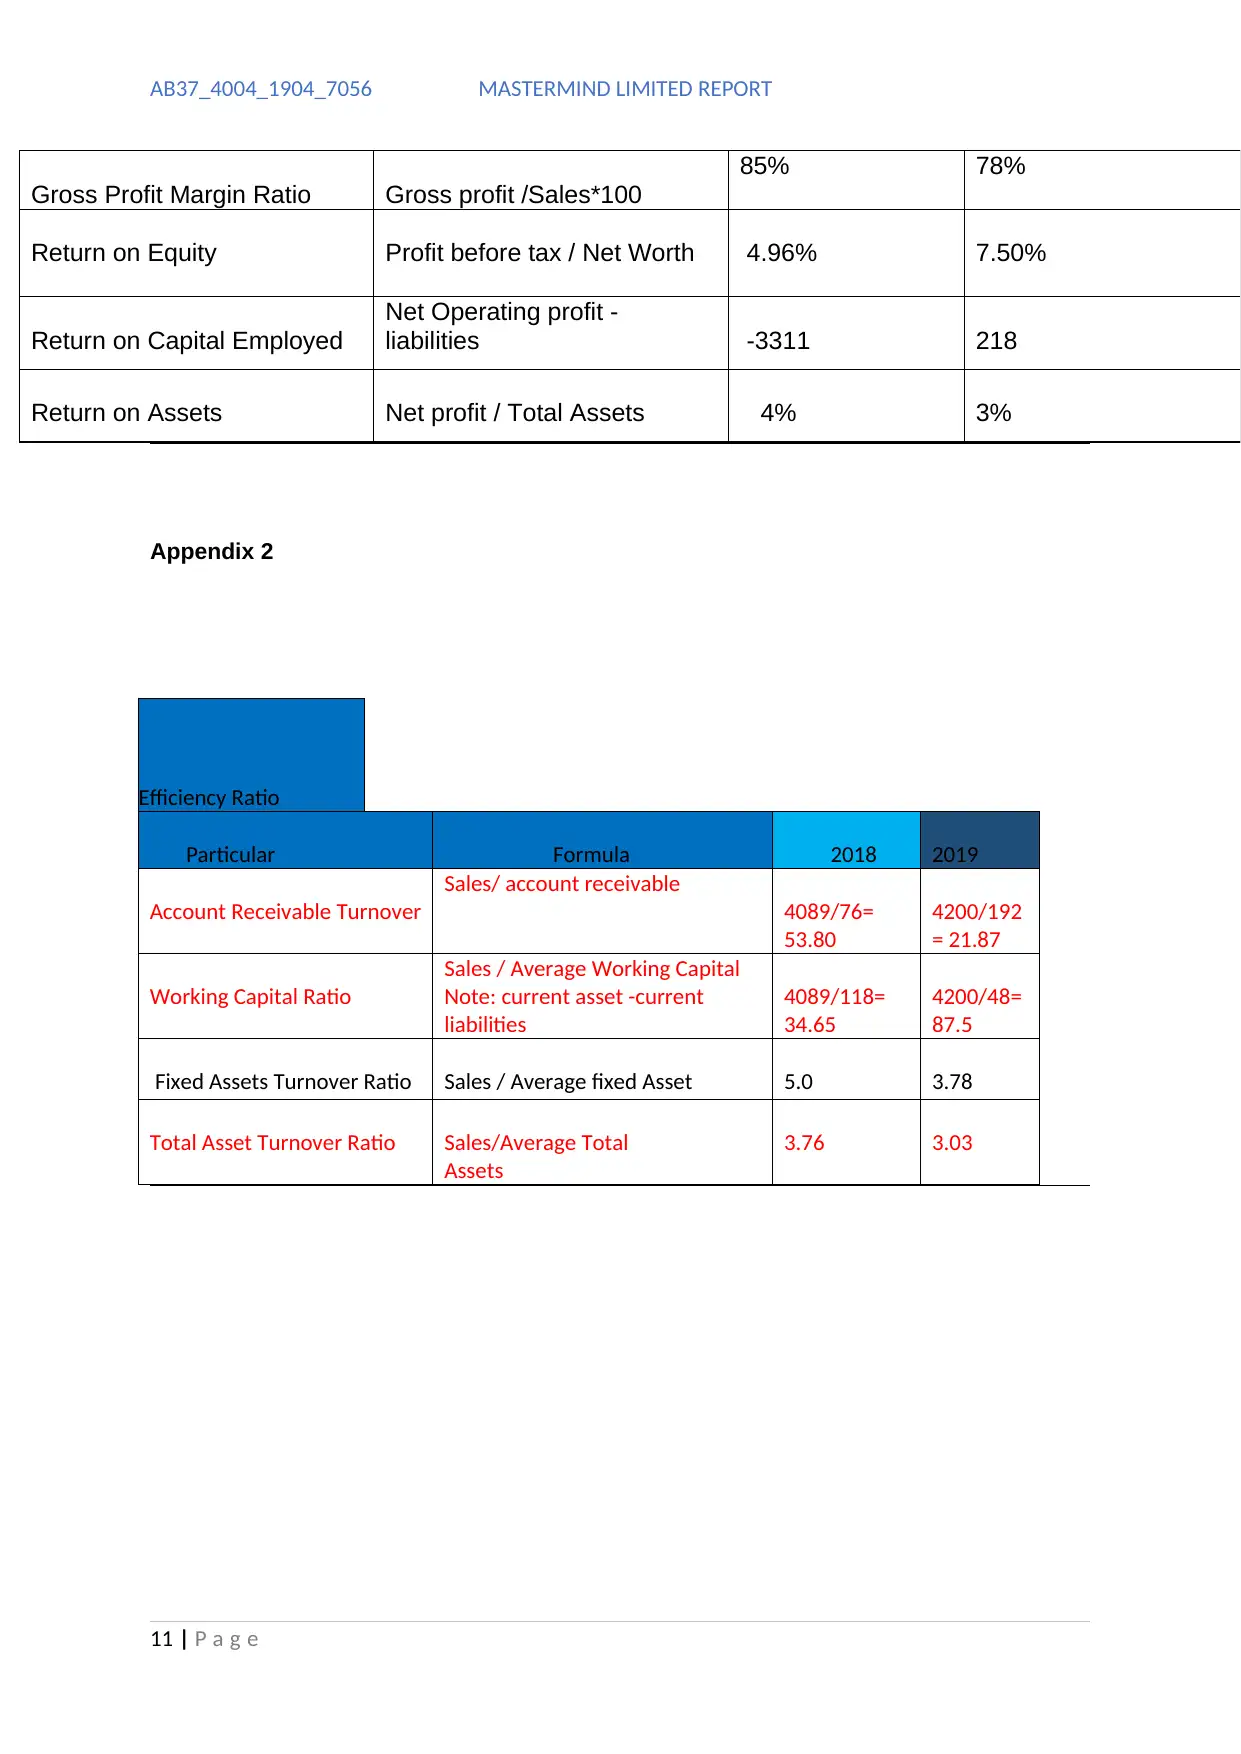
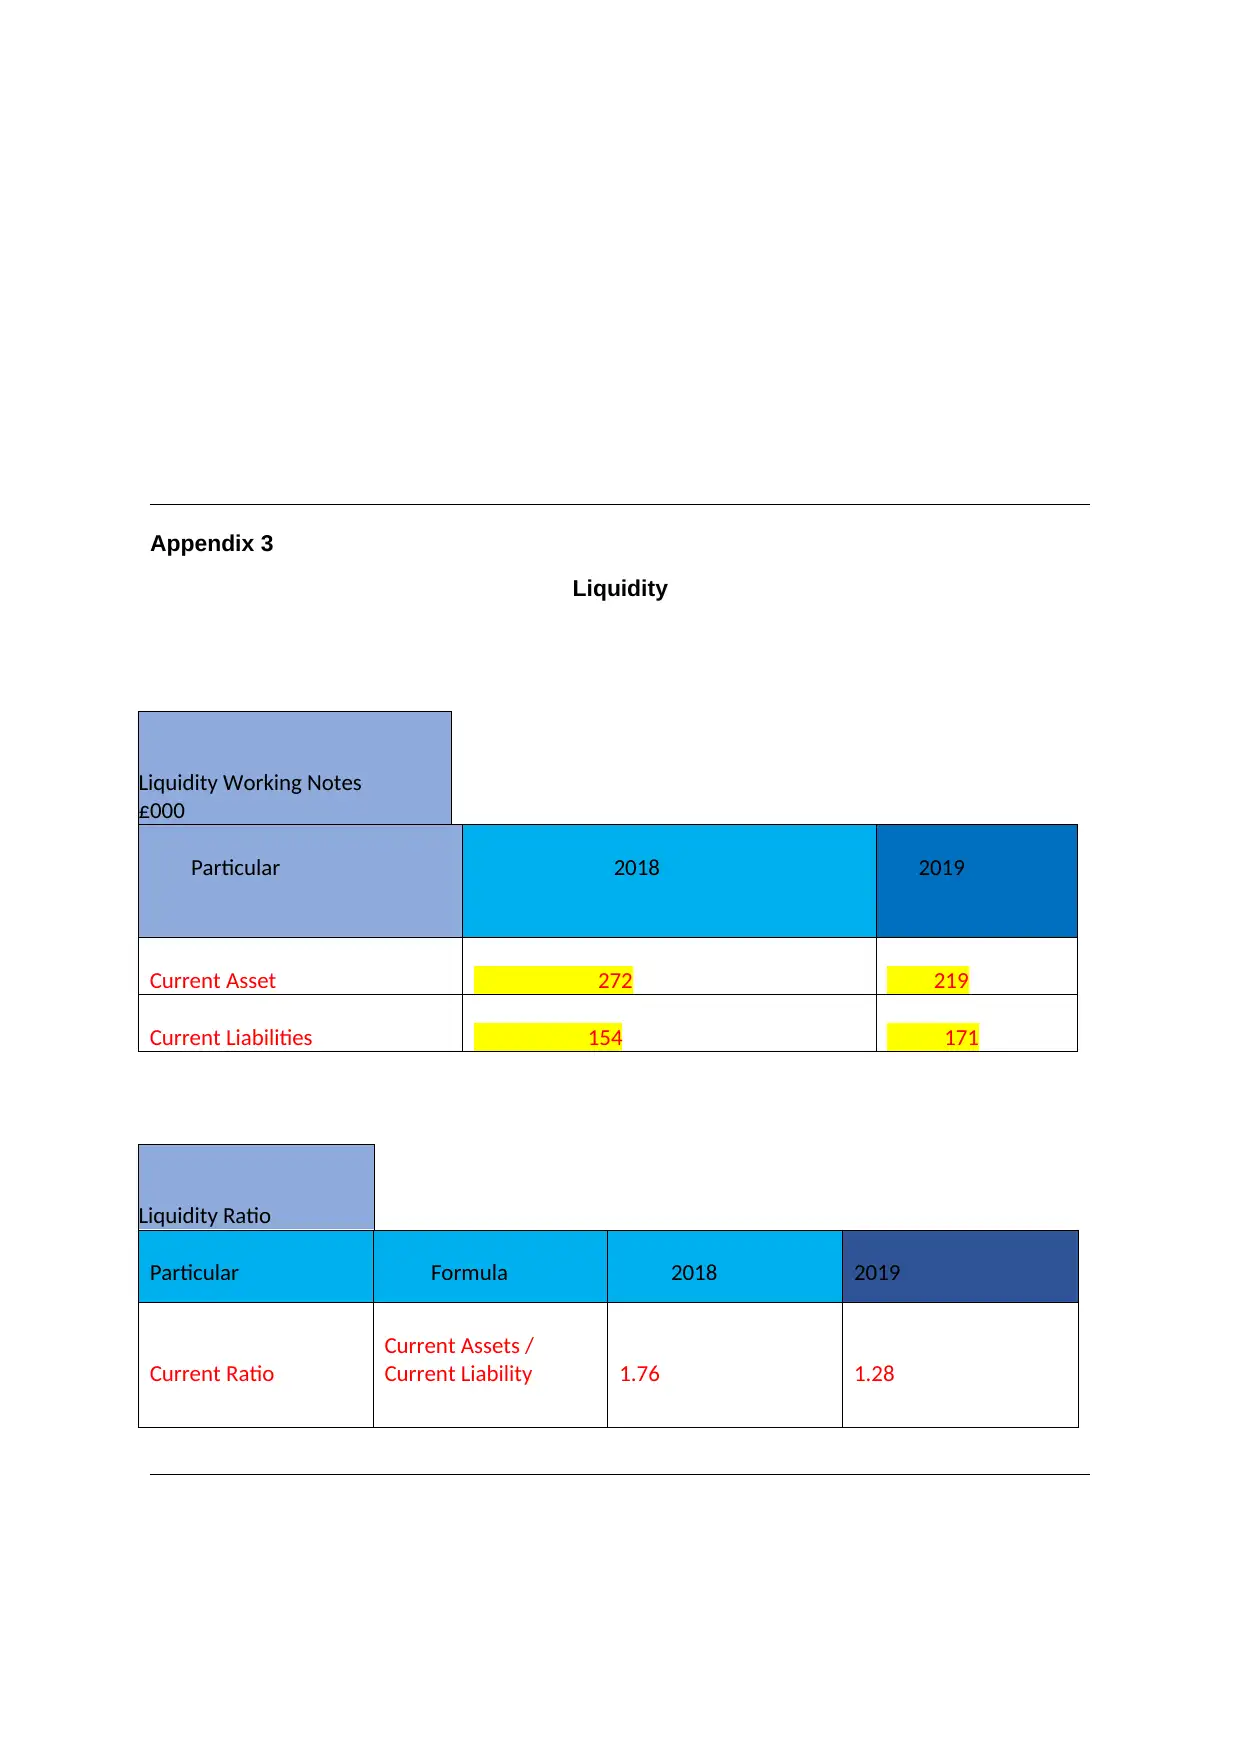
This report presents a comprehensive financial statement analysis of Mastermind Limited for the years 2018 and 2019. The analysis employs ratio analysis to evaluate the company's performance across key areas including profitability, efficiency, liquidity, and capital structure (gearing). The report examines profitability ratios such as net profit margin, gross profit margin, return on equity, return on capital employed, and return on assets, revealing trends and insights into the company's ability to generate profits. Efficiency ratios, including asset turnover and working capital ratios, are assessed to determine how effectively Mastermind Limited utilizes its assets. Liquidity is evaluated through current ratio analysis, and the company's gearing ratio is examined to understand its financial leverage and capital structure. The report concludes with a summary of findings and offers recommendations for improving Mastermind Limited's financial performance and position, including suggestions for enhancing profitability, improving liquidity, and managing capital gearing.
tabler-icon-diamond-filled.svg

Contribute Materials

Your contribution can guide someone’s learning journey. Share your documents today.
Document Page
Financial statement 2018-2019
Content
1. Title
2. Introduction
3. Discussion
tabler-icon-diamond-filled.svg

Secure Best Marks with AI Grader

Need help grading? Try our AI Grader for instant feedback on your assignments.
Document Page
3.1 Profitability
3.2 Efficiency
3.3 Liquidity
3.4Gearing Capital
4. Conclusion
5. Recommendation
6. Financial Statement 2018 and 2019
7. Appendix 1
Appendix 2
Appendix 3
Appendix 4
Mastermind Financial statement analysis
Introduction
The report examines Mastermind Limited with an aim to analyse its financial statements of
2018 and 2019. The financial analysis is an audit with an aim and objective to create a
source of information for banks, clients, shareholders and generate more confidence with the
Document Page
AB37_4004_1904_7056 MASTERMIND LIMITED REPORT
company (Ageras,2020). In addition, financial analysis creates transparency in the financial
statements.
The report has used ratio formula analysis for the examination of the company
performance in all the criteria. The ratio analysis examines the annual report based on four
assessment such as liquidity, profitability, capital structure, and efficiency.
A conclusion will be dawn, in addition with recommendation for the provision of
Mastermind LTD future.
DISCUSSION
Profitability
The profitable ratio with its formula has been calculated and outline in appendix1.
Profitability Ratios defines and measure the overall performance of the company in terms of
the total revenue generated from operations. In addition, the ratios that measure the ability
of the organization to generate profits out of the expenses and the other cost sustain over a
period are called the profitability ratios. The profit margin acts as the most important ratio as
it reflects the financial performance of the company and it reflects the amount of profits
generated by the firm on its sales and after meeting or paying off all its expenses (Tracey,
2012). To prove the situation of profitability, mastermind limited uses net profit ratio, gross
profit ratio, return on equity, return on capital employed, and return on assets. The ideal ratio
for net profits ratio margin is 15-20 percent (Campbell, Adduzio, Downes, and Utke,
2019). This is outline in the gross and net profit margins calculations.
2018 and the net profit in 2019 is 8 % this shows that the company have an increase in 2019
and show losses in 2019 In addition, this shows that the non -operation profit happened
3 | P a g e
Document Page
during this period. Gross profits ratio of the company is showing a declining trend that is from
85% in the year 2018 to 78% in 2019 due to a decrease in sales income and increase in cost
of sales. Return on equity can be stipulate as the amount of profit made off investor’s
money. In 2019 there was an increase of 2.5% when compare to 2018 which allows
shareholders profit to increase. Return on capital employed shows that the liabilities of the
firm have been decreased with a greater value and resulted a better ratio. Return on asset
ratio is a profitable on a company asset, in 2018 the company generate assets by 4%
however in 2019 there was a decrease in the company assets by 1%. The findings show that
over all the profitability ratios has displayed a good ratio analysis for 2018 due to the
increase in profit and less liabilities and borrowing. Liabilities place responsibilities on the
company resources (Carter 2017).
Efficiency
Measuring efficiency can gives some important clue to how a business is performing
( Ryan 2004). Most importantly the efficiency of a company relates to controlling its cost.
The asset turnover ratio of Mastermind is decreasing from 53.80 to 21.87 which means that
company is not using its assets effectively in order to generate higher sales. The working
capital ratio is seen as increasing from over 2 years from 34.65 in 2018 to 87.5 in 2019
which clearly states that Mastermind is making an effective use of its current assets for
achieving higher sales and is paying off its liabilities on time. This in turn reflects that
company is efficiently managing its business operations. Other ratio for analysis outline fixed
asset turns over 5% of fix assets turn over in 2018 and 3.78 %in 2019. This determine that
the company shows inadequate using fixed assets while generating net profits, 2018 show a
better fixed asset turnover. This depicts that overall company’s efficiency position is not
good.
Liquidity
tabler-icon-diamond-filled.svg

Secure Best Marks with AI Grader

Need help grading? Try our AI Grader for instant feedback on your assignments.
Document Page
AB37_4004_1904_7056 MASTERMIND LIMITED REPORT
A liquidity ratio is a financial ratio that indicates whether a company' current assets will
be sufficient to meet the company's obligations when they become due (Coach 2020). In
addition, it decides to pay off its current liabilities. The current ratio for 2018 is 1.76 and the
current ratio in 2019 is 1.28. This shows that the current ratio of Mastermind is better in both
the years and is increasing that means it has sufficient amount of assets to meet its current
liabilities.
A liquidity crisis is a financial situation characterized by a lack of cash or easily-convertible
to-cash assets on hand across several businesses or financial institutions simultaneously
(Crisis 2020)
Gearing
The gearing ratio is financial ratio that contrast some form of owner's capital to
debt, or funds that the company take for itself. Gearing is a measurement of the entity’s
financial leverage which prove that all to which a firm's activities are funded by shareholders'
funds. In addition, this ratio brings out relationship between two types of capitals: The
caries of a fix rate of dividend or interest that does carry a fix rate or dividends or interest
(KUPPAPALLY, 2008).
Mastermind manage to maintain capital gearing of 34.1% in 2018 and in
2019 there is an increase in Capital gearing of 61.8 % because its long term debts are
increasing as it has taken bank loan against its owned funds and this leads to high financial
burden on the firm. A gearing ratio higher than 50% highly leverage or geared. A gearing
ratio lower than 25% consider a lower risk by lenders and inverters a gearing between 25%
and 50% is typically considered to be normal (Kenton, 2018). In addition, high level leverage
company show insolvent. (Appendix 1) outline the ratio calculation that complement the
discussion in this report.
5 | P a g e
Document Page
Conclusion
From the above report it has been summarised that ratio analysis acts the most
useful tool as it helps in analysing the financial performance and position of the company
and also facilitates comparison between past and current year figures in adequate manner.
The analysis shows that due to higher tax and interest expenses, net profit margin of the
company is declining. However, the other profitability ratio shows an increasing trend which
reflects that Mastermind Limited has performed better in 2019 by keeping control over its
expenses in comparison to 2018. Conclusively, efficiency position of corporation does
seems as improving because the assets are not being used optimally. Overall CR of an
enterprise is decreasing but is counted as better because it is close to ideal ratio that is 2:1.
This means that the liquidity position of Mastermind is better and has adequate level of short
term assets to pay off its current obligations. Further, the leverage position of the firm is
getting poor as its ratio is increasing which indicates that company has more of borrowed
funds over its own funds and bearing high financial risk.
Recommendation
We are in an era where financial statement is paramount and they need to be use for
legitimate reason such as bank loans, Government authorities and shareholders
transparency. There is a great need to improve profitability for financial statement 2019. Net
Profit Margin: When doing a simple profitability ratio analysis, the net profit margin is the
most often margin ratio used (Balance, 2020),The net profit margin shows how much of each
Document Page
AB37_4004_1904_7056 MASTERMIND LIMITED REPORT
sales in pound shows up as net income. This will also help with cash flow throughout
Mastermind.
As far as the liquidity position is considered, in 2019, the company must improve the current
ratio by increasing the current assets so that the current liabilities can be convenient.
However, there more than one ways to improve liquid position another option is to get rid of
all of the assets that is irrelevant to Mastermind.
For Capital ratio, Mastermind could implement measures to reduce its gearing capital
further shares. They could authorize the sale of shares in the company, which could be
used to pay debt. The company should seek for reducing its working capital for
increasing its profit margins.
Convert loans. Negotiate with lenders to swap existing debt for shares in the
company.
Reduce working capital. Increase the speed account receivable collections,
increasing the days required to account payable, any of which produces cash
that can be used to pay down debt.
Increase profits. Use any methods available to increase profits, which should
generate more cash with which to pay down debt. (Braggs, 2020)
Reference
7 | P a g e
tabler-icon-diamond-filled.svg

Paraphrase This Document

Need a fresh take? Get an instant paraphrase of this document with our AI Paraphraser
Document Page
Ageras (2020) 6 Reasons Why You Should Audit Your Financial Statements. [Online]
Available at: https://www.ageras.co.uk/blog/importance-of-auditing-6-reasons-why-you-
should-audit-your-financial-statements (accessed 02/ 05/ 20).
Balance (2020) What You Should Know About Profitability Ratio Analysis. [Online]
Available at: https://www.thebalancesmb.com/profitability-ratio-analysis-393185 (accessed
03/ 05/ 20).
Bragg S (2020) Gearing ratio — AccountingTools. [Online] Available at:
https://www.accountingtools.com/articles/2017/5/5/gearing-ratio (accessed 03/ 05/ 20).
Campbell, J.L., D'Adduzio, J., Downes, J. and Utke, S., 2019. Do Investors Adjust Financial
Statement Ratios when Financial Statements Fail to Reflect Economic Substance? Evidence
Coach (2020) What is a liquidity ratio? | AccountingCoach. [Online] Available at:
https://www.accountingcoach.com/blog/liquidity-ratio (accessed 03/ 05/ 20).
Crisis (2020) Liquidity Crisis Definition. [Online] Available at:
https://www.investopedia.com/terms/l/liquidity-crisis.asp (accessed 03/ 05/ 20).
Kenton W (2018) Capital Gearing. [Online] Available at:
https://www.investopedia.com/terms/c/capitalgearing.asp (accessed 03/ 05/ 20).
KUPPAPALLY J (2008) ACCOUNTING FOR MANAGERS. New Delhi: PHI Learning Pvt.
Ltd., 2008 Available at: https://books.google.co.uk/books?
id=lakX0e4ajwkC&dq=gearing+ratio&source=gbs_navlinks_s (accessed 03/ 05/ 20).
Ryan B (2004) Finance and Accounting for Business (1st edition). Derby: Cengage Learning
EMEA, 2004 Available at: https://books.google.co.uk/books?
id=o6htAepmtC4C&dq=what+is+efficiency+ratio&source=gbs_navlinks_s (accessed 02/ 05/
20).
Tracey A (2020) Ratio Analysis Fundamentals: How 17 Financial Ratios Can Allow You to
Analyse Any Business on the Plane. Sidney: RatioAnalysis.net, 2012 Available at:
Document Page
AB37_4004_1904_7056 MASTERMIND LIMITED REPORT
https://books.google.co.uk/books?id=GadRYnALi-
oC&dq=profitability+ratios&source=gbs_navlinks_s (accessed 02/ 05/ 20
9 | P a g e
Document Page
APPENDIX 1
Profitability Work Note 31 Dec 2018 31 Dec 2019
Element Value £000
2018
Value £000
2019
Sales 4,089 4,200
Gross expenses 3,045 3, 317
Gross Profit 3,464 3,266
Operating Profit
613 607
Net Worth 613 442
Net Total Assets 931 1157
Capital and reserves 613 442
Profitability Ratio
Particular Formula 31 December 2018 31 December 2019
Net Profit Margin Ratio Net Profit / sales 9% -3%
tabler-icon-diamond-filled.svg

Secure Best Marks with AI Grader

Need help grading? Try our AI Grader for instant feedback on your assignments.
Document Page
AB37_4004_1904_7056 MASTERMIND LIMITED REPORT
Gross Profit Margin Ratio Gross profit /Sales*100
85% 78%
Return on Equity Profit before tax / Net Worth 4.96% 7.50%
Return on Capital Employed
Net Operating profit -
liabilities -3311 218
Return on Assets Net profit / Total Assets 4% 3%
Appendix 2
Efficiency Ratio
Particular Formula 2018 2019
Account Receivable Turnover
Sales/ account receivable
4089/76=
53.80
4200/192
= 21.87
Working Capital Ratio
Sales / Average Working Capital
Note: current asset -current
liabilities
4089/118=
34.65
4200/48=
87.5
Fixed Assets Turnover Ratio Sales / Average fixed Asset 5.0 3.78
Total Asset Turnover Ratio Sales/Average Total
Assets
3.76 3.03
11 | P a g e
Document Page
Appendix 3
Liquidity
Liquidity Working Notes
£000
Particular 2018 2019
Current Asset 272 219
Current Liabilities 154 171
Liquidity Ratio
Particular Formula 2018 2019
Current Ratio
Current Assets /
Current Liability 1.76 1.28
Document Page
AB37_4004_1904_7056 MASTERMIND LIMITED REPORT
Appendix 4
Gearing ratio
Capital Gearing Ratio
Particular Formula 2018 2019
Gearing Ratio
Long term loan + Short term / ordinary share
capital + reserves+ Long term X 100 34.15682 61.81818
Gearing Ratio Work notes £000
2018 2019
Particular
Ordinary Share Capital 607 414
Reserves & Surplus 6 28
Long Term Loans 295 530
Short Term 23 185
Work out
Long term loan + Short term x 100
13 | P a g e
tabler-icon-diamond-filled.svg

Paraphrase This Document

Need a fresh take? Get an instant paraphrase of this document with our AI Paraphraser
Document Page
ordinary share capital + reserves+ Long term
Long term Loan + short term =
295 +23 = 318
Ordinary Share capital + reserves+ Long term
607 +6+ 318= 931
318 / 931 = 0.3415682 x100 = 34.15682
Document Page
AB37_4004_1904_7056 MASTERMIND LIMITED REPORT
15 | P a g e
Document Page
Contextualised Marking Criteria Grid Project 2 (70%)
This sheet will be completed by your tutor and returned within three weeks of the submission date. All marks and grades are subject to the agreement of the Joint Exam Committee, which take
place at the end of June.
OBU Student Number Shasana Tutor M Qume
Learning Outcomes D/70%+ M/60-69% P/50-59%
(High Pass)
P/40-49% 0-39%
3. Apply
understanding of
financial reports
to any set of
company
accounts
Accounts are completed
correctly and are presented
in a clear and coherent
format.
Accounts are mostly correct
with few errors and are
presented in a clear and
coherent format.
Accounts have some errors
and are presented in a
coherent format.
Accounts have some errors
and are unclear in some
areas
Accounts have a significant
amount of errors and are
unclear in many places.
4. Produce financial
reports and
statements for a
range of different
businesses.
Ratios are correct and
presented in a clear and
coherent format.
Ratios are mostly correct and
presented in a clear and
coherent format.
Ratios have some errors
and are presented in a
coherent format.
Ratios have some errors
and are unclear in some
areas
Ratios have a significant
amount of errors and are
unclear in many places.
5. Interpret a range
of financial
reports and
statements using
ratio analysis.
Arguments are sound and
the work demonstrates
clearly the student’s own
independent thinking and
critical ability.
Recommendations are clear
and linked very closely to the
interpretations.
Arguments have sufficient
critical and reflective content
and demonstrate evidence of
independent creativity.
Recommendations are clear
and linked closely to the
interpretations.
Although largely
descriptive, the work
demonstrates some critical
evaluation of the results.
Recommendations are
mostly clear and an
attempt has been made to
link them to the
interpretations.
Interpretation is largely
descriptive with some
attempt at analysing the
results. Work does not
introduce sufficient
independent ideas. It is
informative rather than
critical. Recommendations
are limited and not entirely
linked to the
interpretation.
Work is of a descriptive
nature with no attempt at
conclusions and
recommendations.
Specific aspects of your project that the marker found effective
You worked through the report in a logical sequence and had some
interesting conclusions for maintenance of cash flow.
Please see in text for further comments
S
P
E
C
I
F
I
C
A
tabler-icon-diamond-filled.svg

Secure Best Marks with AI Grader

Need help grading? Try our AI Grader for instant feedback on your assignments.
Document Page
S
P
E
C
T
S
O
F
Y
O
U
R
P
R
O
J
E
C
T
T
O
W
O
R
K
O
N
T
H
Document Page
A
T
C
O
U
L
D
I
M
P
R
O
V
E
Y
O
U
R
F
U
T
U
R
E
G
R
A
D
E
S
:
Document Page
P
l
e
a
s
e
e
n
s
u
r
e
y
o
u
r
e
a
d
t
h
e
b
r
i
e
f
c
a
r
e
f
u
l
tabler-icon-diamond-filled.svg

Paraphrase This Document

Need a fresh take? Get an instant paraphrase of this document with our AI Paraphraser
Document Page
l
y
a
n
d
i
n
c
l
u
d
e
d
e
v
e
r
y
t
h
i
n
g
a
s
r
e
q
u
i
r
e
d

t
Document Page
h
e
a
d
j
u
s
t
e
d
s
e
t
o
f
f
i
n
a
n
c
i
a
l
s
t
a
t
e
m
e
n
t
s
w
e
r
Document Page
e
m
i
s
s
i
n
g
.
M
a
n
y
o
f
t
h
e
c
a
l
c
u
l
a
t
i
o
n
s
w
e
r
e
w
tabler-icon-diamond-filled.svg

Secure Best Marks with AI Grader

Need help grading? Try our AI Grader for instant feedback on your assignments.
Document Page
r
o
n
g
-
s
p
e
n
d
s
o
m
e
t
i
m
e
r
e
v
i
e
w
i
n
g
w
h
a
t
t
h
e
Document Page
f
i
n
a
n
c
i
a
l
d
o
c
u
m
e
n
t
s
a
r
e
t
e
l
l
i
n
g
y
o
u
.
I
f
t
h
e
Document Page
t
a
b
l
e
s
w
i
t
h
t
h
e
r
a
t
i
o
w
e
r
e
i
n
t
h
e
a
p
p
e
n
d
i
tabler-icon-diamond-filled.svg

Paraphrase This Document

Need a fresh take? Get an instant paraphrase of this document with our AI Paraphraser
Document Page
c
e
s
t
h
i
s
w
o
u
l
d
f
r
e
e
u
p
w
o
r
d
s
i
n
y
o
u
r
r
e
p
o
r
Document Page
t
.
P
l
e
a
s
e
r
e
a
d
t
h
r
o
u
g
h
c
a
r
e
f
u
l
l
y
f
o
r
m
e
a
n
i
Document Page
n
g
.
Use of English is good with few if any
errors
Use of English is sound There are
weaknesses in
your use of
English
Please see your marking tutor
about your use of English
Marker’s name
M Qume
Marker’s signature
M Qume (digital)
Date
31/05/20
Grade:
Fail
Mark: 33 /100
Second marker’s name
(if appropriate)
Second marker’s signature Date Grade Mark /100
Final Agreed Grade Final Agreed Mark
chevron_up_icon
1 out of 28
circle_padding
hide_on_mobile
zoom_out_icon
logo.png

Your All-in-One AI-Powered Toolkit for Academic Success.

Available 24*7 on WhatsApp / Email

[object Object]