Finance for Business Report - Masters, Mount Ridley Mines Analysis

Verified

Added on  2020/05/28

|9
|1905
|25
Report
AI Summary
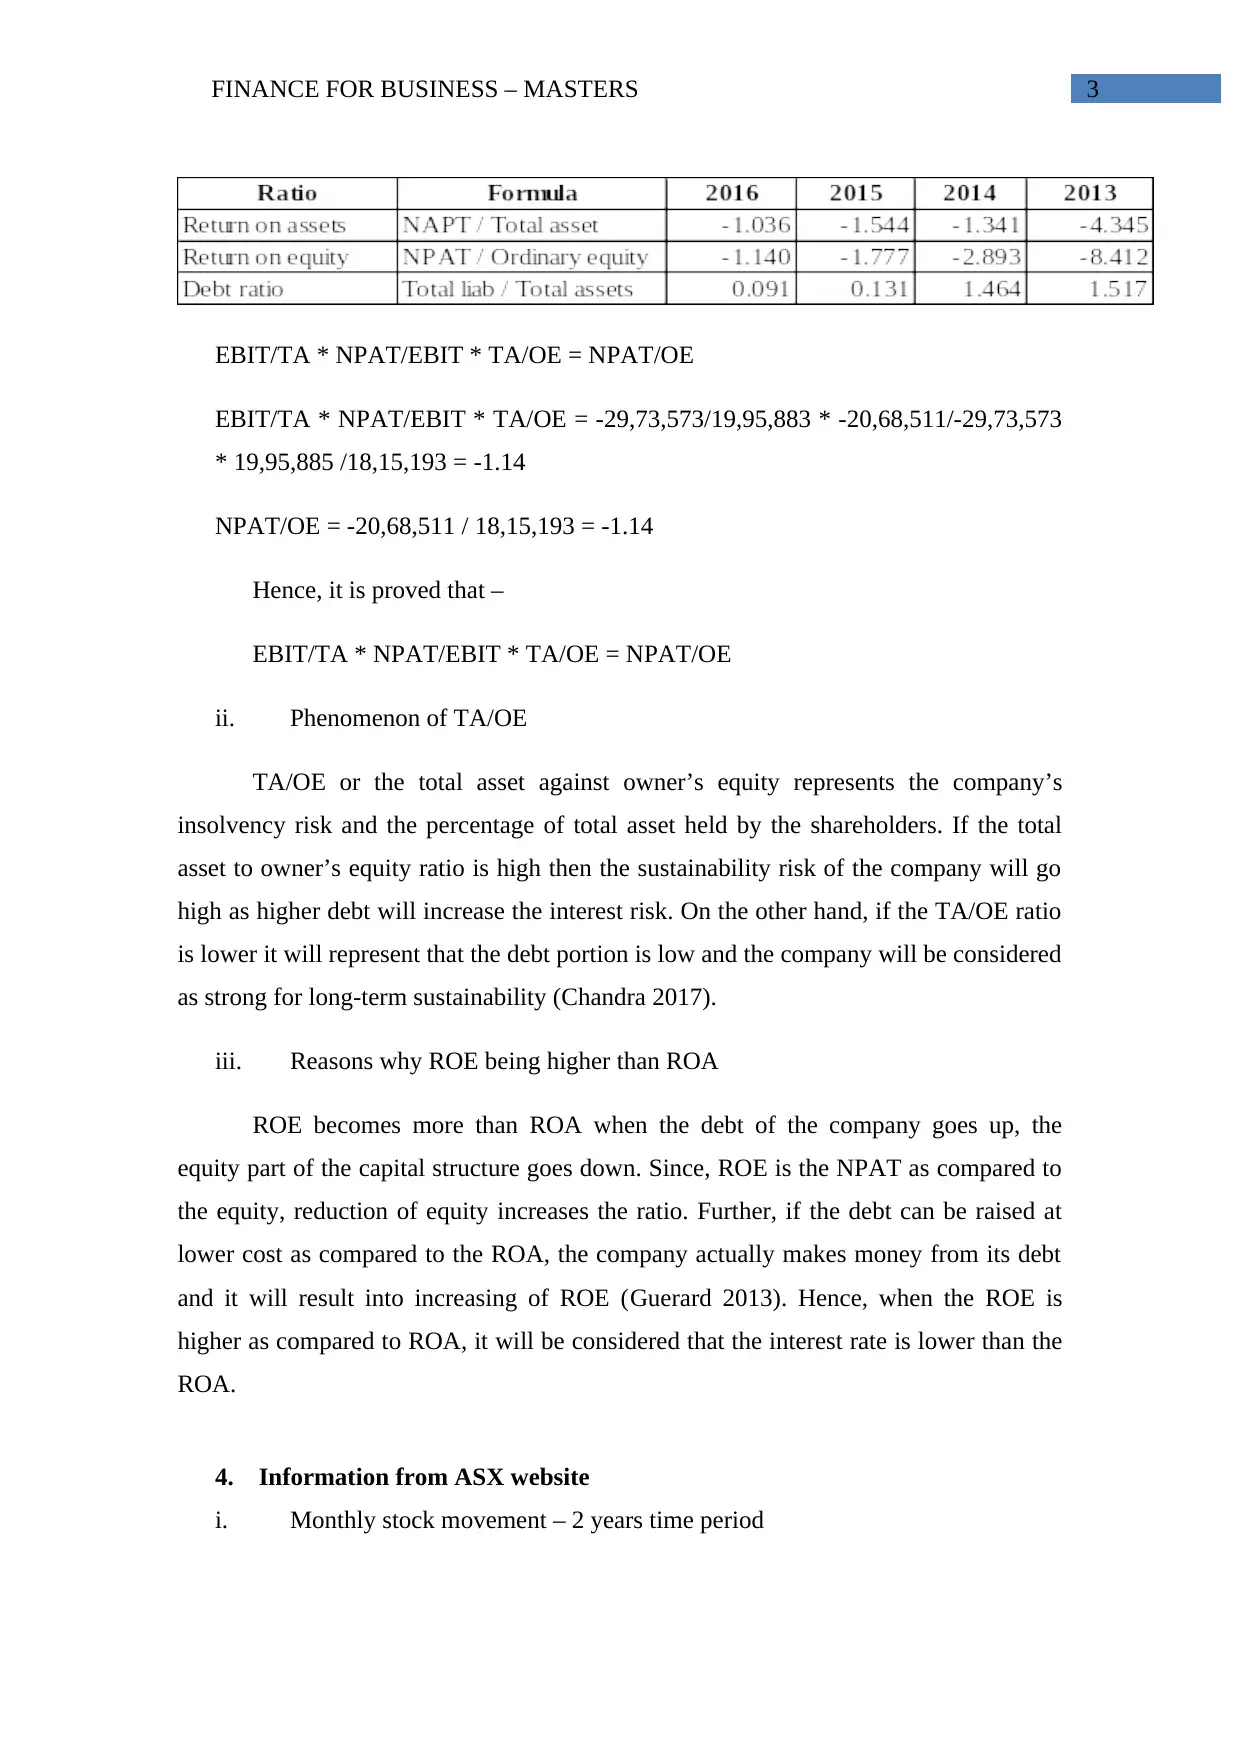
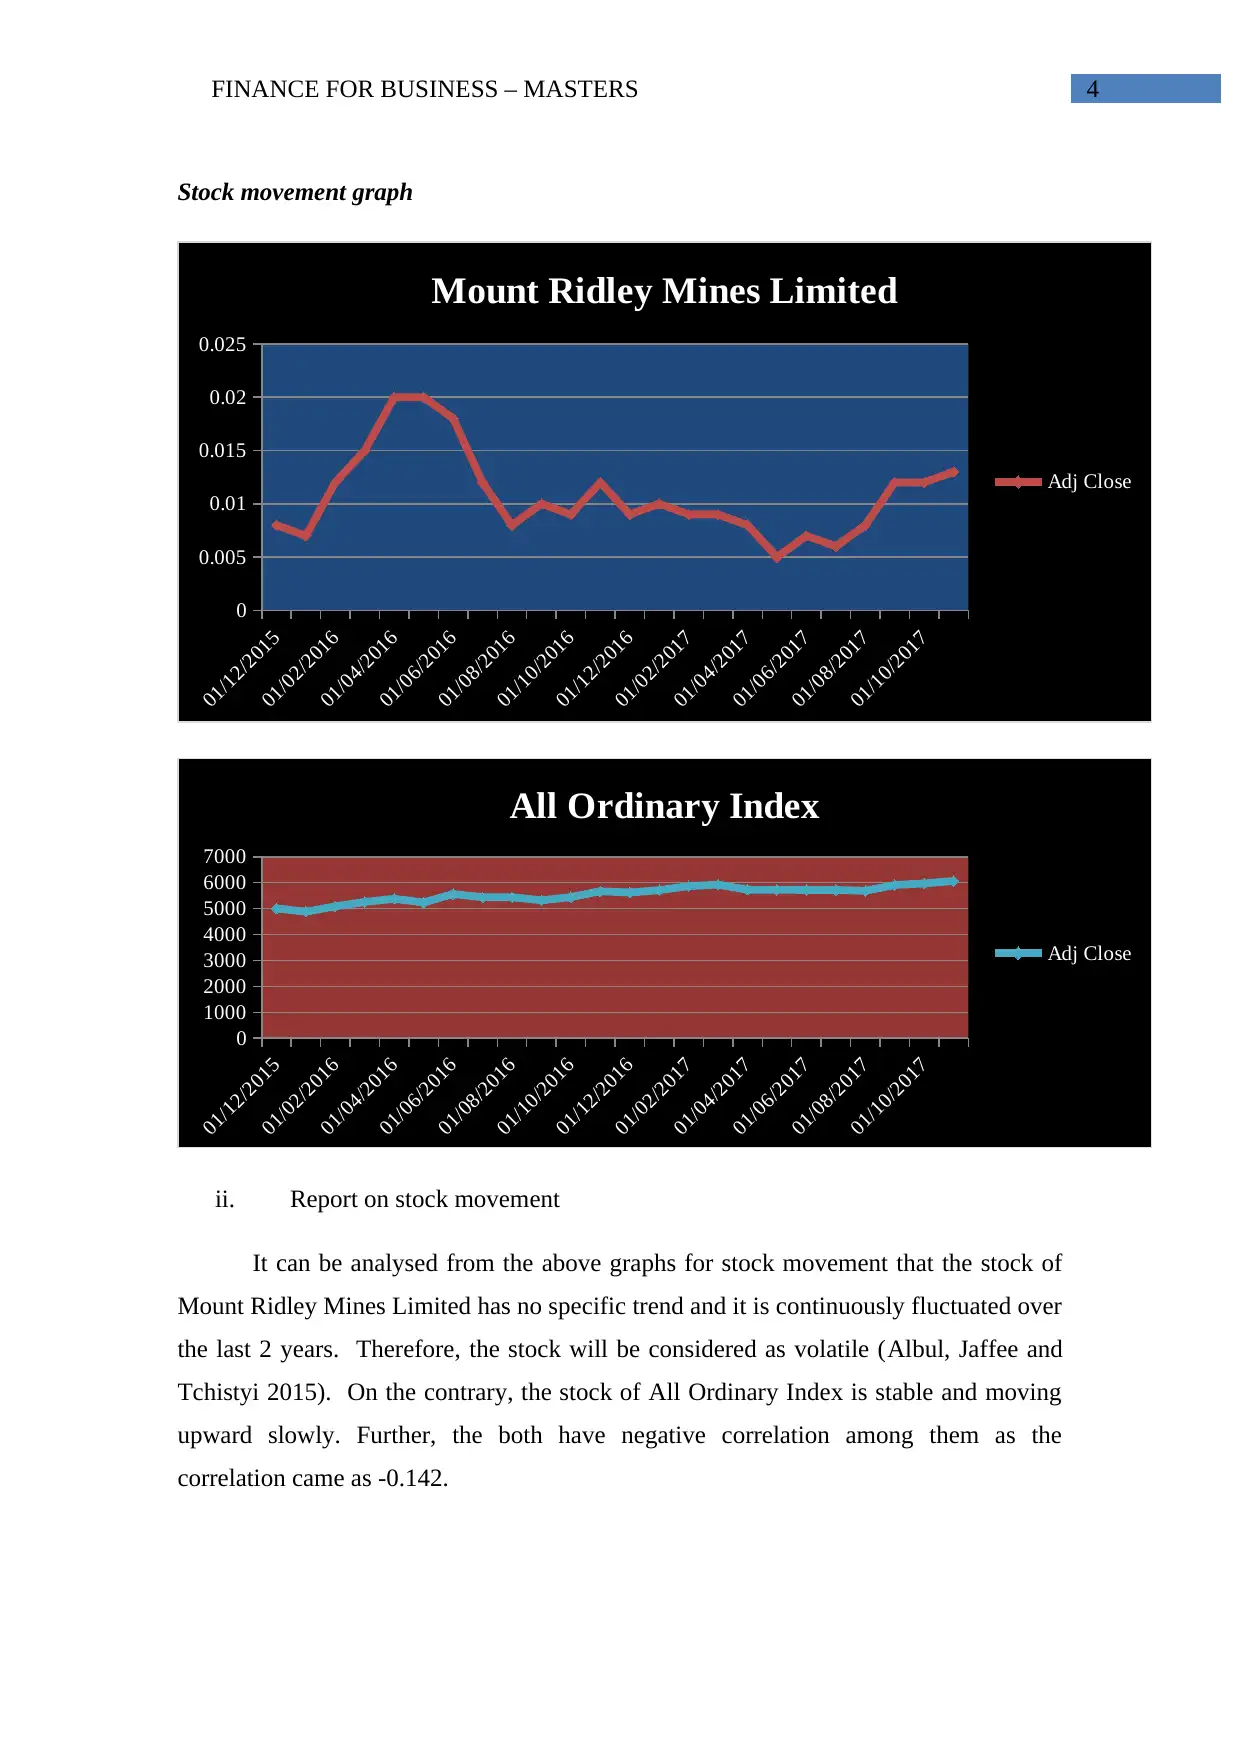
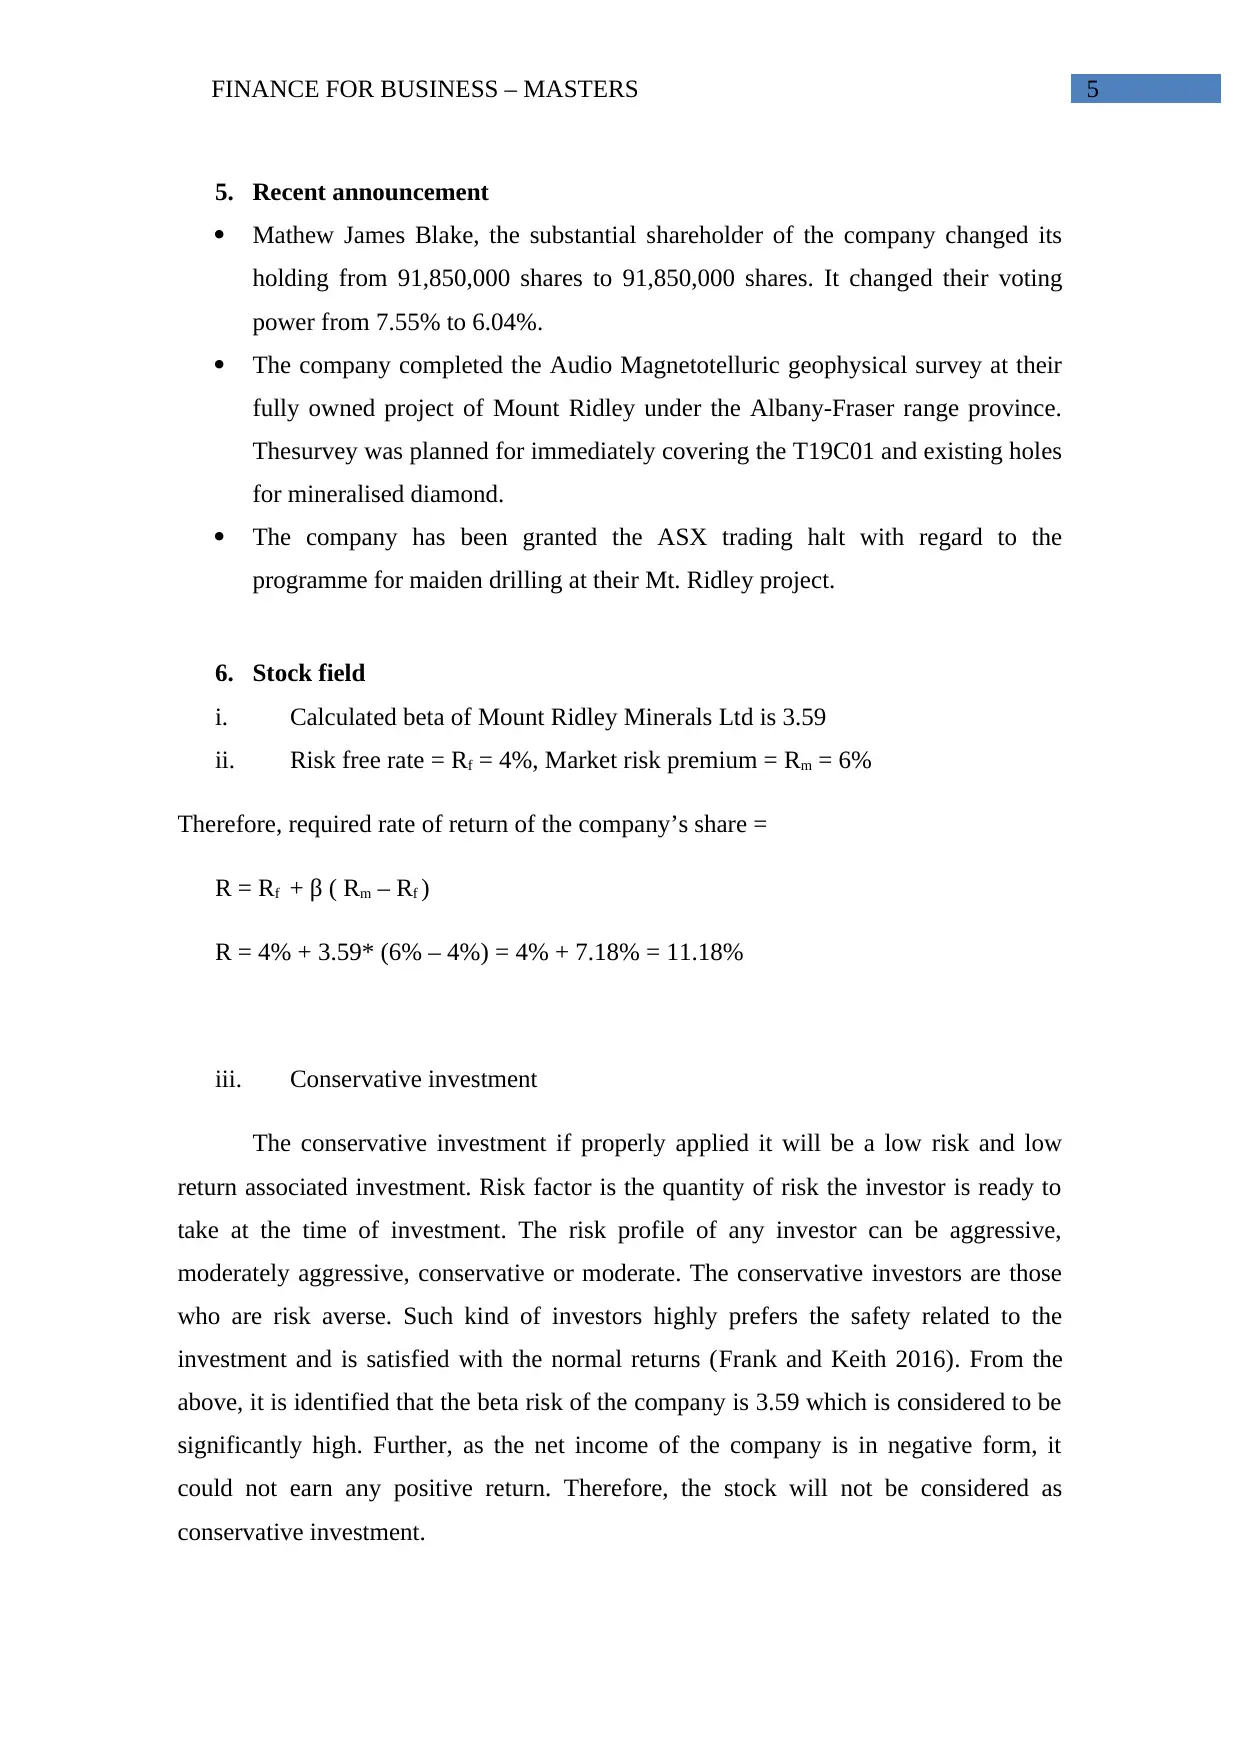
This finance report provides a comprehensive analysis of Mount Ridley Mines Ltd, an exploration company based in Perth, Australia. The report details the company's ownership structure, including substantial shareholders and key personnel. It calculates and interprets key financial ratios such as Return on Assets (ROA) and Return on Equity (ROE), explaining the relationship between them and the implications of the company's debt levels. The report examines stock movement data from the ASX website, analyzes recent announcements, and calculates the company's beta and required rate of return. Furthermore, it explores the concept of conservative investment and determines whether Mount Ridley Mines' stock fits this profile. The report also calculates the Weighted Average Cost of Capital (WACC), discusses the implications of a high WACC, and assesses the company's optimal debt structure and dividend policy. Finally, it provides a recommendation on whether the company's stock is suitable for investment, concluding that it is not due to its high beta and negative earnings over the past four years. The report references several academic sources to support its findings and analysis.
tabler-icon-diamond-filled.svg

Contribute Materials

Your contribution can guide someone’s learning journey. Share your documents today.
Document Page
Running head: FINANCE FOR BUSINESS - MASTERS
Finance for business – Masters
Name of the student
Name of the university
Author note
tabler-icon-diamond-filled.svg

Secure Best Marks with AI Grader

Need help grading? Try our AI Grader for instant feedback on your assignments.
Document Page
FINANCE FOR BUSINESS – MASTERS 1
Table of Contents
1. Description of the company................................................................................................2
2. Specification of ownership structure..................................................................................2
3. Key ratios of Mount Ridley Mines Limited........................................................................2
4. Information from ASX website..........................................................................................4
5. Recent announcement.........................................................................................................5
6. Stock field...........................................................................................................................5
7. WACC (weighted average cost of capital).........................................................................6
8. Optimal debt structure........................................................................................................7
9. Dividend policy...................................................................................................................8
10. Recommendation.............................................................................................................8
Reference....................................................................................................................................9
Document Page
FINANCE FOR BUSINESS – MASTERS 2
1. Description of the company
Mount Ridley Mines Ltd is the exploration company that is primarily focussed
on the projects in region of Fraser range. The company is based in Perth, Australia. It
has the potential of hosting the major deposits for minerals and various precious metals
like copper, nickel, lead, cobalt, lead gold, silver and zinc. The entity is managed by the
team of significant expertise and motivated professionals in the field of mineral
exploration corporate and finance management and mining operations with the proven
track record for successfully delivering the value to the shareholders
(Mtridleymines.com.au 2018).
2. Specification of ownership structure
i) Major substantial shareholders
More than 20% shareholding – there are no substantial shareholder holding more
than 20% shares
More than 5% holding of shares – Mount Street Inv Pl < M J Blake S/F A/C > is
holding 90,000,000 of total shares that is equal to 8.50% shares.
ii) Name of main people
Chairman – Michael Pedley
Board members
Guy Le Page – Non-executive Director
Ashley Hood – Managing Director
Keith Bowker – Non-Executive Director
CEO – Michael Pedley
3. Key ratios of Mount Ridley Mines Limited
i. Return on assets (ROA) = (NPAT / Total Assets)
Return on Equity (ROE) = (Net profit after tax / Ordinary equity)
Debt ratio = Total liabilities / Total assets
Document Page
FINANCE FOR BUSINESS – MASTERS 3
EBIT/TA * NPAT/EBIT * TA/OE = NPAT/OE
EBIT/TA * NPAT/EBIT * TA/OE = -29,73,573/19,95,883 * -20,68,511/-29,73,573
* 19,95,885 /18,15,193 = -1.14
NPAT/OE = -20,68,511 / 18,15,193 = -1.14
Hence, it is proved that –
EBIT/TA * NPAT/EBIT * TA/OE = NPAT/OE
ii. Phenomenon of TA/OE
TA/OE or the total asset against owner’s equity represents the company’s
insolvency risk and the percentage of total asset held by the shareholders. If the total
asset to owner’s equity ratio is high then the sustainability risk of the company will go
high as higher debt will increase the interest risk. On the other hand, if the TA/OE ratio
is lower it will represent that the debt portion is low and the company will be considered
as strong for long-term sustainability (Chandra 2017).
iii. Reasons why ROE being higher than ROA
ROE becomes more than ROA when the debt of the company goes up, the
equity part of the capital structure goes down. Since, ROE is the NPAT as compared to
the equity, reduction of equity increases the ratio. Further, if the debt can be raised at
lower cost as compared to the ROA, the company actually makes money from its debt
and it will result into increasing of ROE (Guerard 2013). Hence, when the ROE is
higher as compared to ROA, it will be considered that the interest rate is lower than the
ROA.
4. Information from ASX website
i. Monthly stock movement – 2 years time period
tabler-icon-diamond-filled.svg

Secure Best Marks with AI Grader

Need help grading? Try our AI Grader for instant feedback on your assignments.
Document Page
FINANCE FOR BUSINESS – MASTERS 4
Stock movement graph
01/12/2015
01/02/2016
01/04/2016
01/06/2016
01/08/2016
01/10/2016
01/12/2016
01/02/2017
01/04/2017
01/06/2017
01/08/2017
01/10/2017
0
0.005
0.01
0.015
0.02
0.025
Mount Ridley Mines Limited
Adj Close
01/12/2015
01/02/2016
01/04/2016
01/06/2016
01/08/2016
01/10/2016
01/12/2016
01/02/2017
01/04/2017
01/06/2017
01/08/2017
01/10/2017
0
1000
2000
3000
4000
5000
6000
7000
All Ordinary Index
Adj Close
ii. Report on stock movement
It can be analysed from the above graphs for stock movement that the stock of
Mount Ridley Mines Limited has no specific trend and it is continuously fluctuated over
the last 2 years. Therefore, the stock will be considered as volatile (Albul, Jaffee and
Tchistyi 2015). On the contrary, the stock of All Ordinary Index is stable and moving
upward slowly. Further, the both have negative correlation among them as the
correlation came as -0.142.
Document Page
FINANCE FOR BUSINESS – MASTERS 5
5. Recent announcement
Mathew James Blake, the substantial shareholder of the company changed its
holding from 91,850,000 shares to 91,850,000 shares. It changed their voting
power from 7.55% to 6.04%.
The company completed the Audio Magnetotelluric geophysical survey at their
fully owned project of Mount Ridley under the Albany-Fraser range province.
Thesurvey was planned for immediately covering the T19C01 and existing holes
for mineralised diamond.
The company has been granted the ASX trading halt with regard to the
programme for maiden drilling at their Mt. Ridley project.
6. Stock field
i. Calculated beta of Mount Ridley Minerals Ltd is 3.59
ii. Risk free rate = Rf = 4%, Market risk premium = Rm = 6%
Therefore, required rate of return of the company’s share =
R = Rf + β ( Rm – Rf )
R = 4% + 3.59* (6% – 4%) = 4% + 7.18% = 11.18%
iii. Conservative investment
The conservative investment if properly applied it will be a low risk and low
return associated investment. Risk factor is the quantity of risk the investor is ready to
take at the time of investment. The risk profile of any investor can be aggressive,
moderately aggressive, conservative or moderate. The conservative investors are those
who are risk averse. Such kind of investors highly prefers the safety related to the
investment and is satisfied with the normal returns (Frank and Keith 2016). From the
above, it is identified that the beta risk of the company is 3.59 which is considered to be
significantly high. Further, as the net income of the company is in negative form, it
could not earn any positive return. Therefore, the stock will not be considered as
conservative investment.
Document Page
FINANCE FOR BUSINESS – MASTERS 6
7. WACC (weighted average cost of capital)
i. Computation of WACC
WACC = E/V * Re +D/V * Rd * (1-Tc), Where,
E/V = Equity percentage in the capital structure
D/V = Debt percentage in the capital structure
Re = Cost of equity
Rd = Rate of debt
Tc = corporate tax rate
However, it is recognized that the company has no borrowing or debt for the
year. Therefore, the entire capital structure of the company includes the equity
component only. Hence, the the weighted average cost of capital will be cost of equity
that is 11.18%.
ii. Implication that the higher WACC has on the evaluation of management
High level of WACC is the signal for higher risk association with the operation
of the firm. The investors will require the additional return for assuming the additional
risk. the value investors may also become concerned regarding whether the WACC is
more than the actual return (DeFusco et al. 2015). It includes the payments for debt
obligation or cost associated with debt financing and required return rate asked by the
ownership or by the cost required for equity financing.
8. Optimal debt structure
i. Optimal structure for capital
Debt ratio Total liabilities / Total assets Year 2016 = 0.091 Year 2015 = 0.131
Optimal capital structure is the percentage of debt and equity component in the
capital structure at which it can maximise the value of the company. The debt ratio of
40% or lower than 40% is considered ideal for the company; However, if the last two
tabler-icon-diamond-filled.svg

Paraphrase This Document

Need a fresh take? Get an instant paraphrase of this document with our AI Paraphraser
Document Page
FINANCE FOR BUSINESS – MASTERS 7
year’s debt ratio for Mount Ridley Minerals Limited is taken into consideration, it can
be found out that the debt ratio for 2015 was 13.10% and for 2016 is 9.10% which is
very low. Hence, for additional fund requirement it can rely on debt instead of equity
(Renneboog and Szilagyi 2015).
ii. Gearing ratio
It is found from the annual report of the company that for adjusting the gearing
ratio the company increased their equity amount from $ 19,201,817 to $ 21,017,352
over the years from 2015 to 2016. Though the director’s report did not mention
anything regarding this, it is disclosed through notes to accounts that the owing to the
company’s activity’s nature id does not have immediate access to the credit facilities
(Heikal, Khaddafi and Ummah 2014). Therefore, the primary source of fund for the
company is equity.
9. Dividend policy
The company did not declare or pay any dividend during the accounting year.
Further, it did not recommend for divided payment. The reason for this policy is that the
company was not able to earn positive earning over the last 4 years. Therefore, they do
not have sufficient amount to pay the dividend (Akeem et al. 2014).
10. Recommendation
It is recommended from the above analysis that the company’s stock shall not be
included in his portfolio as the risk that is beta of the stock is 3.59. Further, over the last
4 years the company could not earn any positive earning. Therefore, with regard to the
return aspect as well as the risk aspect, the stock of the company is not feasible for
investment and shall not be included in the portfolio.
Document Page
FINANCE FOR BUSINESS – MASTERS 8
Reference
Akeem, L.B., Terer, E.K., Kiyanjui, M.W. and Kayode, A.M., 2014. Effects of capital
structure on firm’s performance: Empirical study of manufacturing companies in
Nigeria. Journal of Finance and Investment Analysis, 3(4), pp.39-57.
Albul, B., Jaffee, D.M. and Tchistyi, A., 2015. Contingent convertible bonds and capital
structure decisions.
Chandra, P., 2017. Investment analysis and portfolio management. McGraw-Hill
Education.
DeFusco, R.A., McLeavey, D.W., Pinto, J.E., Anson, M.J. and Runkle, D.E.,
2015. Quantitative investment analysis. John Wiley & Sons.
Frank, K.R. and Keith, C.B., 2016. Investment analysis and portfolio management.
Guerard Jr, J.B., 2013. Introduction to financial forecasting in investment analysis.
Springer Science & Business Media.
Heikal, M., Khaddafi, M. and Ummah, A., 2014. Influence analysis of return on assets
(ROA), return on equity (ROE), net profit margin (NPM), debt to equity ratio (DER),
and current ratio (CR), against corporate profit growth in automotive in Indonesia stock
exchange. International Journal of Academic Research in Business and Social
Sciences, 4(12), p.101.
Mtridleymines.com.au., 2018. Mount Ridley Mines - Home. [online] Available at:
http://www.mtridleymines.com.au/ [Accessed 29 Jan. 2018].
Renneboog, L. and Szilagyi, P.G., 2015. How relevant is dividend policy under low
shareholder protection?. Journal of International Financial Markets, Institutions and
Money.
chevron_up_icon
1 out of 9
circle_padding
hide_on_mobile
zoom_out_icon
logo.png

Your All-in-One AI-Powered Toolkit for Academic Success.

Available 24*7 on WhatsApp / Email

[object Object]