MAT111A - College Algebra Quiz 3

Verified

Added on  2020/03/02

|15
|1571
|454
Quiz and Exam
AI Summary
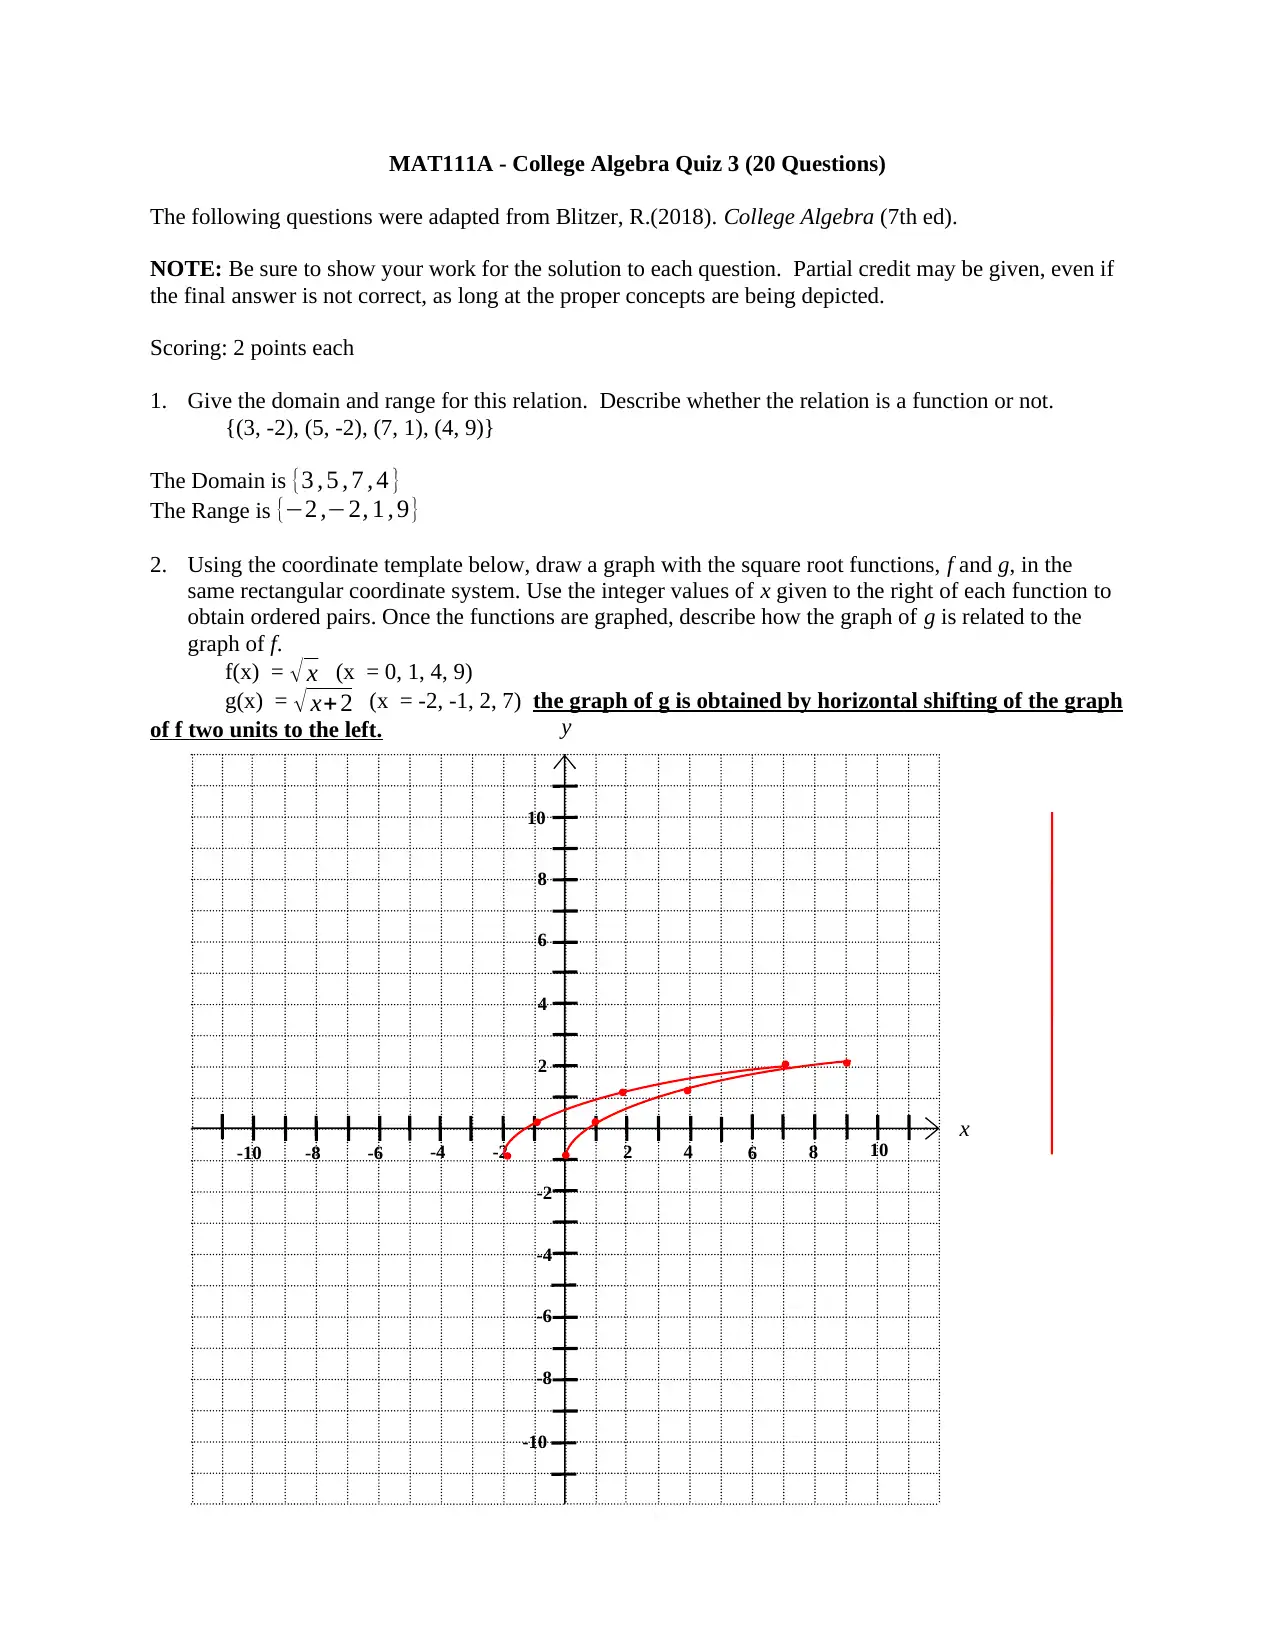
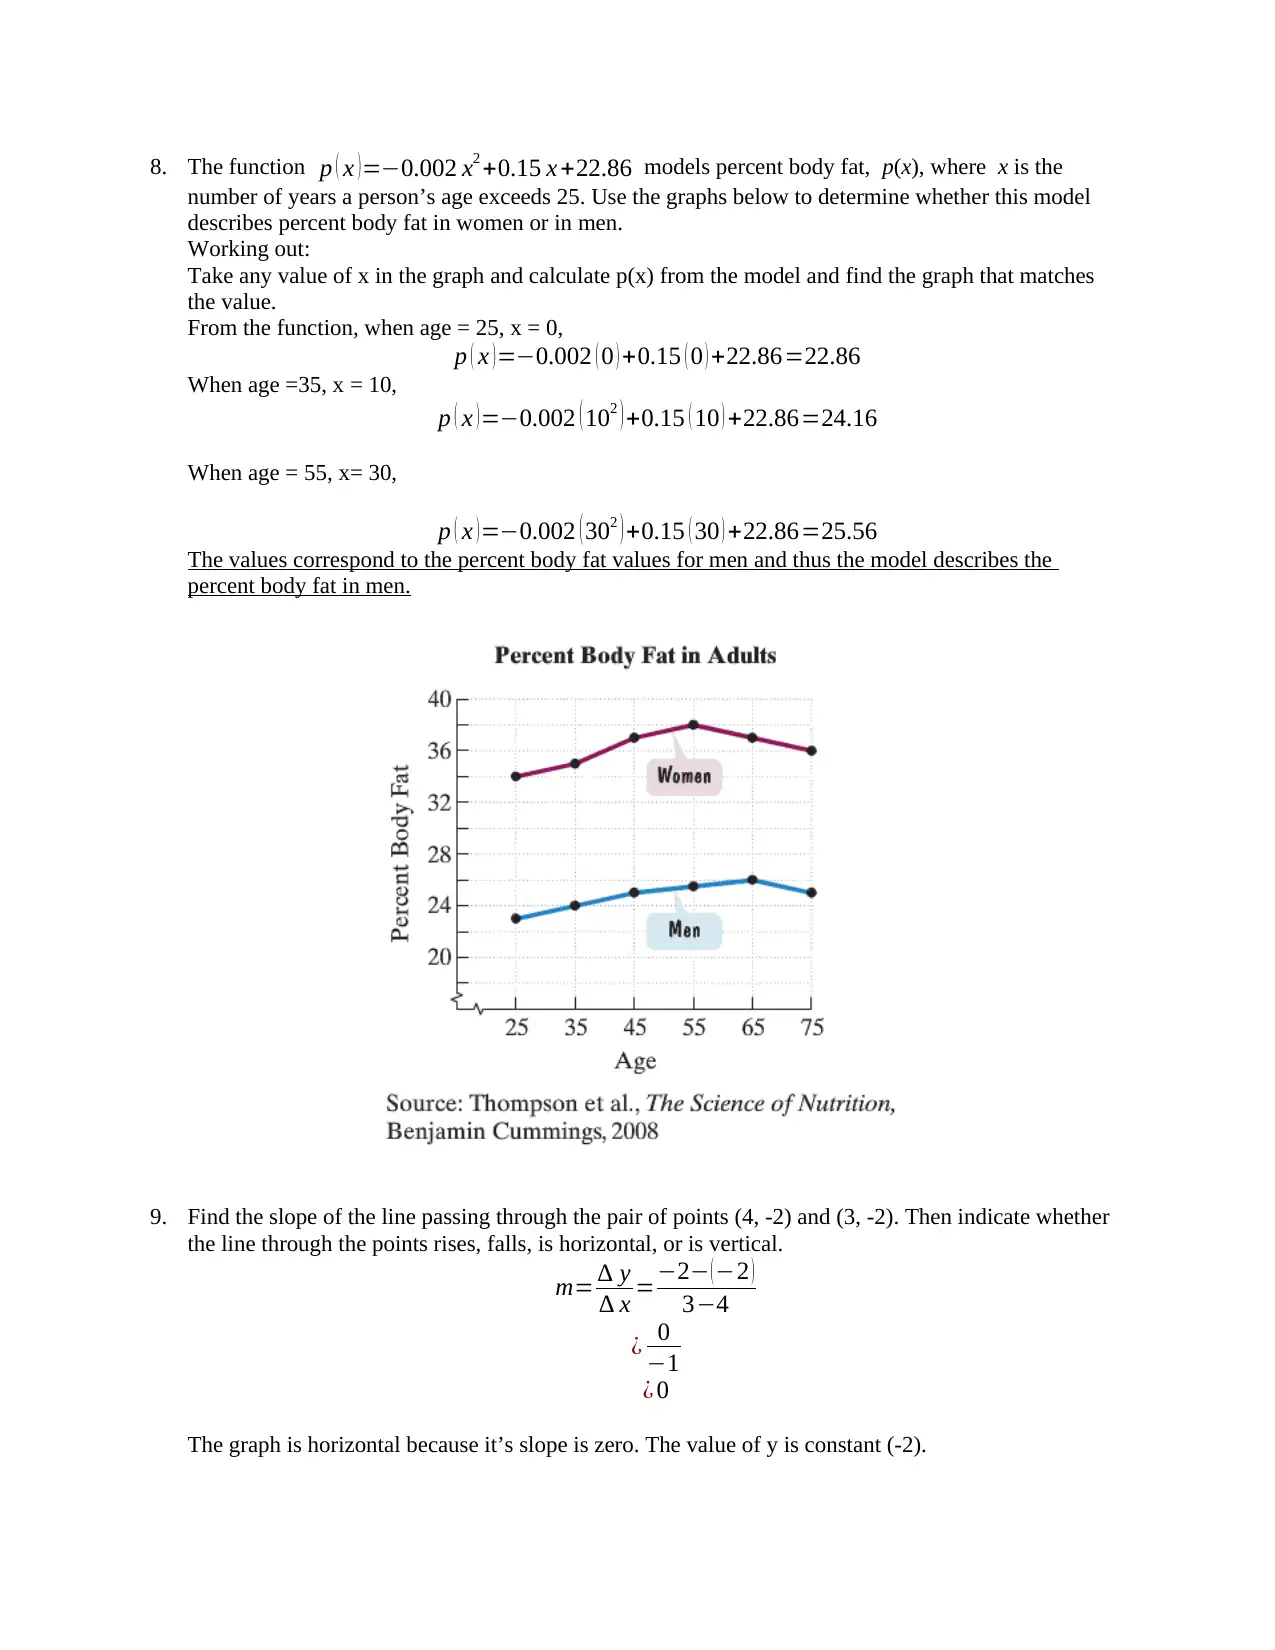
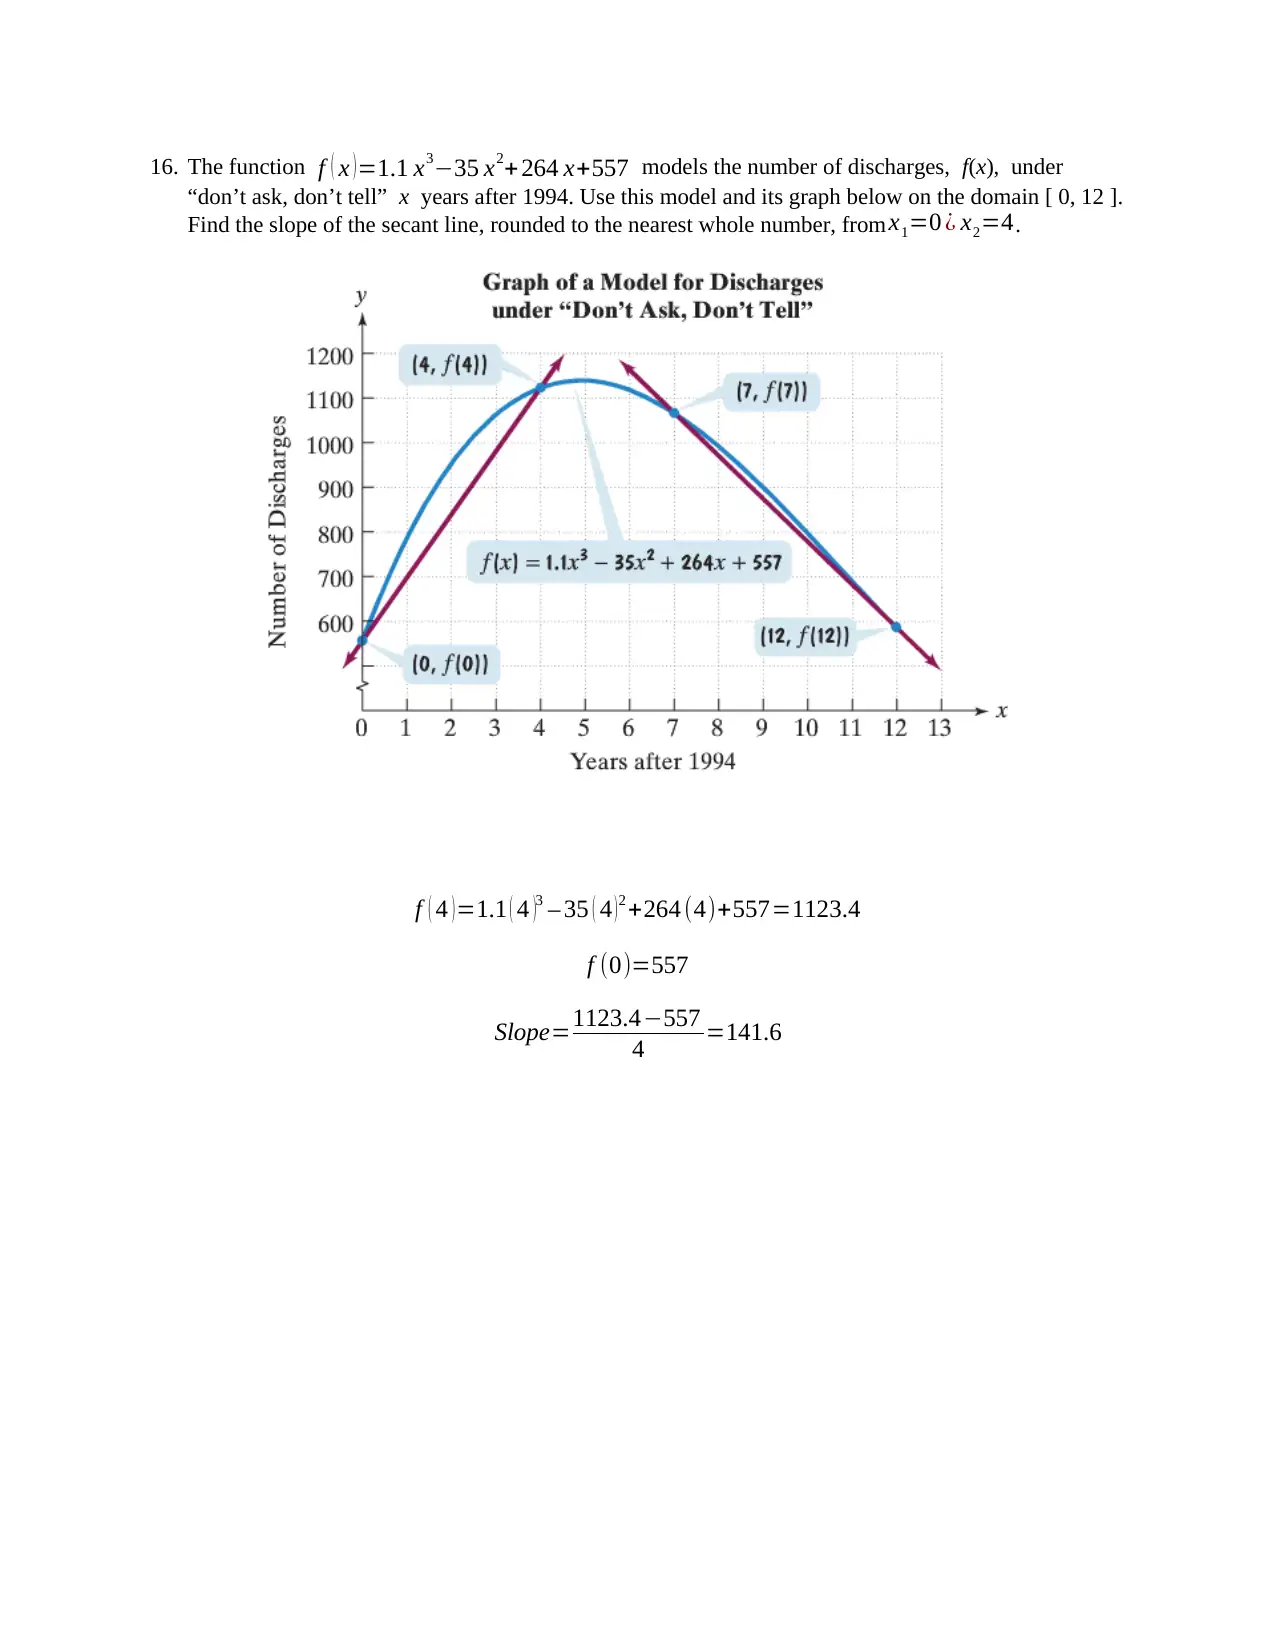
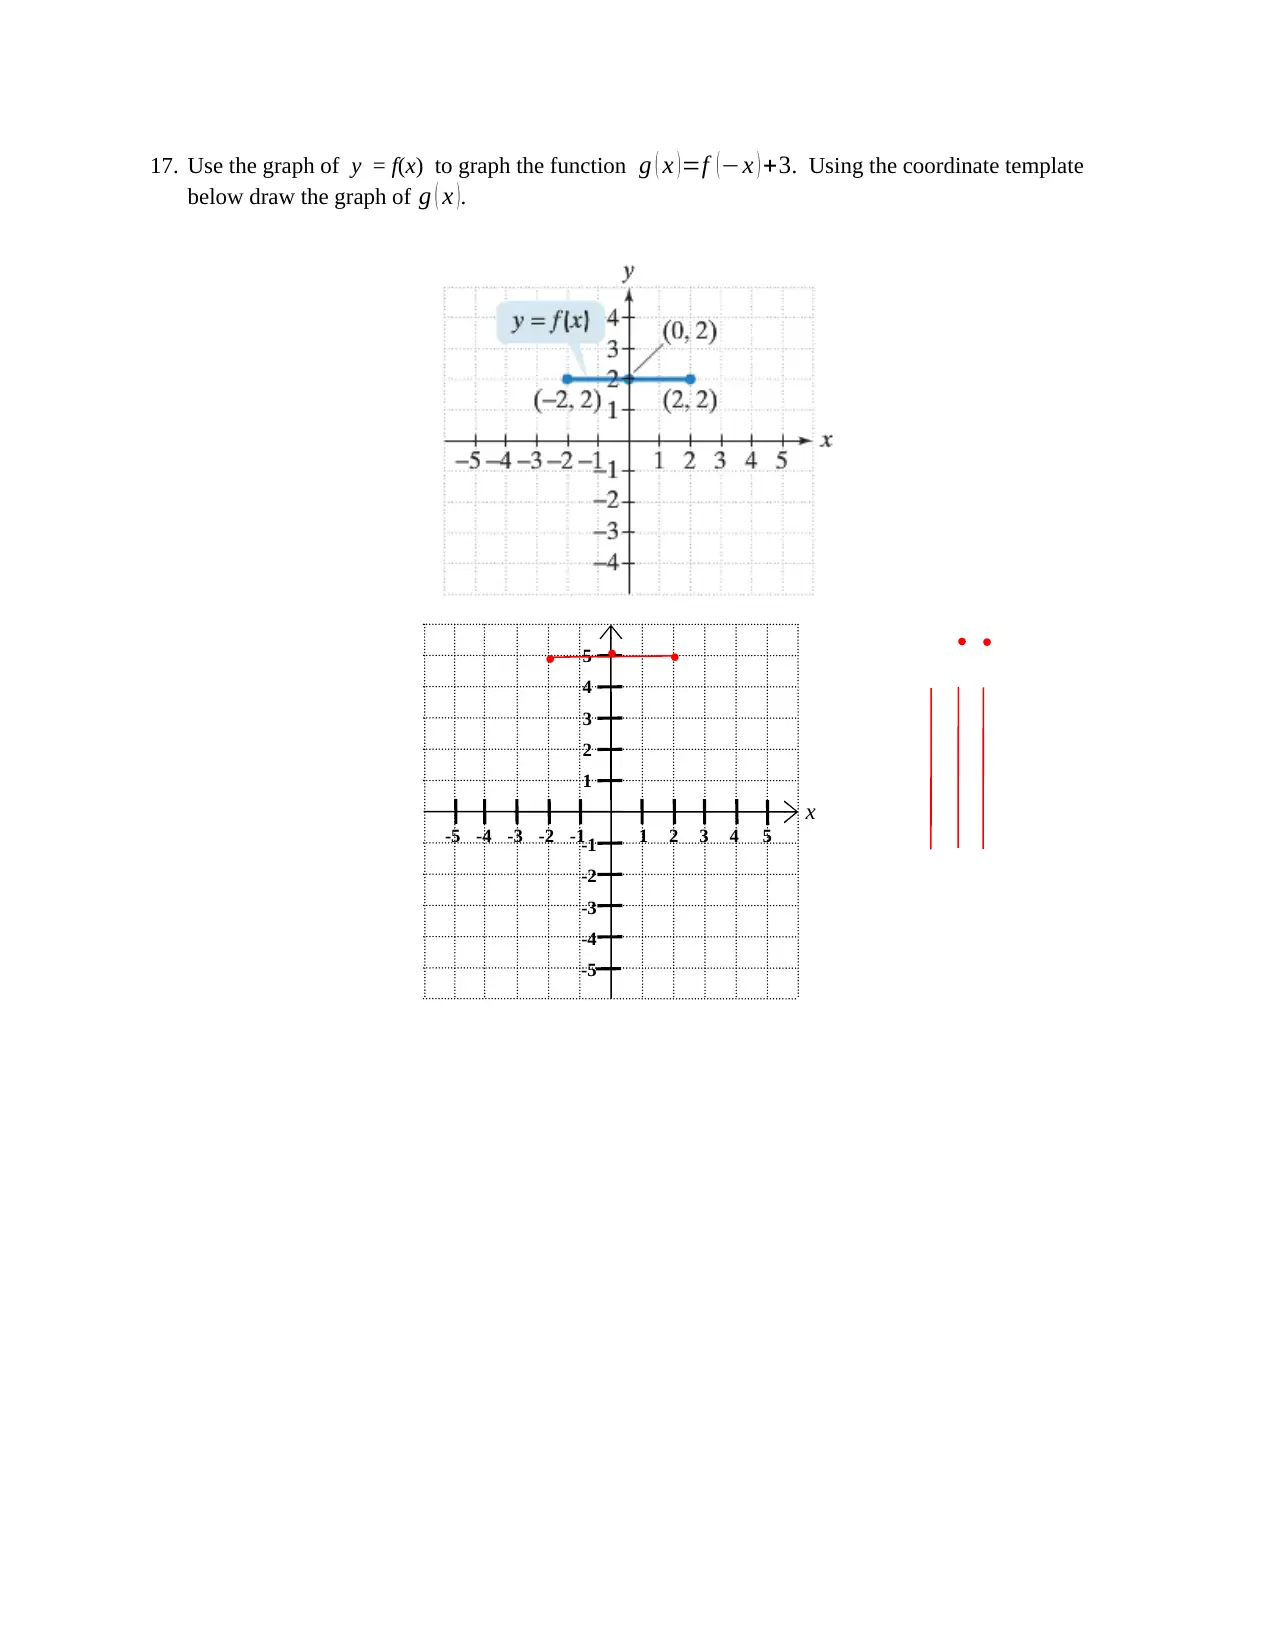
This assignment is a quiz for MAT111A - College Algebra, consisting of 20 questions that cover various topics such as functions, domain, range, graphing, and transformations. Students are required to show their work for each question to receive partial credit. The quiz includes tasks like determining if a relation is a function, analyzing graphs, and calculating slopes.
tabler-icon-diamond-filled.svg

Contribute Materials

Your contribution can guide someone’s learning journey. Share your documents today.
Document Page
MAT111A - College Algebra Quiz 3 (20 Questions)
The following questions were adapted from Blitzer, R.(2018). College Algebra (7th ed).
NOTE: Be sure to show your work for the solution to each question. Partial credit may be given, even if
the final answer is not correct, as long at the proper concepts are being depicted.
Scoring: 2 points each
1. Give the domain and range for this relation. Describe whether the relation is a function or not.
{(3, -2), (5, -2), (7, 1), (4, 9)}
The Domain is {3 , 5 , 7 , 4 }
The Range is {2 ,2, 1 , 9}
2. Using the coordinate template below, draw a graph with the square root functions, f and g, in the
same rectangular coordinate system. Use the integer values of x given to the right of each function to
obtain ordered pairs. Once the functions are graphed, describe how the graph of g is related to the
graph of f.
f(x) = x (x = 0, 1, 4, 9)
g(x) = x+ 2 (x = -2, -1, 2, 7) the graph of g is obtained by horizontal shifting of the graph
of f two units to the left. y
-10 -8 108
-10
-8
10
8
-6 6-4 -2 42
x
6
-6
-4
-2
4
2
tabler-icon-diamond-filled.svg

Secure Best Marks with AI Grader

Need help grading? Try our AI Grader for instant feedback on your assignments.
Document Page
Document Page
3. Evaluate the graph below and determine if y is a function of x. Describe the method used for this
determination.
y is a function of x. from the graph, it is seen that every element of x corresponds to only 1
element of y. for a function, each element of x should be paired to only 1 element of y, (i.e. each
element in the domain must correspond to exactly 1 element in the range). any vertical line drawn
intersects the graph only once hence y is a function of x.
4. Use the graph below to determine:
a. the function’s domain = ( ,+ )
b. the function’s range =¿
c. the x-intercepts, if any ¿1
d. the y-intercept, if any ¿ 1
e. the function’s values f (4 )and f ( 3 )
f (4 )=3
f (3)=4
Document Page
5. Use the graph below to determine:
a. the intervals on which the function is increasing, if any = (,1)
b. the intervals on which the function is decreasing, if any = none
c. the intervals on which the function is constant, if any = (1 ,+)
6. Examine the graph below, use possible symmetry to determine whether the graph is the graph of an
even function, an odd function, or a function that is neither even nor odd.
The graph of an odd function
tabler-icon-diamond-filled.svg

Secure Best Marks with AI Grader

Need help grading? Try our AI Grader for instant feedback on your assignments.
Document Page
7. Use the graph of f below to determine each of the following. Where applicable, use interval notation.
a. the domain of f = ¿
b. the range of f ¿ ¿
c. f(0) = 3
d. intervals on which f is increasing (, 1)
e. intervals on which f is decreasing (1, 3]
f. values of x for which f ( x) 0 ¿
g. any relative maxima and the numbers at which they occur a maxima of 4 occurs when
x=1
h. the value of x for which f(x) = 4 x =1
i. Is f(-1) positive or negative? Positive
Document Page
8. The function p ( x )=0.002 x2 +0.15 x +22.86 models percent body fat, p(x), where x is the
number of years a person’s age exceeds 25. Use the graphs below to determine whether this model
describes percent body fat in women or in men.
Working out:
Take any value of x in the graph and calculate p(x) from the model and find the graph that matches
the value.
From the function, when age = 25, x = 0,
p ( x )=0.002 ( 0 ) +0.15 ( 0 ) +22.86=22.86
When age =35, x = 10,
p ( x )=0.002 ( 102 ) +0.15 ( 10 ) +22.86=24.16
When age = 55, x= 30,
p ( x )=0.002 ( 302 ) +0.15 ( 30 ) +22.86=25.56
The values correspond to the percent body fat values for men and thus the model describes the
percent body fat in men.
9. Find the slope of the line passing through the pair of points (4, -2) and (3, -2). Then indicate whether
the line through the points rises, falls, is horizontal, or is vertical.
m= y
x =2 ( 2 )
34
¿ 0
1
¿ 0
The graph is horizontal because it’s slope is zero. The value of y is constant (-2).
Document Page
10. Use the conditions of a line, Slope = -2/3, passed through (6, -2), to write an equation for the line in
point-slope form and slope-intercept form.
Point-slope form:
y(2)=2
3 (x6)
y +2=2
3 (x6)
Slope-intercept form:
y +2=2
3 (x6)
y +2=2
3 x +4
y=2
3 x +2
11. Give the slope and y-intercept of the line whose equation is f ( x ) = 2
5 x +6. Then graph the linear
function. Use the coordinate template below draw to graph f ( x ).
Slope: 2
5
y-intercept: 6
y
-10 -8 108
-10
-8
10
8
-6 6-4 -2 42
x
6
-6
-4
-2
4
2
tabler-icon-diamond-filled.svg

Paraphrase This Document

Need a fresh take? Get an instant paraphrase of this document with our AI Paraphraser
Document Page
Document Page
12. Find the value of y if the line through the two given points is to have the indicated slope.
( 3 , y ) ( 1,4 ) , m=3
m= y
x
3= 4 y
13
3 ( 13 ) =4 y
3(2)=4 y
6=4 y
2= y
y=2
13. Write an equation for line L in point-slope form and slope-intercept form.
14. Find the average rate of change of the function f ( x )=x22 x from x1=3 ¿ x2=6.
Average rate of change is the slope of the function ( y
x )
y
x =2 x2
Slope when x = 3:
Document Page
y
x =2 ( 3 )2=4
Slope when x=6: y
x =2 ( 6 ) 2=10
Average change in slope ¿ ( 104 )
( 63 ) = 6
3
¿ 2
15. Write an equation in slope-intercept form of a linear function f whose graph satisfies the following
conditions.
The graph of f is perpendicular to the line whose equation is 3 x2 y4=0and has the same
y-intercept as this line.
The line can be expressed in standard form to get the gradient and the y-intercept by making y the
subject.
2 y=3 x4
y= 3
2 x 2
Y-intercept ¿2
Gradient ¿ 3
2
For perpendicular lines, the product of the gradients is -1, i.e. m1 . m2=1
m 2=1
m1
¿ 1
( 3
2 )=2
3
The linear function f has a gradient of -2/3 and the y-intercept is -2. The equation of the function is:
y=2
3 x2
tabler-icon-diamond-filled.svg

Secure Best Marks with AI Grader

Need help grading? Try our AI Grader for instant feedback on your assignments.
Document Page
16. The function f ( x )=1.1 x335 x2+ 264 x+557 models the number of discharges, f(x), under
“don’t ask, don’t tell” x years after 1994. Use this model and its graph below on the domain [ 0, 12 ].
Find the slope of the secant line, rounded to the nearest whole number, from x1=0 ¿ x2=4.
f ( 4 ) =1.1 ( 4 )3 35 ( 4 ) 2 +264 (4)+557=1123.4
f (0)=557
Slope=1123.4557
4 =141.6
Document Page
17. Use the graph of y = f(x) to graph the function g ( x ) =f ( x ) +3. Using the coordinate template
below draw the graph of g ( x ).
-5
5
-5
5
-4
-3
-2
-1
4
3
2
1
-4 -3 -2 -1 4321
x
Document Page
18. Use the graph of y = f(x) to graph the function g ( x ) =2 f ( x+ 2 ) 1. Use the coordinate template
below to draw the graph of g ( x ).
-5
5
-5
5
-4
-3
-2
-1
4
3
2
1
-4 -3 -2 -1 4321
x
tabler-icon-diamond-filled.svg

Paraphrase This Document

Need a fresh take? Get an instant paraphrase of this document with our AI Paraphraser
Document Page
19. Graph the standard quadratic function, f (x)=x2. Then use transformations of this graph to graph
the function h(x )=2( x+2)2+ 1. Use the coordinate template below to draw the graph of h(x ).
h(x) = -2f(x+2)+1
Horizontal shift 2 units to the left and a Vertical shift 1 unit upwards followed by reflection along the
x-axis
-5
5
-5
5
-4
-3
-2
-1
4
3
2
1
-4 -3 -2 -1 4321
x
Document Page
20. The function f ( x)=3.1 x+ 19 models the median height, f(x), in inches, of girls who are x months
of age. The graph of f is shown below.
a. Describe how the graph can be obtained using transformations of the square root function
f ( x)= x.
The graph of f is stretched 3.1 times and vertically shifted 19 units upwards.
b. Use the model to find the average rate of change, in inches per month, between birth and 10
months. Round to the nearest tenth.
At x=10 , f ( x ) =3.1 10 +19 = 28.80
At x=0 , f ( x ) =3.1 0 +19 = 19
Rate of change = (28.80-19)/10
=0.98 inches/month
=1.0 inch/month
c. Use the model to find the average rate of change, in inches per month, between 50 and 60
months. Round to the nearest tenth. How does this compare with your answer in part (b)? How is
this difference shown by the graph?
At x=6 0 , f ( x )=3.1 6 0 +19 = 43.01
At x=5 0 , f ( x ) =3.1 5 0 +19 = 40.92
Rate of change = (43.01-40.92)/10
=0.2 inches/month
chevron_up_icon
1 out of 15
circle_padding
hide_on_mobile
zoom_out_icon
logo.png

Your All-in-One AI-Powered Toolkit for Academic Success.

Available 24*7 on WhatsApp / Email

[object Object]