MAT205 - Business Statistics Assignment 2: Hypothesis & Intervals
VerifiedAdded on 2023/06/11
|34
|6311
|80
Homework Assignment
AI Summary
This document presents a comprehensive solution to a business statistics assignment, addressing questions related to confidence intervals, hypothesis testing, and statistical analysis. The solution covers topics such as calculating confidence intervals for population means and proportions, conducting t-tests and z-tests, analyzing variances, and interpreting p-values. Specific questions addressed include those related to web page design preferences, reimbursement amounts, tea bag weights, and study times for different genders. The document includes detailed calculations, explanations of statistical concepts, and interpretations of results, providing a valuable resource for students studying business statistics. Desklib is a great platform for students looking for similar solved assignments and past papers.

Running head: BUSINESS STATISTICS
Business Statistics
Assignment 2
Name of the Student:
Name of the University:
Author Note:
Business Statistics
Assignment 2
Name of the Student:
Name of the University:
Author Note:
Paraphrase This Document
Need a fresh take? Get an instant paraphrase of this document with our AI Paraphraser
1BUSINESS STATISTICS
Table of Contents
Response to Question 8.57..............................................................................................................2
Response to Question 8.61..............................................................................................................3
Response to Question 8.65..............................................................................................................5
Response to Question 9.69..............................................................................................................6
Response to Question 9.73..............................................................................................................7
Response to Question 10.77............................................................................................................8
Response to Question 10.81..........................................................................................................12
Response to Question 12.73..........................................................................................................13
Response to Question 12.79..........................................................................................................19
Response to Question 12.81..........................................................................................................21
Response to Question 13.49..........................................................................................................24
Response to Question 13.51..........................................................................................................25
Response to Question 13.55..........................................................................................................29
2BUSINESS STATISTICS
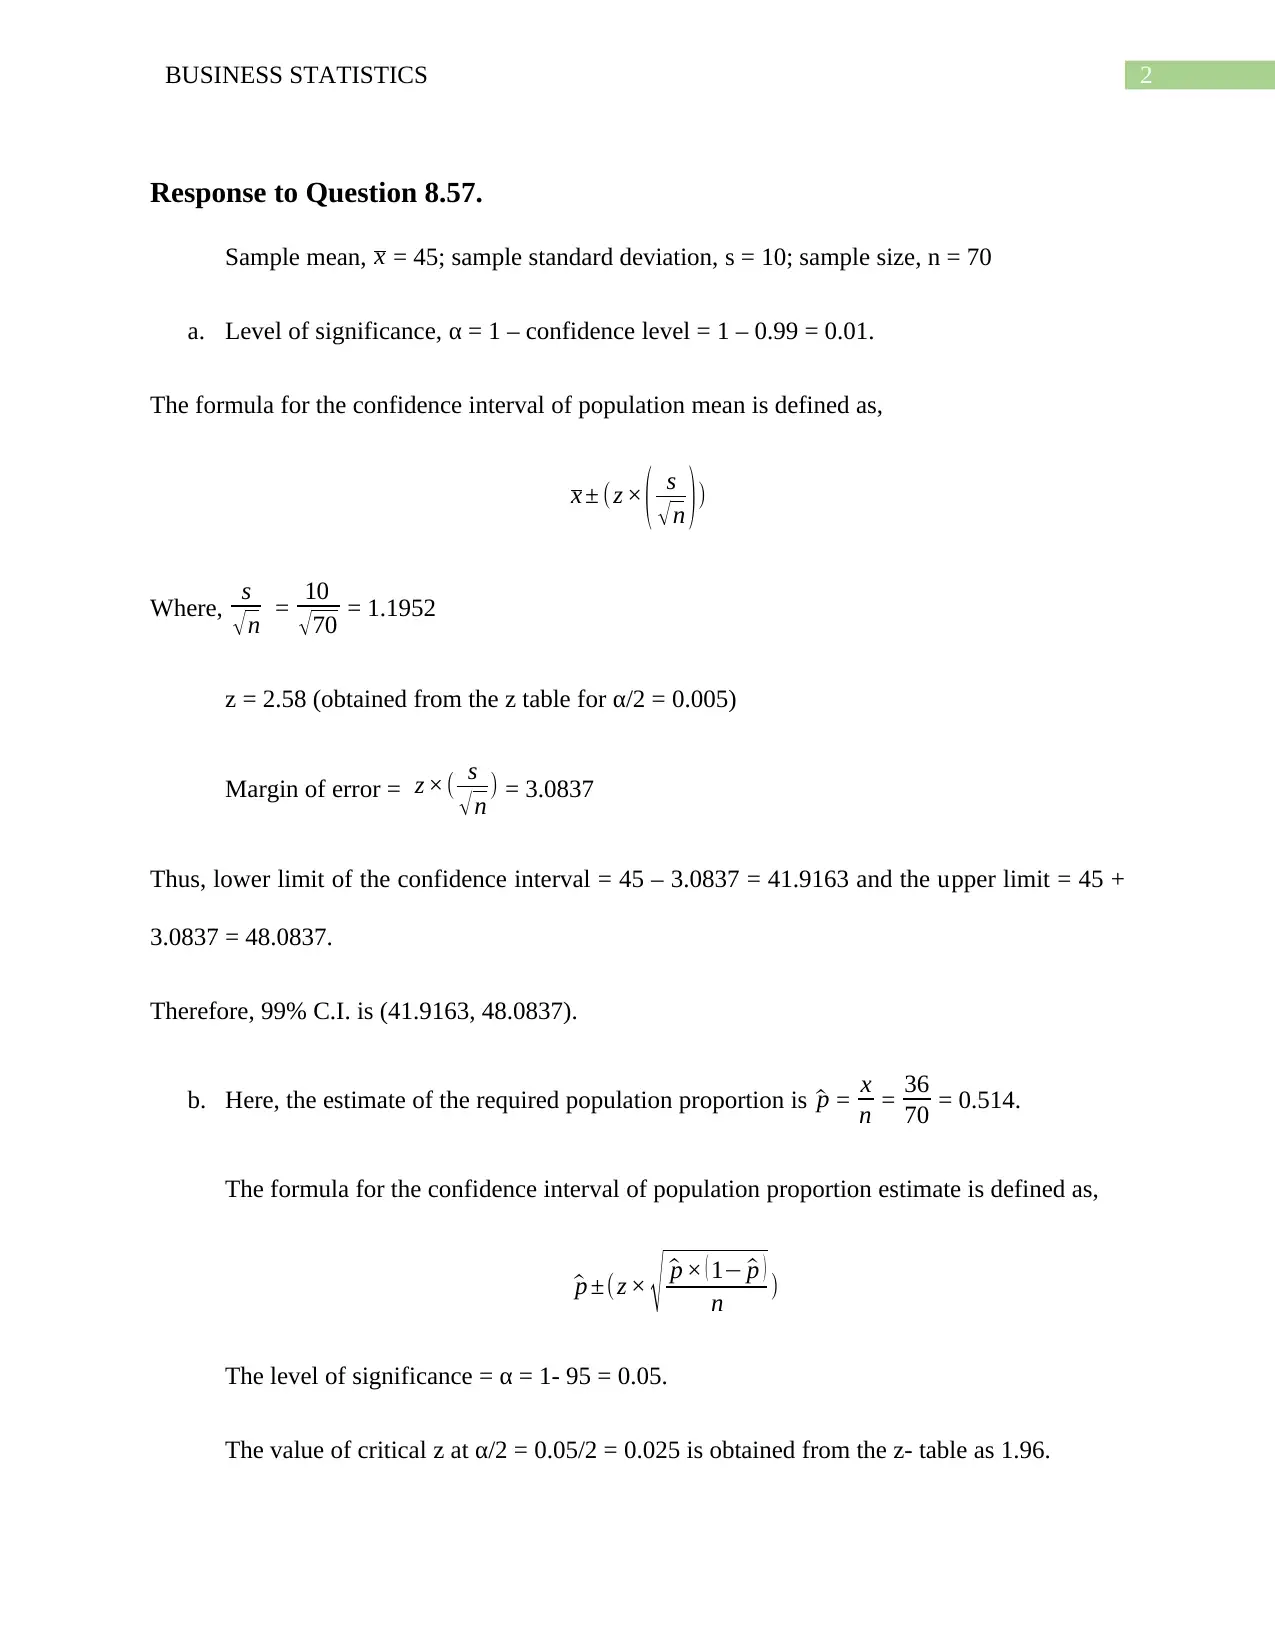
Response to Question 8.57.
Sample mean, x = 45; sample standard deviation, s = 10; sample size, n = 70
a. Level of significance, α = 1 – confidence level = 1 – 0.99 = 0.01.
The formula for the confidence interval of population mean is defined as,
x ± (z × ( s
√ n ) )
Where, s
√n = 10
√ 70 = 1.1952
z = 2.58 (obtained from the z table for α/2 = 0.005)
Margin of error = z ×( s
√ n ) = 3.0837
Thus, lower limit of the confidence interval = 45 – 3.0837 = 41.9163 and the upper limit = 45 +
3.0837 = 48.0837.
Therefore, 99% C.I. is (41.9163, 48.0837).
b. Here, the estimate of the required population proportion is ^p = x
n = 36
70 = 0.514.
The formula for the confidence interval of population proportion estimate is defined as,
^p ±(z × √ ^p × ( 1− ^p )
n )
The level of significance = α = 1- 95 = 0.05.
The value of critical z at α/2 = 0.05/2 = 0.025 is obtained from the z- table as 1.96.
⊘ This is a preview!⊘
Do you want full access?
Subscribe today to unlock all pages.
Trusted by 1+ million students worldwide
3BUSINESS STATISTICS
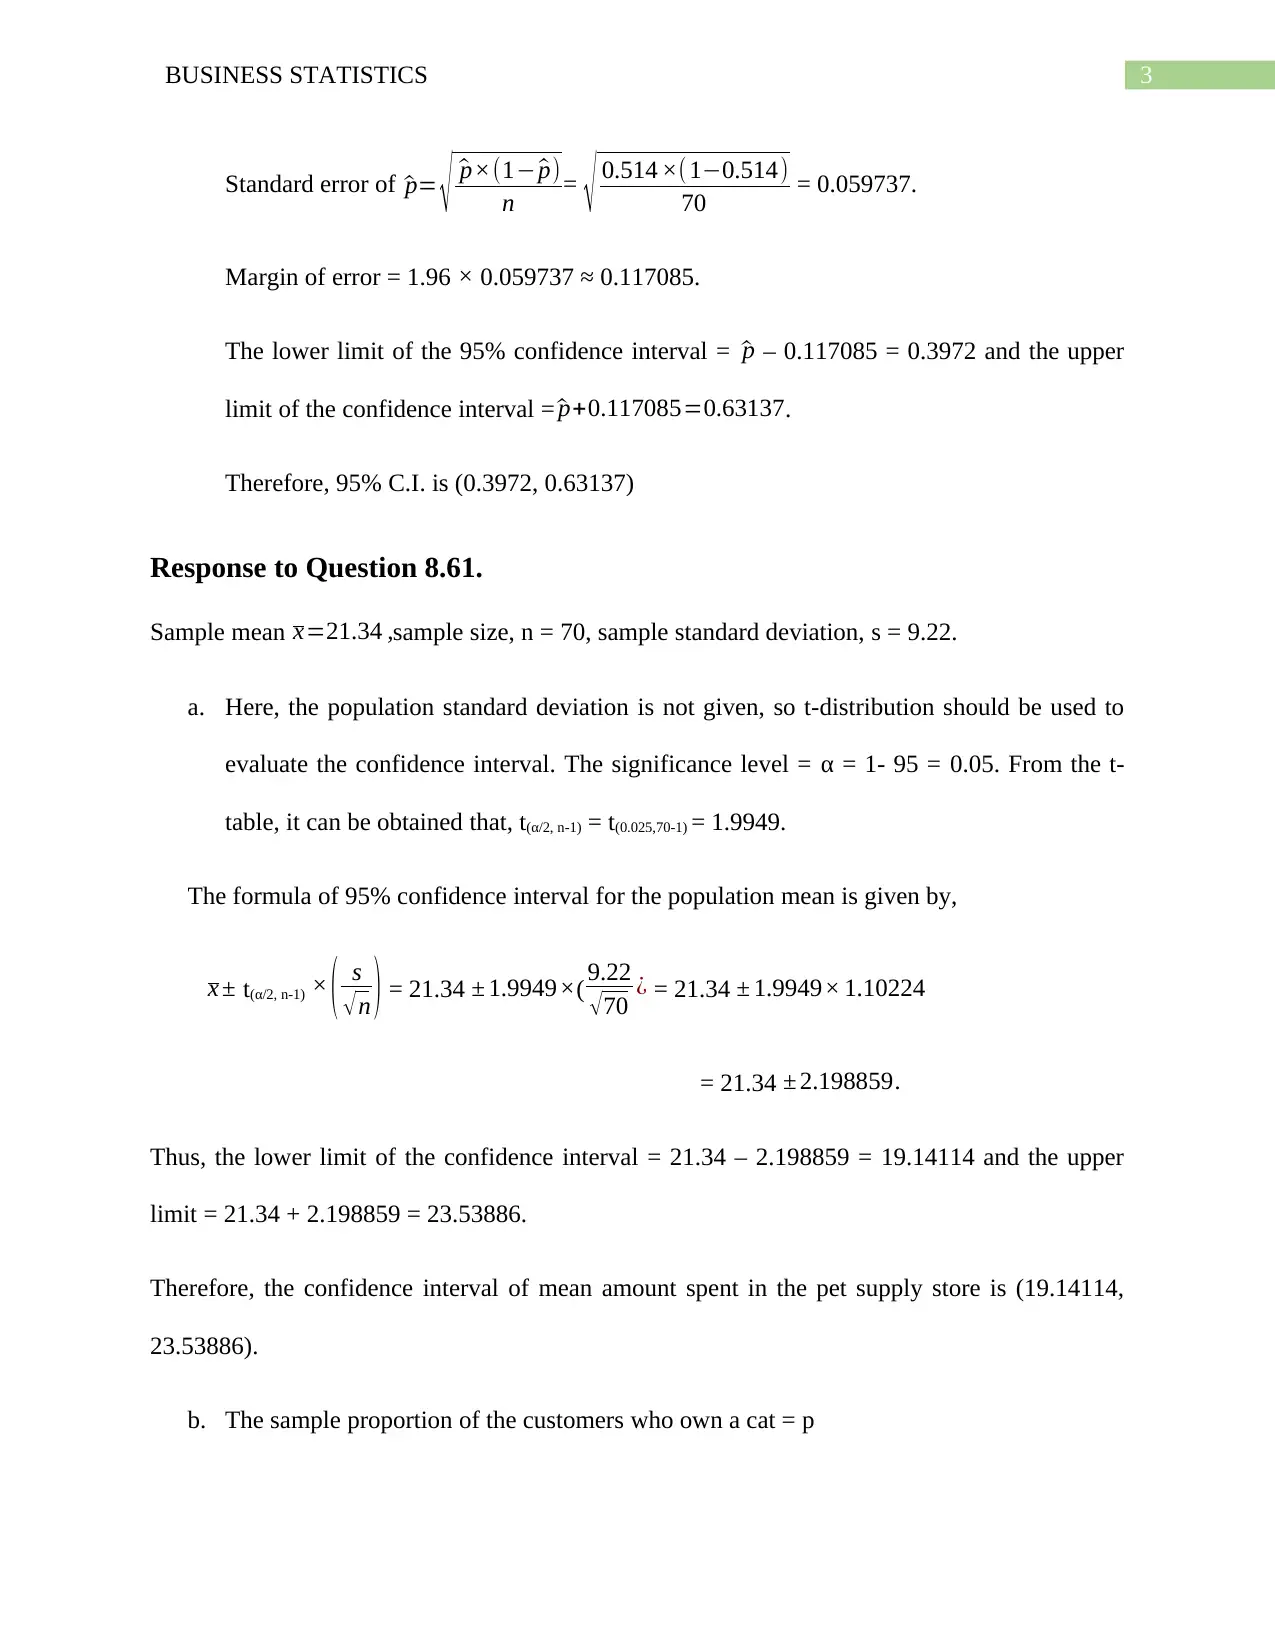
Standard error of ^p= √ ^p×(1− ^p)
n = √ 0.514 ×( 1−0.514)
70 = 0.059737.
Margin of error = 1.96 × 0.059737 ≈ 0.117085.
The lower limit of the 95% confidence interval = ^p – 0.117085 = 0.3972 and the upper
limit of the confidence interval = ^p+0.117085=0.63137.
Therefore, 95% C.I. is (0.3972, 0.63137)
Response to Question 8.61.
Sample mean x=21.34 ,sample size, n = 70, sample standard deviation, s = 9.22.
a. Here, the population standard deviation is not given, so t-distribution should be used to
evaluate the confidence interval. The significance level = α = 1- 95 = 0.05. From the t-
table, it can be obtained that, t(α/2, n-1) = t(0.025,70-1) = 1.9949.
The formula of 95% confidence interval for the population mean is given by,
x ± t(α/2, n-1) × ( s
√ n ) = 21.34 ± 1.9949×( 9.22
√ 70 ¿ = 21.34 ± 1.9949× 1.10224
= 21.34 ± 2.198859.
Thus, the lower limit of the confidence interval = 21.34 – 2.198859 = 19.14114 and the upper
limit = 21.34 + 2.198859 = 23.53886.
Therefore, the confidence interval of mean amount spent in the pet supply store is (19.14114,
23.53886).
b. The sample proportion of the customers who own a cat = p
Paraphrase This Document
Need a fresh take? Get an instant paraphrase of this document with our AI Paraphraser
4BUSINESS STATISTICS
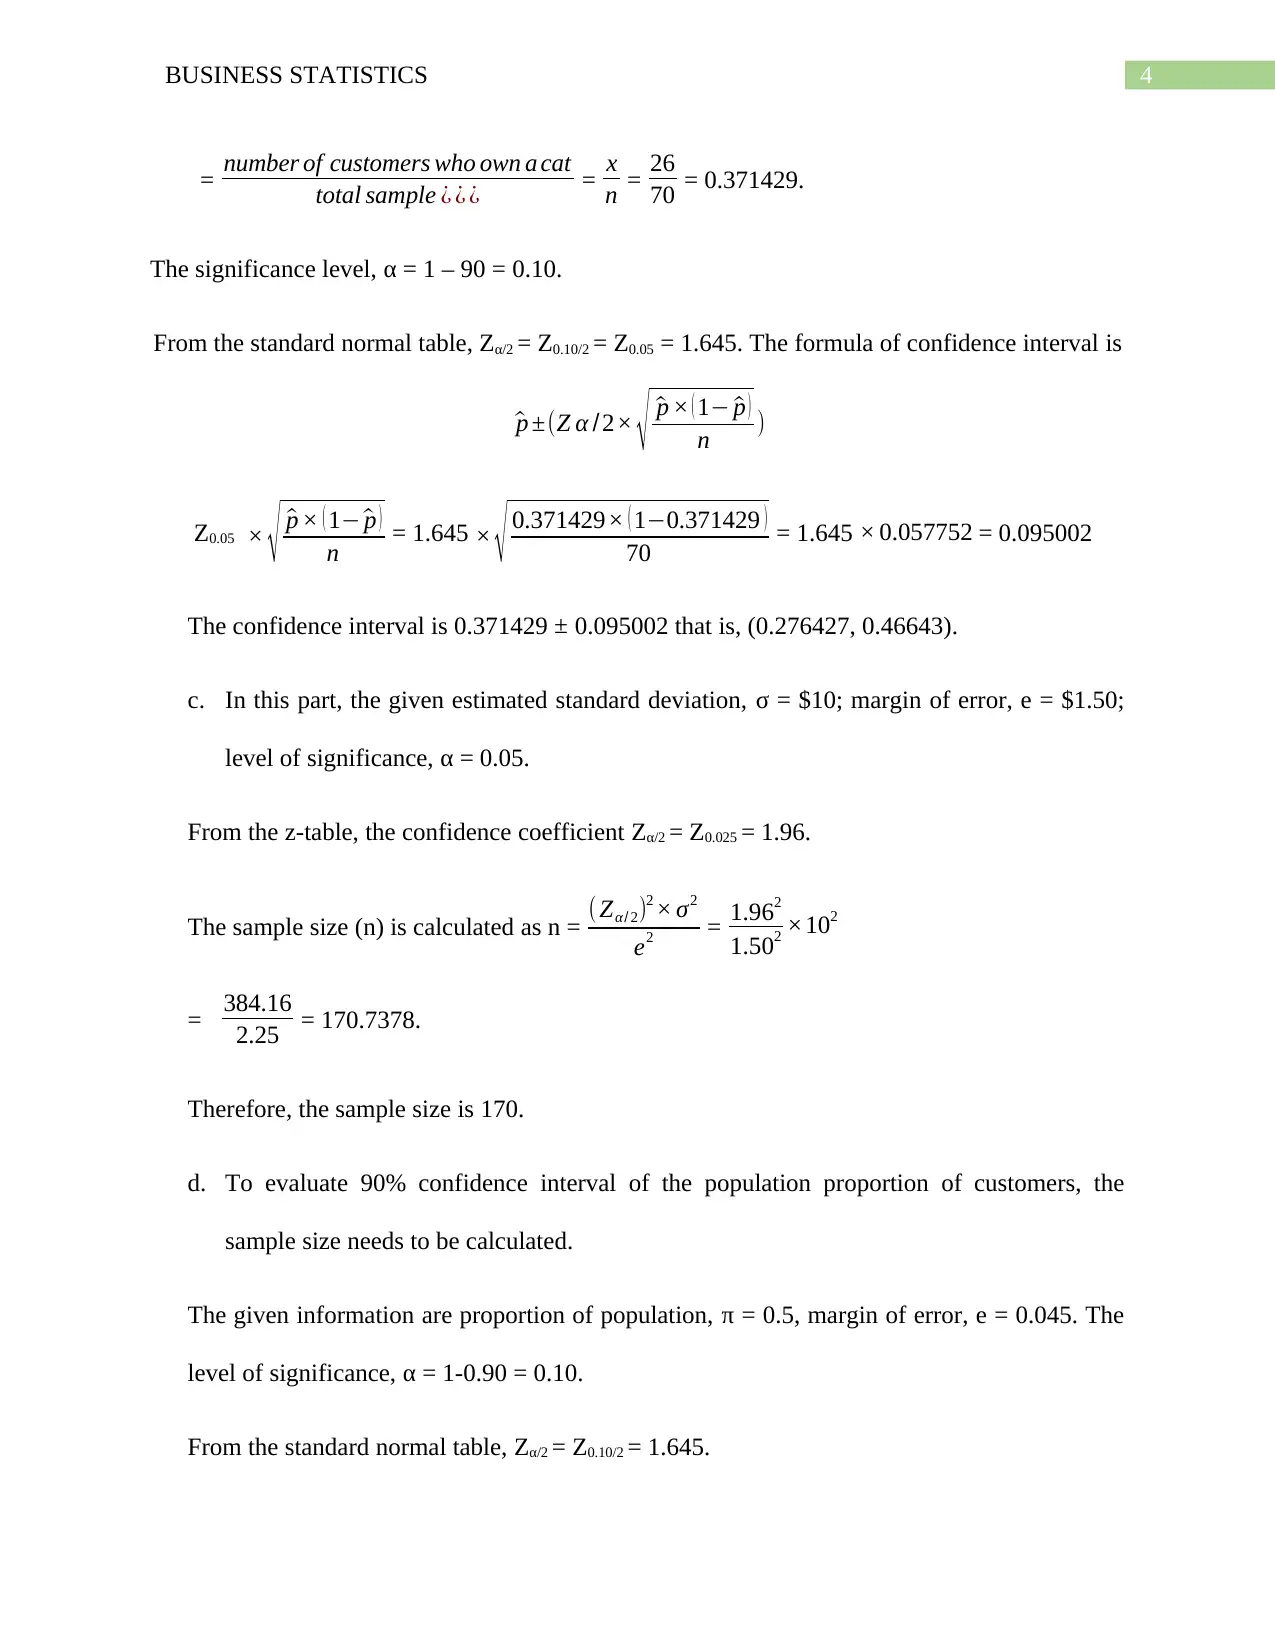
= number of customers who own a cat
total sample ¿ ¿ ¿ = x
n = 26
70 = 0.371429.
The significance level, α = 1 – 90 = 0.10.
From the standard normal table, Zα/2 = Z0.10/2 = Z0.05 = 1.645. The formula of confidence interval is
^p ±(Z α /2× √ ^p × ( 1− ^p )
n )
Z0.05 × √ ^p × ( 1− ^p )
n = 1.645 × √ 0.371429× ( 1−0.371429 )
70 = 1.645 × 0.057752 = 0.095002
The confidence interval is 0.371429 ± 0.095002 that is, (0.276427, 0.46643).
c. In this part, the given estimated standard deviation, σ = $10; margin of error, e = $1.50;
level of significance, α = 0.05.
From the z-table, the confidence coefficient Zα/2 = Z0.025 = 1.96.
The sample size (n) is calculated as n = ( Zα/ 2)2 × σ2
e2 = 1.962
1.502 ×102
= 384.16
2.25 = 170.7378.
Therefore, the sample size is 170.
d. To evaluate 90% confidence interval of the population proportion of customers, the
sample size needs to be calculated.
The given information are proportion of population, π = 0.5, margin of error, e = 0.045. The
level of significance, α = 1-0.90 = 0.10.
From the standard normal table, Zα/2 = Z0.10/2 = 1.645.
5BUSINESS STATISTICS
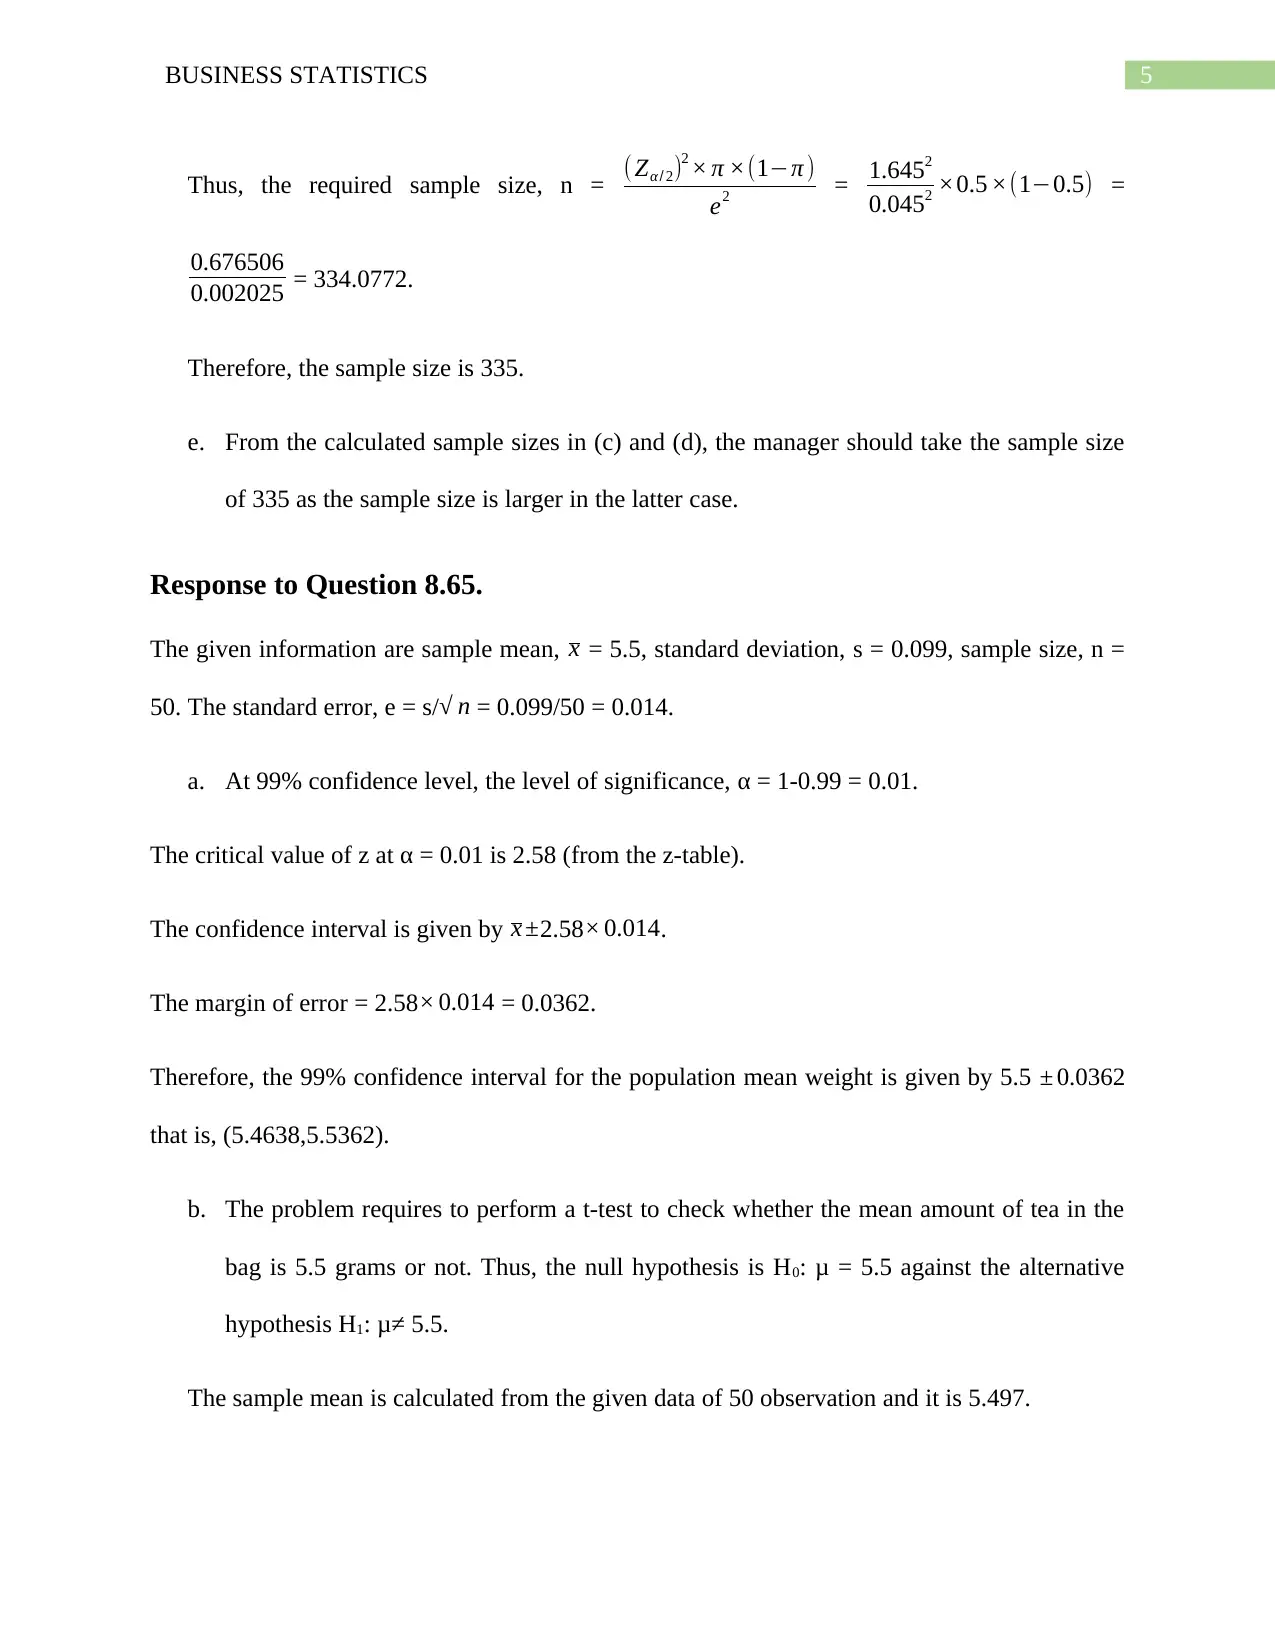
Thus, the required sample size, n = ( Zα/ 2)2 × π ×(1−π )
e2 = 1.6452
0.0452 ×0.5 ×(1−0.5) =
0.676506
0.002025 = 334.0772.
Therefore, the sample size is 335.
e. From the calculated sample sizes in (c) and (d), the manager should take the sample size
of 335 as the sample size is larger in the latter case.
Response to Question 8.65.
The given information are sample mean, x = 5.5, standard deviation, s = 0.099, sample size, n =
50. The standard error, e = s/√ n = 0.099/50 = 0.014.
a. At 99% confidence level, the level of significance, α = 1-0.99 = 0.01.
The critical value of z at α = 0.01 is 2.58 (from the z-table).
The confidence interval is given by x ±2.58× 0.014.
The margin of error = 2.58 × 0.014 = 0.0362.
Therefore, the 99% confidence interval for the population mean weight is given by 5.5 ± 0.0362
that is, (5.4638,5.5362).
b. The problem requires to perform a t-test to check whether the mean amount of tea in the
bag is 5.5 grams or not. Thus, the null hypothesis is H0: μ = 5.5 against the alternative
hypothesis H1: μ≠ 5.5.
The sample mean is calculated from the given data of 50 observation and it is 5.497.
⊘ This is a preview!⊘
Do you want full access?
Subscribe today to unlock all pages.
Trusted by 1+ million students worldwide
6BUSINESS STATISTICS
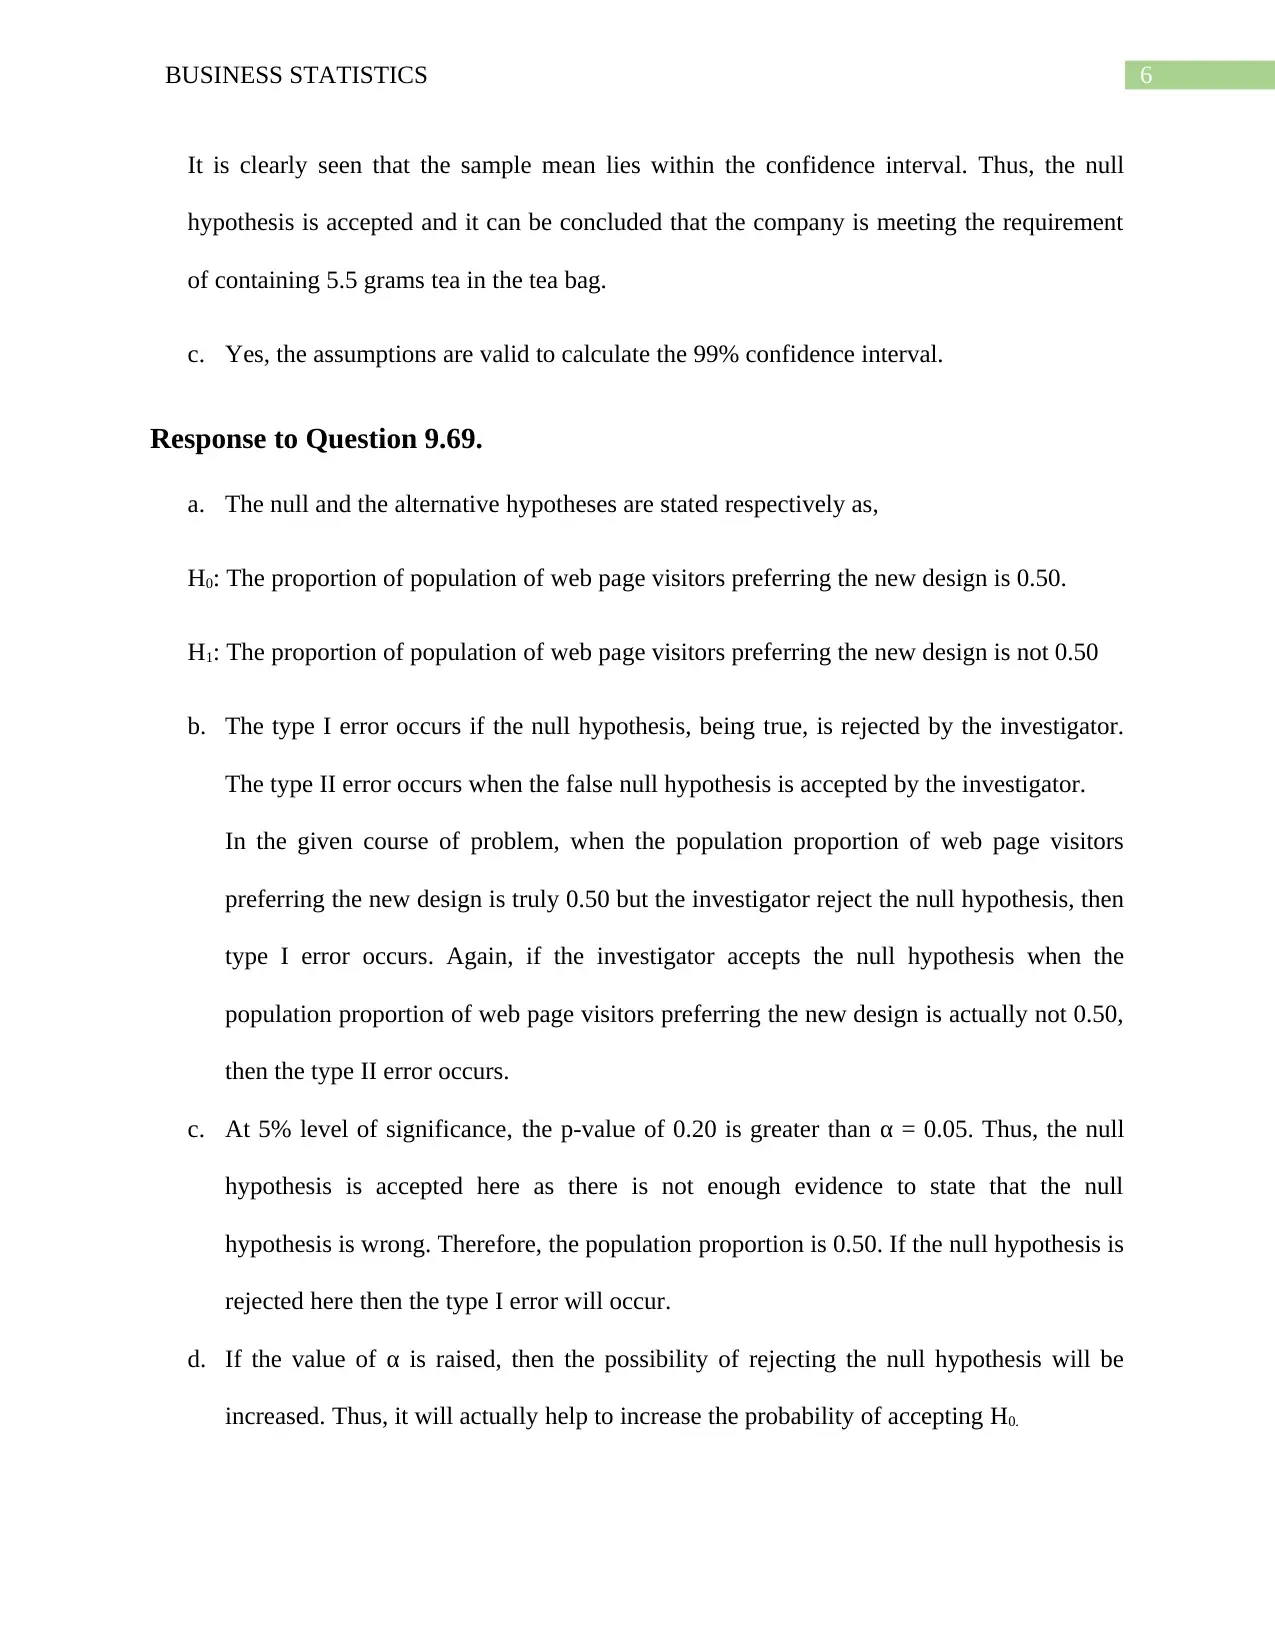
It is clearly seen that the sample mean lies within the confidence interval. Thus, the null
hypothesis is accepted and it can be concluded that the company is meeting the requirement
of containing 5.5 grams tea in the tea bag.
c. Yes, the assumptions are valid to calculate the 99% confidence interval.
Response to Question 9.69.
a. The null and the alternative hypotheses are stated respectively as,
H0: The proportion of population of web page visitors preferring the new design is 0.50.
H1: The proportion of population of web page visitors preferring the new design is not 0.50
b. The type I error occurs if the null hypothesis, being true, is rejected by the investigator.
The type II error occurs when the false null hypothesis is accepted by the investigator.
In the given course of problem, when the population proportion of web page visitors
preferring the new design is truly 0.50 but the investigator reject the null hypothesis, then
type I error occurs. Again, if the investigator accepts the null hypothesis when the
population proportion of web page visitors preferring the new design is actually not 0.50,
then the type II error occurs.
c. At 5% level of significance, the p-value of 0.20 is greater than α = 0.05. Thus, the null
hypothesis is accepted here as there is not enough evidence to state that the null
hypothesis is wrong. Therefore, the population proportion is 0.50. If the null hypothesis is
rejected here then the type I error will occur.
d. If the value of α is raised, then the possibility of rejecting the null hypothesis will be
increased. Thus, it will actually help to increase the probability of accepting H0.
Paraphrase This Document
Need a fresh take? Get an instant paraphrase of this document with our AI Paraphraser
7BUSINESS STATISTICS
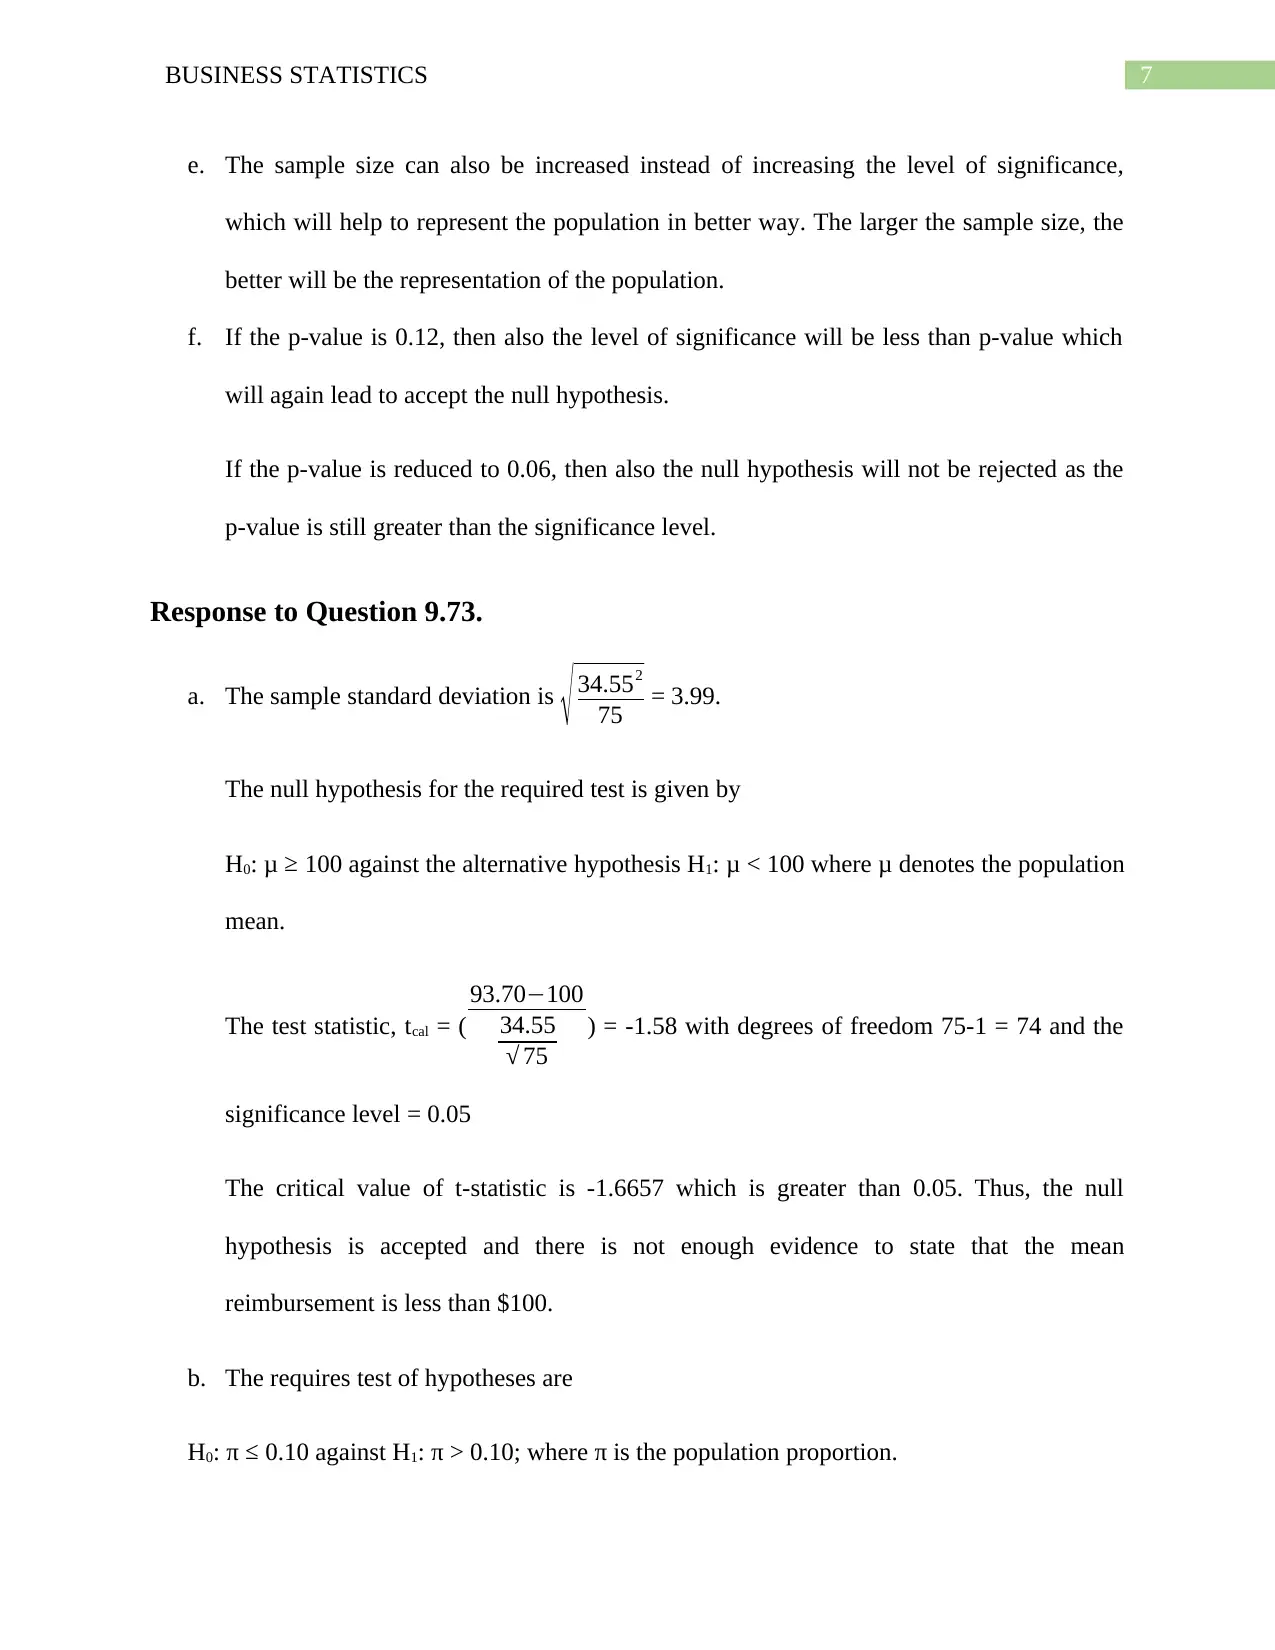
e. The sample size can also be increased instead of increasing the level of significance,
which will help to represent the population in better way. The larger the sample size, the
better will be the representation of the population.
f. If the p-value is 0.12, then also the level of significance will be less than p-value which
will again lead to accept the null hypothesis.
If the p-value is reduced to 0.06, then also the null hypothesis will not be rejected as the
p-value is still greater than the significance level.
Response to Question 9.73.
a. The sample standard deviation is √ 34.552
75 = 3.99.
The null hypothesis for the required test is given by
H0: μ ≥ 100 against the alternative hypothesis H1: μ < 100 where μ denotes the population
mean.
The test statistic, tcal = (
93.70−100
34.55
√ 75
) = -1.58 with degrees of freedom 75-1 = 74 and the
significance level = 0.05
The critical value of t-statistic is -1.6657 which is greater than 0.05. Thus, the null
hypothesis is accepted and there is not enough evidence to state that the mean
reimbursement is less than $100.
b. The requires test of hypotheses are
H0: π ≤ 0.10 against H1: π > 0.10; where π is the population proportion.
8BUSINESS STATISTICS
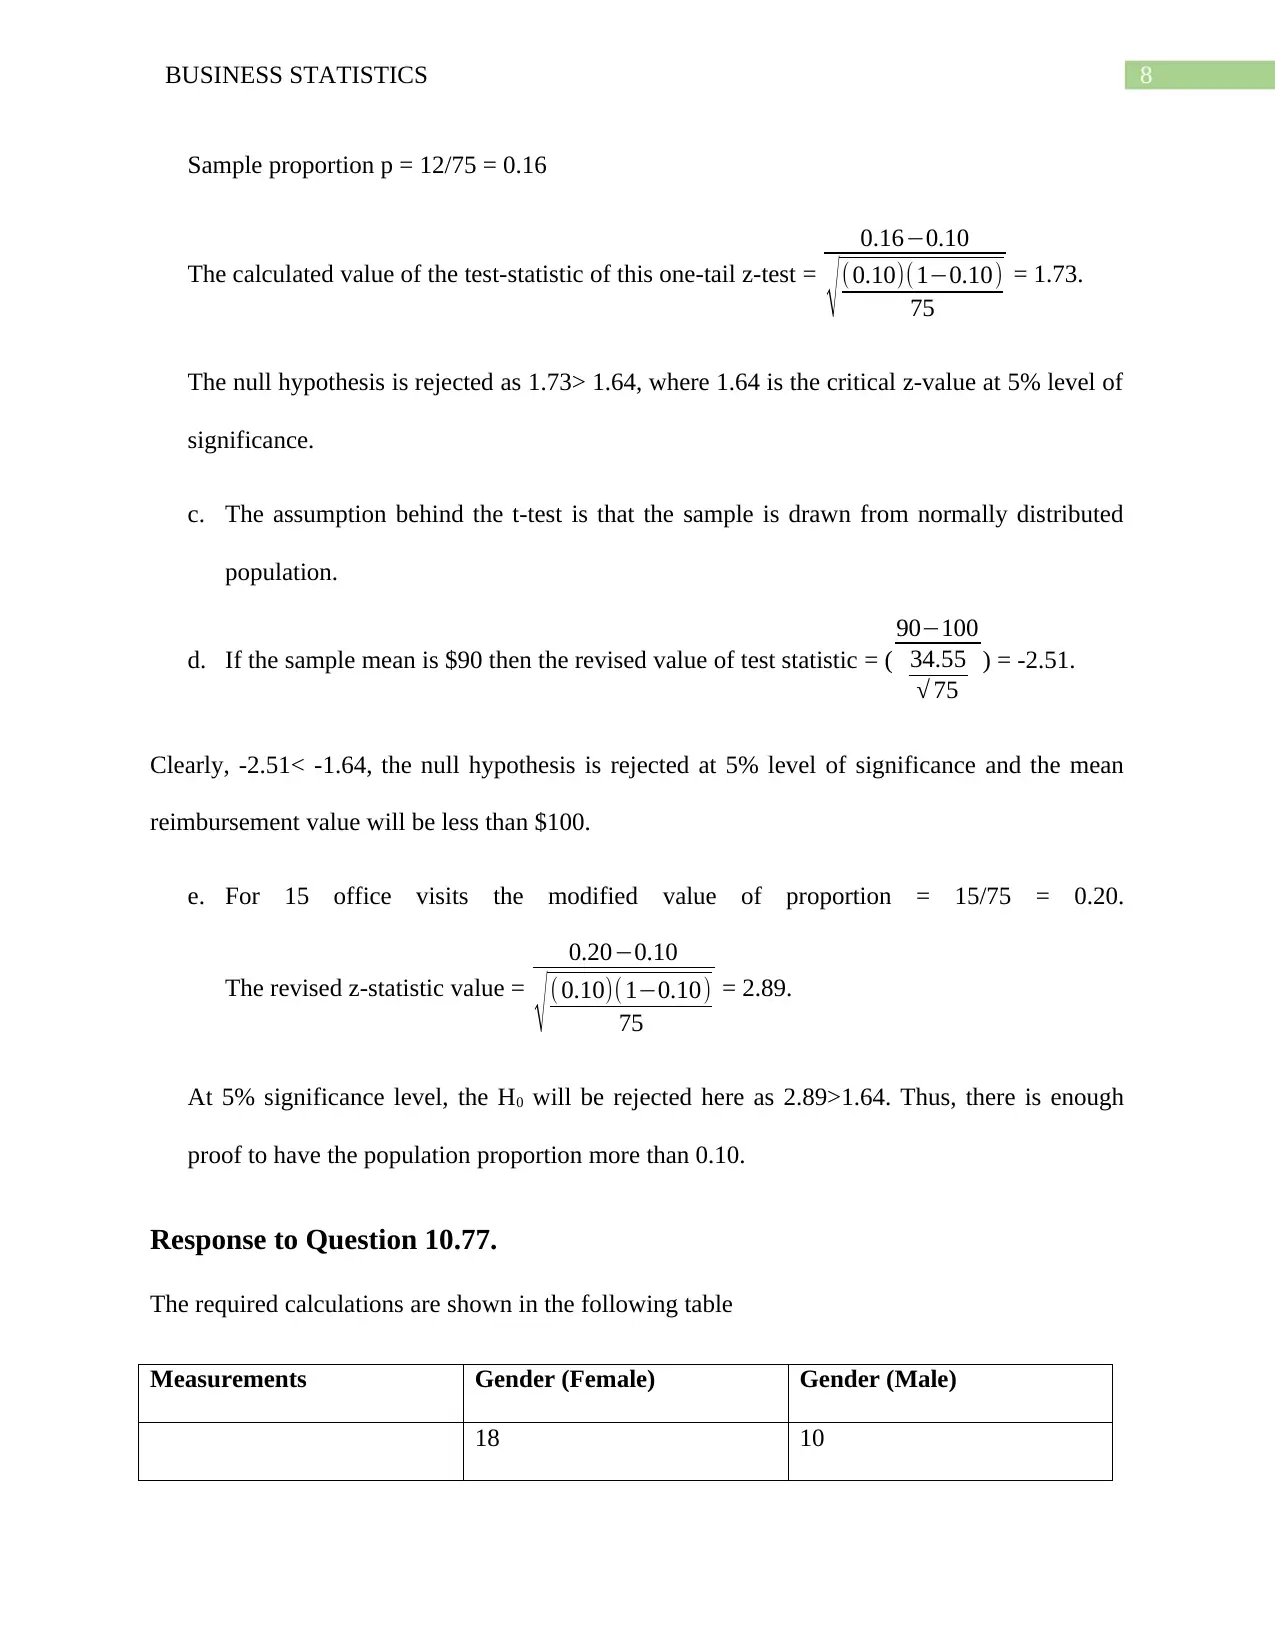
Sample proportion p = 12/75 = 0.16
The calculated value of the test-statistic of this one-tail z-test =
0.16−0.10
√ (0.10)(1−0.10)
75
= 1.73.
The null hypothesis is rejected as 1.73> 1.64, where 1.64 is the critical z-value at 5% level of
significance.
c. The assumption behind the t-test is that the sample is drawn from normally distributed
population.
d. If the sample mean is $90 then the revised value of test statistic = (
90−100
34.55
√ 75
) = -2.51.
Clearly, -2.51< -1.64, the null hypothesis is rejected at 5% level of significance and the mean
reimbursement value will be less than $100.
e. For 15 office visits the modified value of proportion = 15/75 = 0.20.
The revised z-statistic value =
0.20−0.10
√ ( 0.10)( 1−0.10)
75
= 2.89.
At 5% significance level, the H0 will be rejected here as 2.89>1.64. Thus, there is enough
proof to have the population proportion more than 0.10.
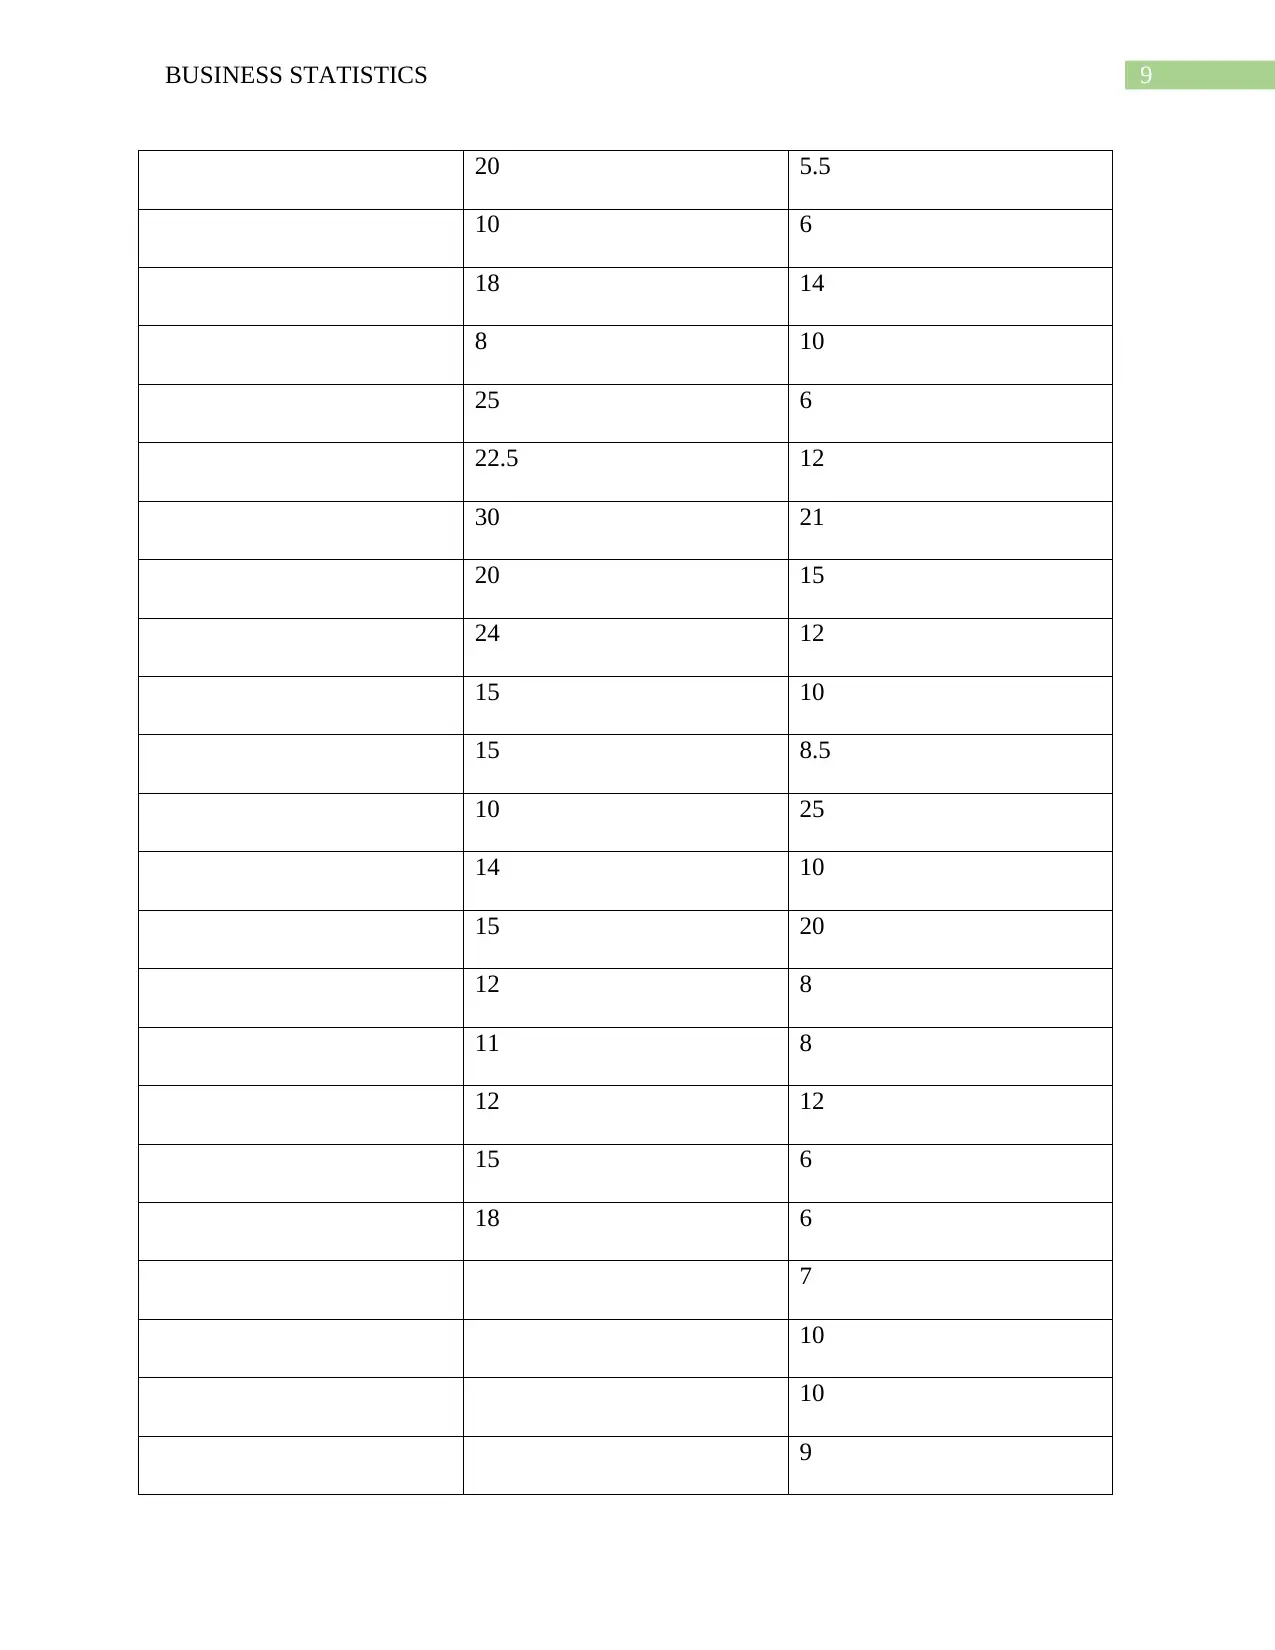
Response to Question 10.77.
The required calculations are shown in the following table
Measurements Gender (Female) Gender (Male)
18 10
Sample proportion p = 12/75 = 0.16
The calculated value of the test-statistic of this one-tail z-test =
0.16−0.10
√ (0.10)(1−0.10)
75
= 1.73.
The null hypothesis is rejected as 1.73> 1.64, where 1.64 is the critical z-value at 5% level of
significance.
c. The assumption behind the t-test is that the sample is drawn from normally distributed
population.
d. If the sample mean is $90 then the revised value of test statistic = (
90−100
34.55
√ 75
) = -2.51.
Clearly, -2.51< -1.64, the null hypothesis is rejected at 5% level of significance and the mean
reimbursement value will be less than $100.
e. For 15 office visits the modified value of proportion = 15/75 = 0.20.
The revised z-statistic value =
0.20−0.10
√ ( 0.10)( 1−0.10)
75
= 2.89.
At 5% significance level, the H0 will be rejected here as 2.89>1.64. Thus, there is enough
proof to have the population proportion more than 0.10.
Response to Question 10.77.
The required calculations are shown in the following table
Measurements Gender (Female) Gender (Male)
18 10
⊘ This is a preview!⊘
Do you want full access?
Subscribe today to unlock all pages.
Trusted by 1+ million students worldwide
9BUSINESS STATISTICS
20 5.5
10 6
18 14
8 10
25 6
22.5 12
30 21
20 15
24 12
15 10
15 8.5
10 25
14 10
15 20
12 8
11 8
12 12
15 6
18 6
7
10
10
9
20 5.5
10 6
18 14
8 10
25 6
22.5 12
30 21
20 15
24 12
15 10
15 8.5
10 25
14 10
15 20
12 8
11 8
12 12
15 6
18 6
7
10
10
9
Paraphrase This Document
Need a fresh take? Get an instant paraphrase of this document with our AI Paraphraser
10BUSINESS STATISTICS
10
30
10
10
5
5
10
11
15
15
7
8
12
10
Count 20 38
Mean 16.625 11.0263158
Standard Deviation (SD) 5.71442082 5.40638682
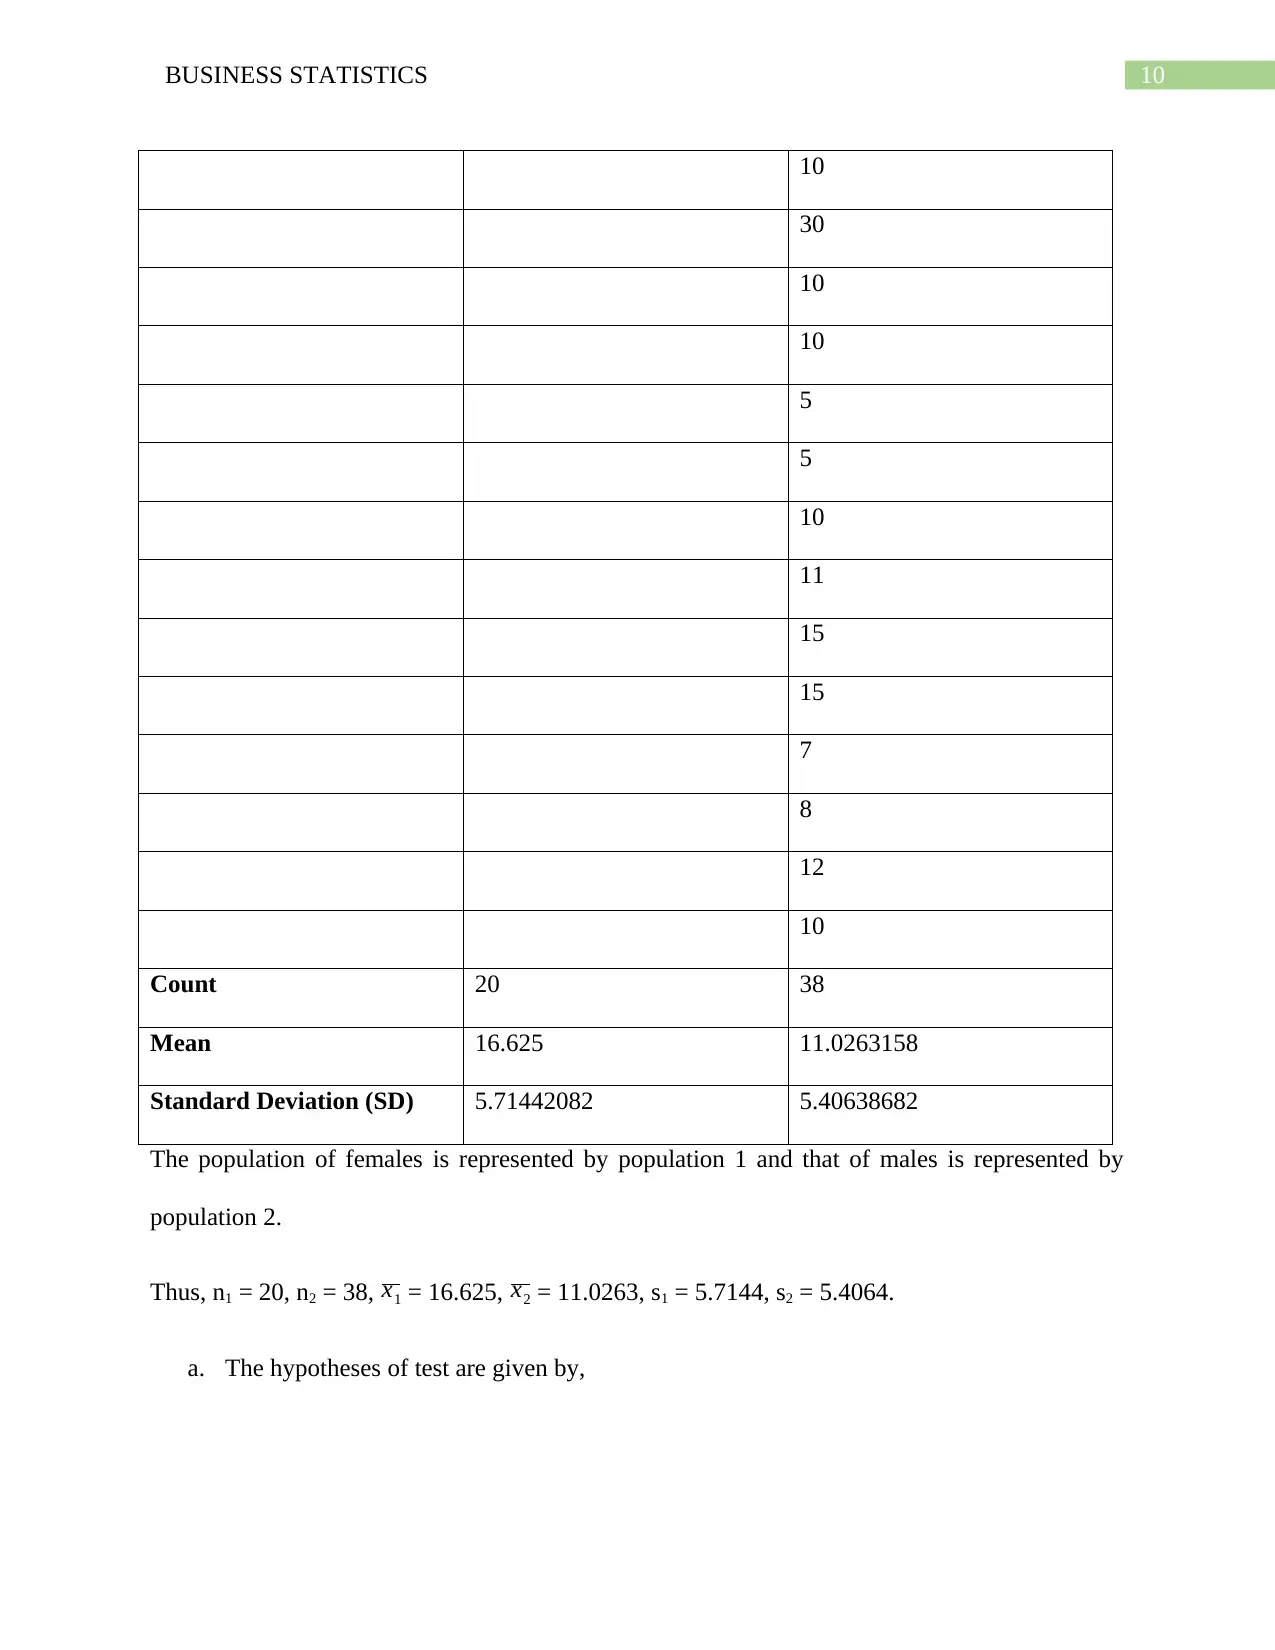
The population of females is represented by population 1 and that of males is represented by
population 2.
Thus, n1 = 20, n2 = 38, x1 = 16.625, x2 = 11.0263, s1 = 5.7144, s2 = 5.4064.
a. The hypotheses of test are given by,
10
30
10
10
5
5
10
11
15
15
7
8
12
10
Count 20 38
Mean 16.625 11.0263158
Standard Deviation (SD) 5.71442082 5.40638682
The population of females is represented by population 1 and that of males is represented by
population 2.
Thus, n1 = 20, n2 = 38, x1 = 16.625, x2 = 11.0263, s1 = 5.7144, s2 = 5.4064.
a. The hypotheses of test are given by,
11BUSINESS STATISTICS
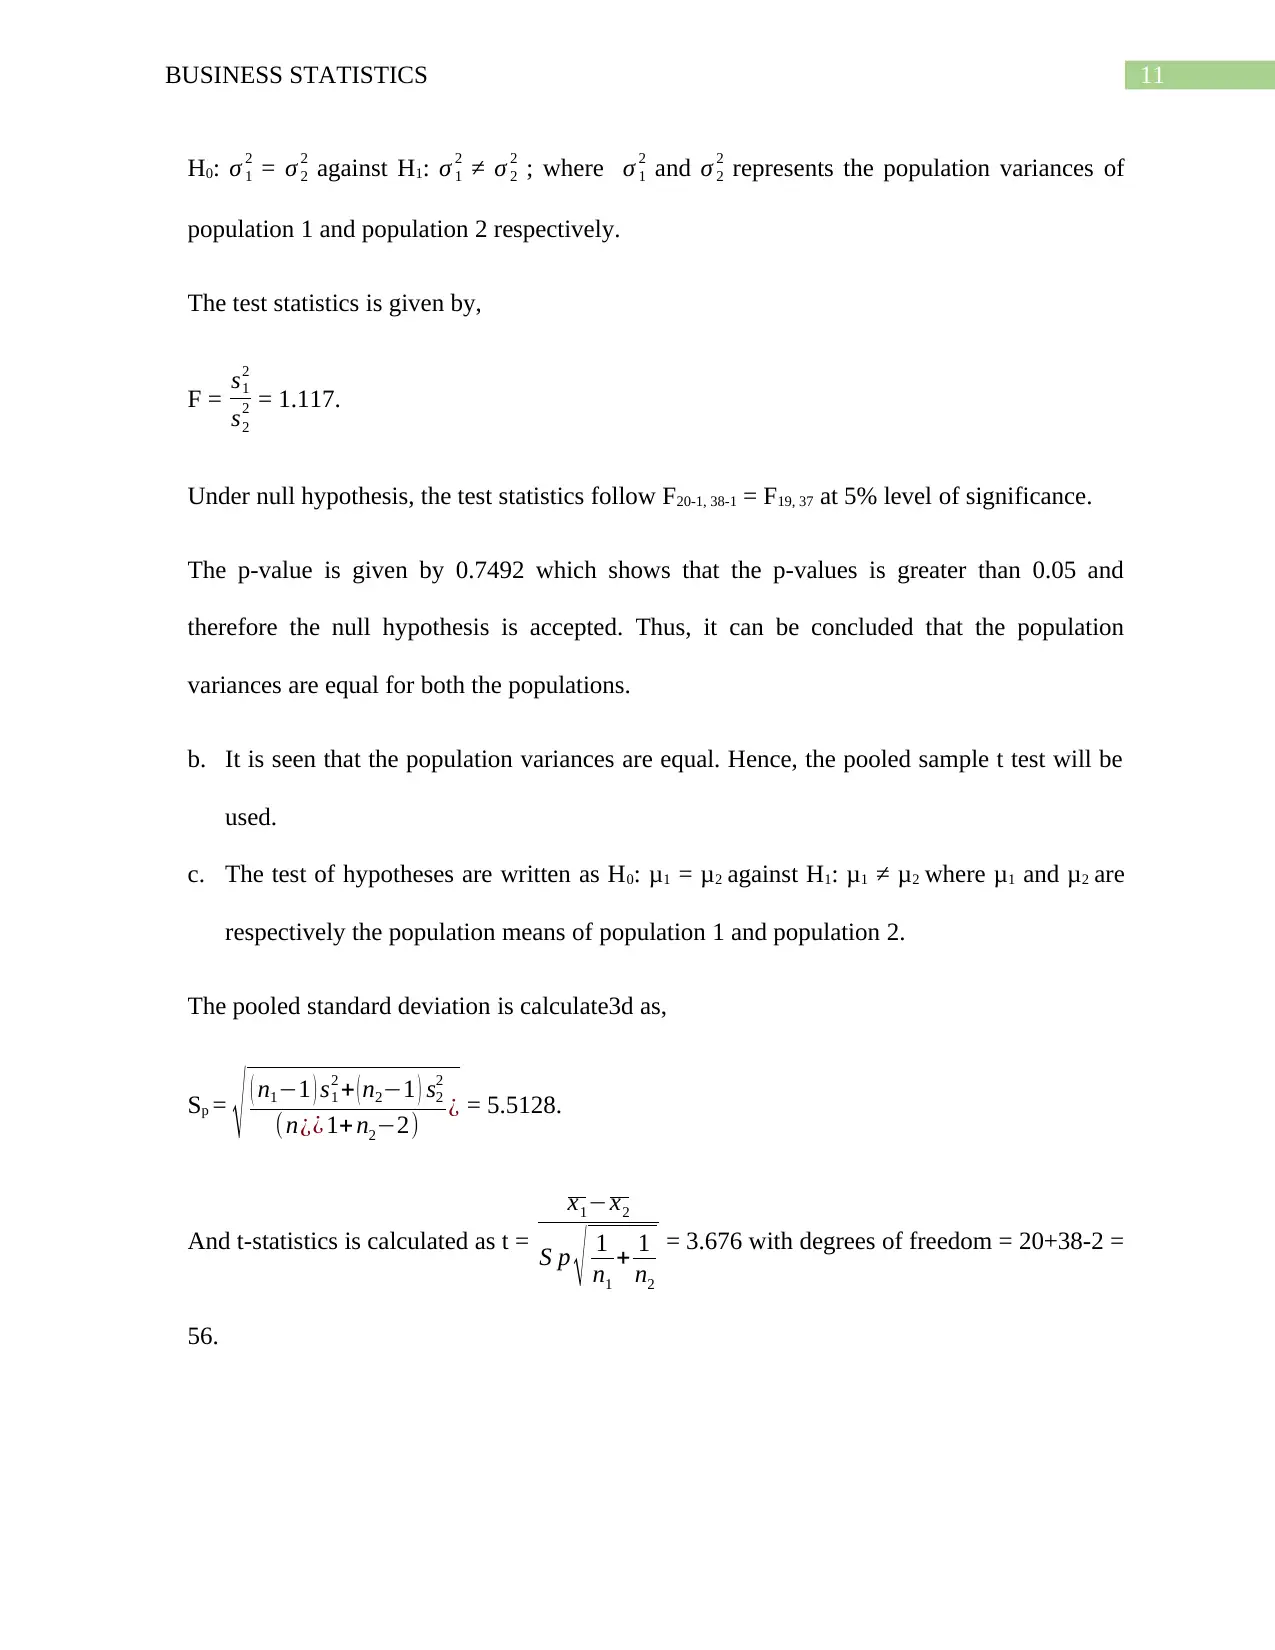
H0: σ 1
2 = σ 2
2 against H1: σ 1
2 ≠ σ 2
2 ; where σ 1
2 and σ 2
2 represents the population variances of
population 1 and population 2 respectively.
The test statistics is given by,
F = s1
2
s2
2 = 1.117.
Under null hypothesis, the test statistics follow F20-1, 38-1 = F19, 37 at 5% level of significance.
The p-value is given by 0.7492 which shows that the p-values is greater than 0.05 and
therefore the null hypothesis is accepted. Thus, it can be concluded that the population
variances are equal for both the populations.
b. It is seen that the population variances are equal. Hence, the pooled sample t test will be
used.
c. The test of hypotheses are written as H0: μ1 = μ2 against H1: μ1 ≠ μ2 where μ1 and μ2 are
respectively the population means of population 1 and population 2.
The pooled standard deviation is calculate3d as,
Sp =
√ ( n1−1 ) s1
2 + ( n2−1 ) s2
2
(n¿¿ 1+ n2−2) ¿ = 5.5128.
And t-statistics is calculated as t =
x1−x2
S p √ 1
n1
+ 1
n2
= 3.676 with degrees of freedom = 20+38-2 =
56.
⊘ This is a preview!⊘
Do you want full access?
Subscribe today to unlock all pages.
Trusted by 1+ million students worldwide
1 out of 34
Related Documents


Your All-in-One AI-Powered Toolkit for Academic Success.
+13062052269
info@desklib.com
Available 24*7 on WhatsApp / Email
![[object Object]](/_next/static/media/star-bottom.7253800d.svg)
Unlock your academic potential
Copyright © 2020–2026 A2Z Services. All Rights Reserved. Developed and managed by ZUCOL.