MAT301 Basic Statistics: Data Collection Project on Commute Time
VerifiedAdded on 2019/09/20
|5
|1015
|242
Homework Assignment
AI Summary
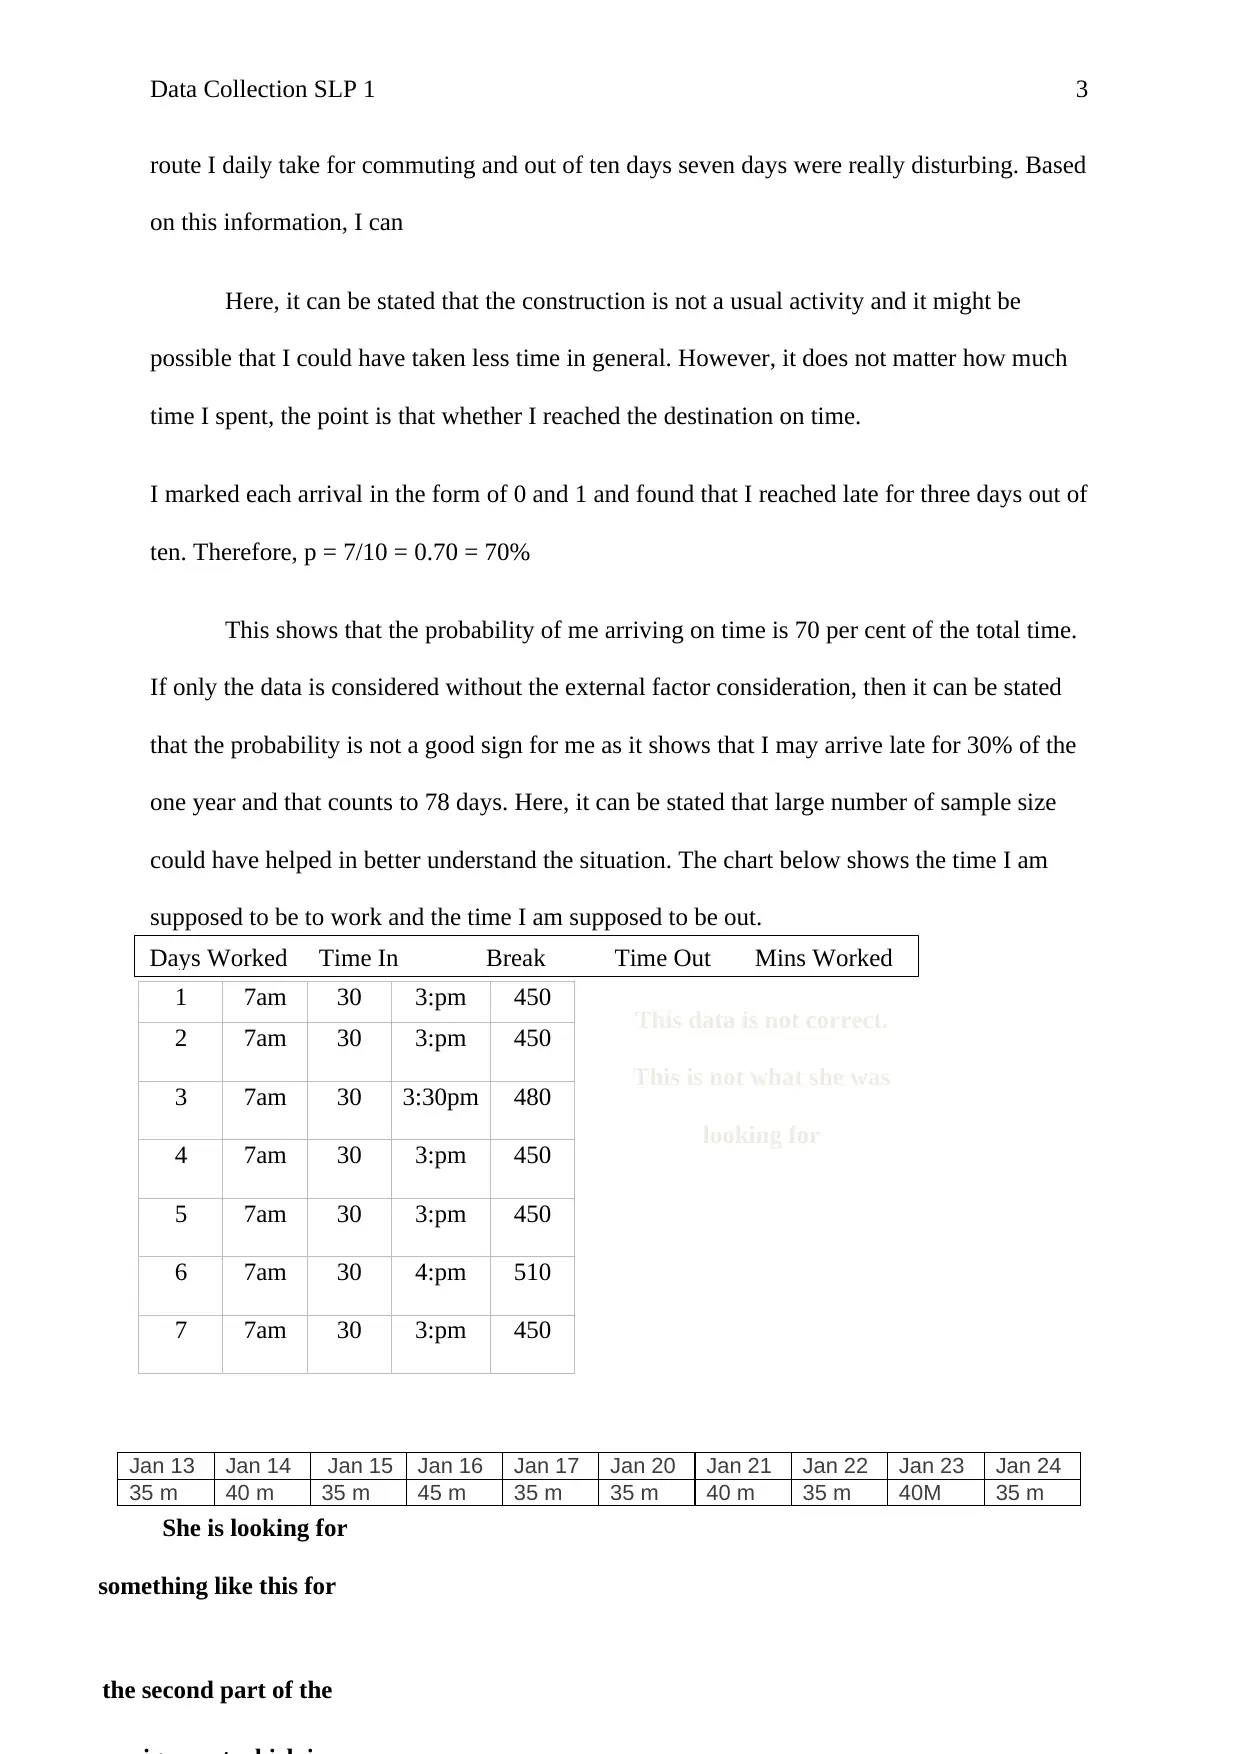
This assignment is a data collection project for a basic statistics course (MAT301) focusing on the time it takes the student to commute to work. The student identifies the dependent variable (commute time) and independent variables (traffic, construction, etc.) impacting this time. The student hypoth...
Read More
Contribute Materials
Your contribution can guide someone’s learning journey. Share your
documents today.

Data Collection SLP 1 1
Introduction to Probability
Alexander Douglas
MAT301 Basic Statistics
January 19, 2017
Prof. Jennifer Hom
Tutor Jane Austin worked on this assignment
Introduction to Probability
Alexander Douglas
MAT301 Basic Statistics
January 19, 2017
Prof. Jennifer Hom
Tutor Jane Austin worked on this assignment
Secure Best Marks with AI Grader
Need help grading? Try our AI Grader for instant feedback on your assignments.

Data Collection SLP 1 2
Data Collection Project
The activity that I have considered for the collection of the data for this assessment is
the time it takes me to arrive to my work every day. I decided to collect data on this topic
because I spend lot of time on the road going to and from work. There are two types of
variable that I am likely to encounter every day, namely, dependent variable and independent
variable. The dependent variable in my case is the time. I have considered the time as the
dependent variable as there are likely to be multiple factors that will impact my commuting
from my home to work. We know that dependent variable is something that we measure in
experiment and what is also affected during the time of the variable. Dependent variable
depends on the independent variable. A dependent variable cannot exist without an
independent variable. The time it will take me to arrive to work will depend on many factors.
The time I started counting on begins from the moment I leave my house and steps
into car. After that, whatever time I spend is to be counted as the time consumed in reaching
the destination. There are various independent factors that are impacting the amount of time I
spend when I commute such as the traffic, construction, someone known I met on the way,
and other things. Every day I am supposed to be to work at 7:30 am. Taken into account the
dependent and independent variables, I am sometimes late getting to work. We also know
that independent variable stands alone.
Prior to the collection of the data, I developed a hypothesis that the data collect would
form the bell curve. The reason behind that will be my early arrival on someday due to no
traffic and roadblocks at all, and someday I may arrive very late due to number of hurdles.
However, it was found that the data collected for the ten days has not formed the proper bell
curve. It shows right skewed. The reason was that I spent longer duration on road for seven
days from total ten days measured. The reason was that the construction was going on the

Data Collection SLP 1 3
route I daily take for commuting and out of ten days seven days were really disturbing. Based
on this information, I can
Here, it can be stated that the construction is not a usual activity and it might be
possible that I could have taken less time in general. However, it does not matter how much
time I spent, the point is that whether I reached the destination on time.
I marked each arrival in the form of 0 and 1 and found that I reached late for three days out of
ten. Therefore, p = 7/10 = 0.70 = 70%
This shows that the probability of me arriving on time is 70 per cent of the total time.
If only the data is considered without the external factor consideration, then it can be stated
that the probability is not a good sign for me as it shows that I may arrive late for 30% of the
one year and that counts to 78 days. Here, it can be stated that large number of sample size
could have helped in better understand the situation. The chart below shows the time I am
supposed to be to work and the time I am supposed to be out.
1 7am 30 3:pm 450
2 7am 30 3:pm 450
3 7am 30 3:30pm 480
4 7am 30 3:pm 450
5 7am 30 3:pm 450
6 7am 30 4:pm 510
7 7am 30 3:pm 450
Jan 13 Jan 14 Jan 15 Jan 16 Jan 17 Jan 20 Jan 21 Jan 22 Jan 23 Jan 24
35 m 40 m 35 m 45 m 35 m 35 m 40 m 35 m 40M 35 m
This data is not correct.
This is not what she was
looking for
Days Worked Time In Break Time Out Mins Worked
She is looking for
something like this for
the second part of the

Data Collection SLP 1 4
The table shows the number of days that I collected the data, the time in to work, my
launch break, my time out of work and the total number of minutes worked. It took me 10
days to collect the data. Every day counts for my day’s activities at work. I was able to
calculate the number of minutes worked by adding the total number of hours worked and
changing the hours into minutes. I took 8 hours of work and times it by sixty minutes and
subtracted my launch break to give me to total number of minutes worked. (Ex. 8hrs X
60minutes = 480 mins – 30mins = 450 mins.)
Secure Best Marks with AI Grader
Need help grading? Try our AI Grader for instant feedback on your assignments.

Data Collection SLP 1 5
References
http://onlinestatbook.com/2/probability/basic.html
Lane, D. M. (n.d.). Online Statistics Education: A multimedia course of study. Retrieved
from http://onlinestatbook.com/2/index.html
https://www.khanacademy.org/math/statistics-probability/probability-library
http://www.mathgoodies.com/lessons/vol6/dependent_events.html
1 out of 5

Your All-in-One AI-Powered Toolkit for Academic Success.
+13062052269
info@desklib.com
Available 24*7 on WhatsApp / Email
Unlock your academic potential
© 2024 | Zucol Services PVT LTD | All rights reserved.