MAT4MDS Assignment 2: Equations, Graphs, and Function Analysis

Verified

Added on  2023/01/19

|6
|787
|97
Homework Assignment
AI Summary
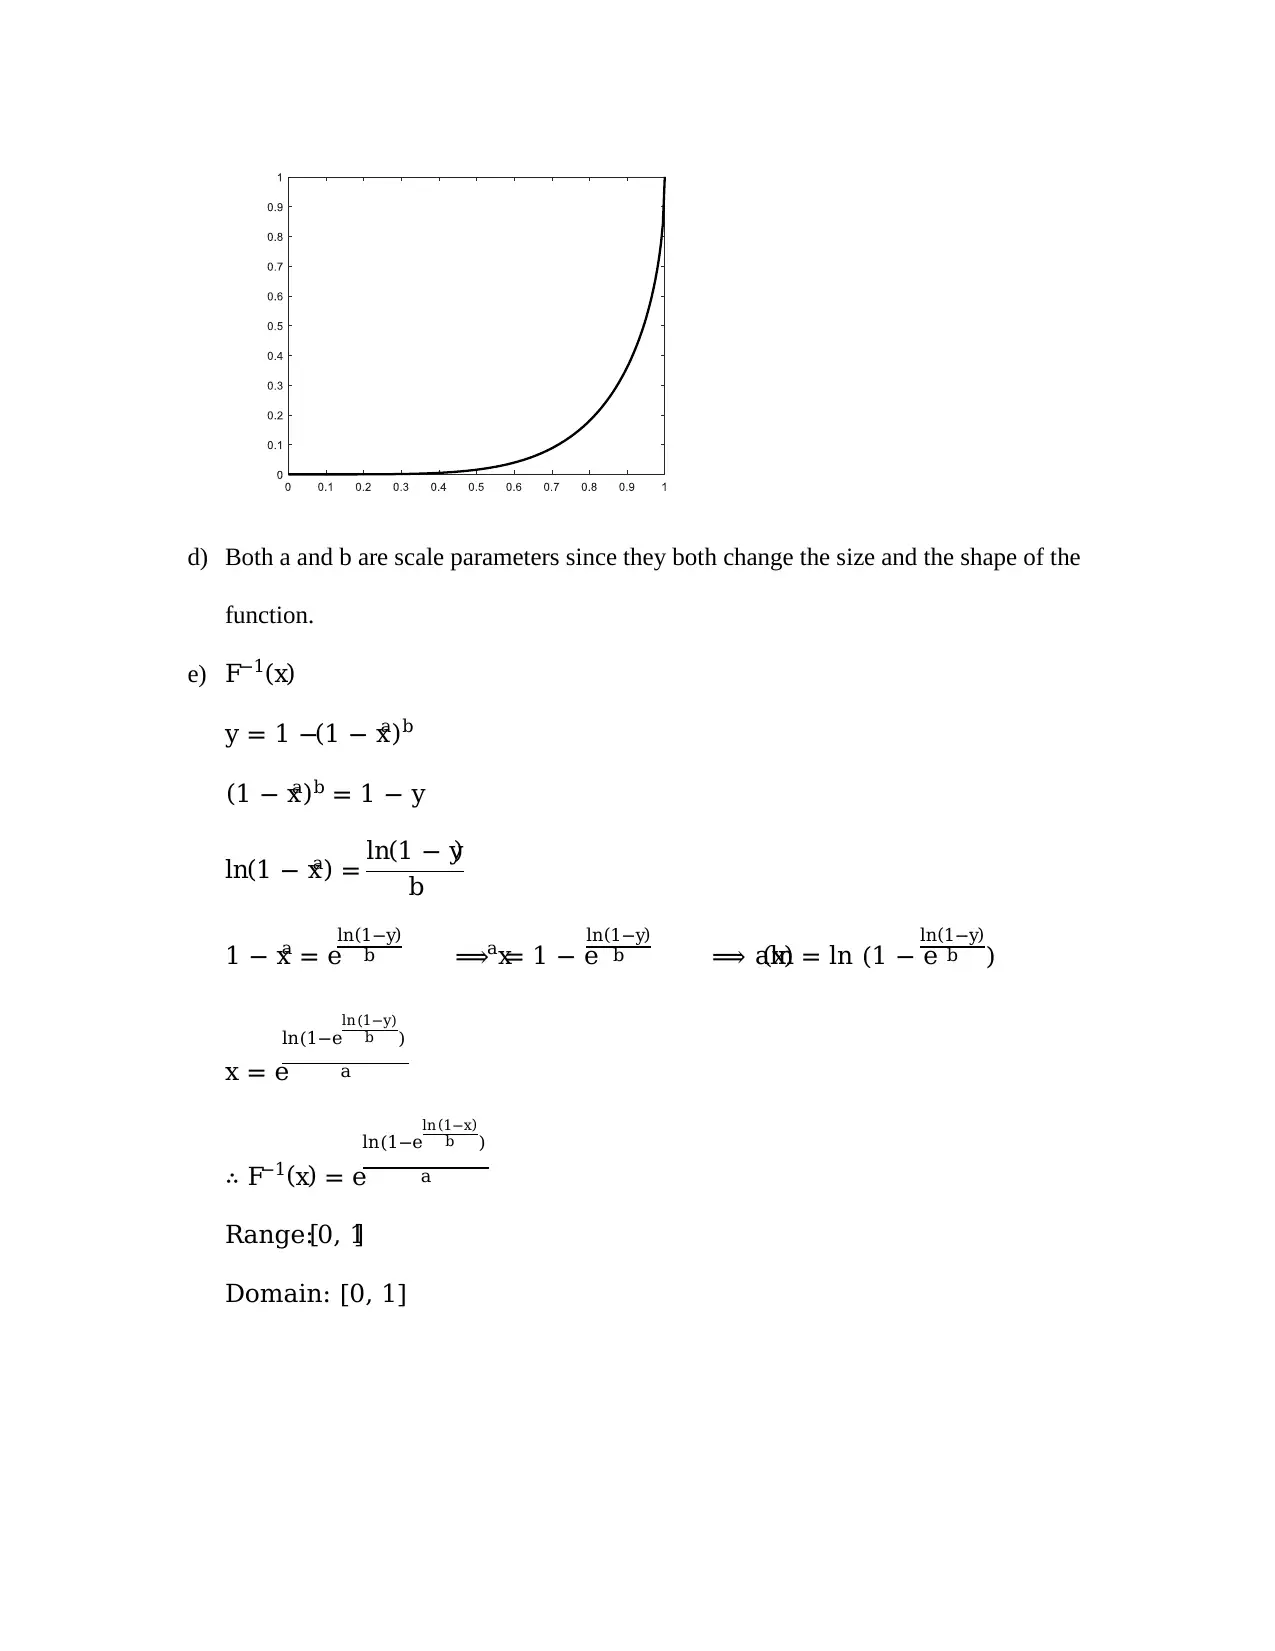
This document provides a comprehensive solution to MAT4MDS Assignment 2, encompassing various mathematical concepts. The assignment begins with solving several equations involving logarithmic and exponential functions, followed by mathematical proofs demonstrating fundamental logarithmic properties. The solution then proceeds to graph sketching of given equations on the same axes, and estimates the slope of a red line on a logarithmic graph, determining the relationship between the variables as exponential. The assignment concludes with a detailed analysis of a function F, including determining its range, breaking it down into component functions, and analyzing the effect of scale parameters. The solution also covers the sketching of the inverse function and determining its domain and range.
Document Page
Order Id 953574 MAT4MDS ASSIGNMENT 2, 2019
Question 1
a) Solving these equations for x
i) loge(loge(3x)) = 0 applying the log rule 0 = ln(e0) = ln(1)
loge(loge(3x)) = ln(1)
loge(3x) = 1
e1 = 3x ⟹ 𝐱 =
𝐞𝟏
𝟑
ii) ex25x+6 = 1
ln(ex25x+6) = ln(1)
x2 5x + 6 = 0solving the quadratic equation
(x − 3)(x − 2) = 0
∴ 𝐱 = 𝟑 , 𝐱 = 𝟐
iii) log3(x2 9) log3(x + 3) = 2 − log3(x + 1)
log3(x2 9) log3(x + 3) + log3(x + 1) = 2
log3 ( (x2 9)(x + 1)
(x + 3) ) = 2
32 = (x + 3)(x − 3)(x + 1)
(x + 3) (x − 3)(x + 1) = 9
x2 2x − 12 = 0
∴ 𝐱 = 𝟏 +𝟏𝟑 𝐎𝐫 𝐱 = 𝟏 +𝟏𝟑
𝐱 = 𝟒. 𝟔𝟎𝟓𝟓𝟓𝟏𝟐𝟕𝟓 𝐨𝐫 𝐱 = −𝟐. 𝟔𝟎𝟓𝟓𝟓𝟏𝟐𝟕𝟓in decimal format
iv) 9𝑥 2.3𝑥+1 = 7
tabler-icon-diamond-filled.svg

Paraphrase This Document

Need a fresh take? Get an instant paraphrase of this document with our AI Paraphraser
Document Page
Using trial and error method
𝒙 = 𝟏. 𝟏𝟕𝟎𝟖𝟑
b) Proof
i) loga(b) logb(a) = 1
logb(a) = 1
loga b
1 = 1
loga b × 1
logb a × (loga(b) logb(a))
1 = ( 1
loga b × loga(b)) × ( 1
logb a × logb(a))
1 = 1 × 1 = 1
ii) log1
b
(x) = − logb(x)
logb1(x) = − logb(x) use of change of base rule
ln(x)
ln(b1) = − ln(x)
ln(b)
ln(x)
ln(b) = − ln(x)
ln(b)
ln(x)
ln(b) = − ln(x)
ln(b)
c) Graphing the following equations on the same axis, c=8
𝑦 = 𝑥, (1
5)
𝑥
, (1
8)
𝑥
Document Page
d) Estimating the slope of the red line
The graph is logarithmic on y-axis
s = y
x= W
n at(1,1) and (2,10)
Where W total number of websites, and n the number of year
s= W
n = 1
2−1 = 1 ∆W = 1for one log cycle
s = 1
yintercept = −10
Thus, y = −10(10)x
The relationship between W and n is Exponential relationship
Question 2
F:[0, 1} → ℝ F(x) = 1 −(1 − xa)b
Document Page
a) The range for F is [0, 1]
b) F(x) = 1 −(1 − xa)b
f = 1 − xa g = xb
c) a = 5, b ==
1
8
𝑔°𝑓(𝑥) = (1 − 𝑥𝑎)1
8
Reflecting on x-axis
Shifting vertically up by +1
tabler-icon-diamond-filled.svg

Paraphrase This Document

Need a fresh take? Get an instant paraphrase of this document with our AI Paraphraser
Document Page
d) Both a and b are scale parameters since they both change the size and the shape of the
function.
e) F1(x)
y = 1 −(1 − xa)b
(1 − xa)b = 1 − y
ln(1 − xa) = ln(1 − y)
b
1 − xa = eln(1−y)
b xa = 1 − e
ln(1−y)
b aln(x) = ln (1 − e
ln(1−y)
b )
x = e
ln(1−e
ln(1−y)
b )
a
F1(x) = e
ln(1−e
ln(1−x)
b )
a
Range:[0, 1]
Domain: [0, 1]
Document Page
chevron_up_icon
1 out of 6
circle_padding
hide_on_mobile
zoom_out_icon
[object Object]