Material Structures: Column Buckling Laboratory Worksheet Analysis
VerifiedAdded on 2022/11/04
|9
|1924
|377
Practical Assignment
AI Summary
This assignment is a comprehensive laboratory report on column buckling, focusing on the analysis of aircraft stringer sections of varied lengths. The report begins with a theoretical background, including Euler buckling theory, critical stress, and slenderness ratio calculations. It then details the aim of the experiment, which is to investigate the strength and failure of the columns, comparing experimental findings with theoretical predictions. The theoretical predictions section includes calculations for second moment of area, centroid coordinates, and buckling loads for three columns of different lengths (15", 8", and 1.5"). Experimental results are presented in the form of load-displacement graphs and tables summarizing buckling test results. The report also includes a discussion section comparing theoretical and experimental results, addressing column classification, thin-wall assumptions, and potential sources of error. The assignment concludes with a bibliography and appendices containing detailed calculations.
Material Structures
Column Buckling Laboratory: Worksheet
Student no.
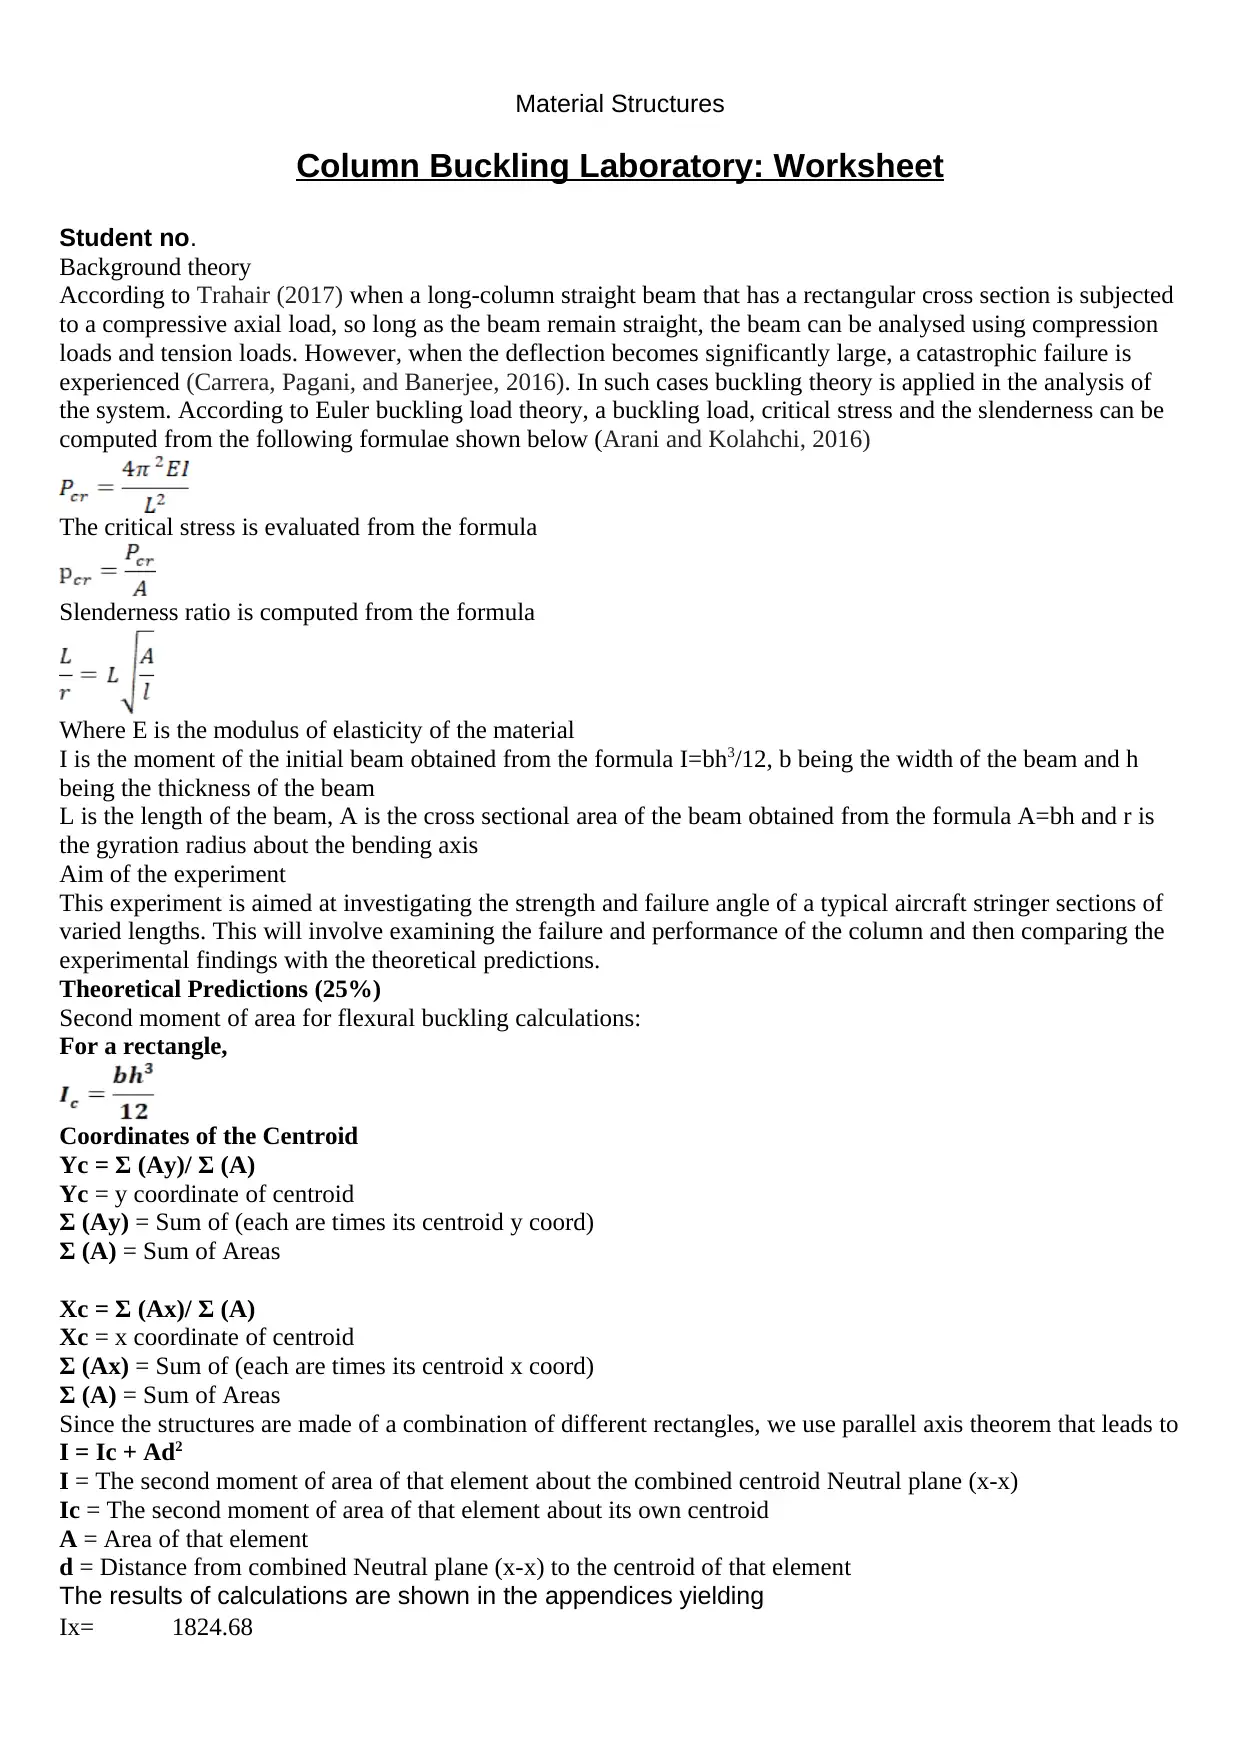
Background theory
According to Trahair (2017) when a long-column straight beam that has a rectangular cross section is subjected
to a compressive axial load, so long as the beam remain straight, the beam can be analysed using compression
loads and tension loads. However, when the deflection becomes significantly large, a catastrophic failure is
experienced (Carrera, Pagani, and Banerjee, 2016). In such cases buckling theory is applied in the analysis of
the system. According to Euler buckling load theory, a buckling load, critical stress and the slenderness can be
computed from the following formulae shown below (Arani and Kolahchi, 2016)
The critical stress is evaluated from the formula
Slenderness ratio is computed from the formula
Where E is the modulus of elasticity of the material
I is the moment of the initial beam obtained from the formula I=bh3/12, b being the width of the beam and h
being the thickness of the beam
L is the length of the beam, A is the cross sectional area of the beam obtained from the formula A=bh and r is
the gyration radius about the bending axis
Aim of the experiment
This experiment is aimed at investigating the strength and failure angle of a typical aircraft stringer sections of
varied lengths. This will involve examining the failure and performance of the column and then comparing the
experimental findings with the theoretical predictions.
Theoretical Predictions (25%)
Second moment of area for flexural buckling calculations:
For a rectangle,
Coordinates of the Centroid
Yc = Σ (Ay)/ Σ (A)
Yc = y coordinate of centroid
Σ (Ay) = Sum of (each are times its centroid y coord)
Σ (A) = Sum of Areas
Xc = Σ (Ax)/ Σ (A)
Xc = x coordinate of centroid
Σ (Ax) = Sum of (each are times its centroid x coord)
Σ (A) = Sum of Areas
Since the structures are made of a combination of different rectangles, we use parallel axis theorem that leads to
I = Ic + Ad2
I = The second moment of area of that element about the combined centroid Neutral plane (x-x)
Ic = The second moment of area of that element about its own centroid
A = Area of that element
d = Distance from combined Neutral plane (x-x) to the centroid of that element
The results of calculations are shown in the appendices yielding
Ix= 1824.68
Column Buckling Laboratory: Worksheet
Student no.
Background theory
According to Trahair (2017) when a long-column straight beam that has a rectangular cross section is subjected
to a compressive axial load, so long as the beam remain straight, the beam can be analysed using compression
loads and tension loads. However, when the deflection becomes significantly large, a catastrophic failure is
experienced (Carrera, Pagani, and Banerjee, 2016). In such cases buckling theory is applied in the analysis of
the system. According to Euler buckling load theory, a buckling load, critical stress and the slenderness can be
computed from the following formulae shown below (Arani and Kolahchi, 2016)
The critical stress is evaluated from the formula
Slenderness ratio is computed from the formula
Where E is the modulus of elasticity of the material
I is the moment of the initial beam obtained from the formula I=bh3/12, b being the width of the beam and h
being the thickness of the beam
L is the length of the beam, A is the cross sectional area of the beam obtained from the formula A=bh and r is
the gyration radius about the bending axis
Aim of the experiment
This experiment is aimed at investigating the strength and failure angle of a typical aircraft stringer sections of
varied lengths. This will involve examining the failure and performance of the column and then comparing the
experimental findings with the theoretical predictions.
Theoretical Predictions (25%)
Second moment of area for flexural buckling calculations:
For a rectangle,
Coordinates of the Centroid
Yc = Σ (Ay)/ Σ (A)
Yc = y coordinate of centroid
Σ (Ay) = Sum of (each are times its centroid y coord)
Σ (A) = Sum of Areas
Xc = Σ (Ax)/ Σ (A)
Xc = x coordinate of centroid
Σ (Ax) = Sum of (each are times its centroid x coord)
Σ (A) = Sum of Areas
Since the structures are made of a combination of different rectangles, we use parallel axis theorem that leads to
I = Ic + Ad2
I = The second moment of area of that element about the combined centroid Neutral plane (x-x)
Ic = The second moment of area of that element about its own centroid
A = Area of that element
d = Distance from combined Neutral plane (x-x) to the centroid of that element
The results of calculations are shown in the appendices yielding
Ix= 1824.68
Paraphrase This Document
Need a fresh take? Get an instant paraphrase of this document with our AI Paraphraser
Iy= 1226.136
Ixy= 357.1161
Ix= 1683.977
Iy= 1181.239
Ixy= 180.8776
Ix= 1528.956
Iy= 1104.298
Ixy= 47.07887
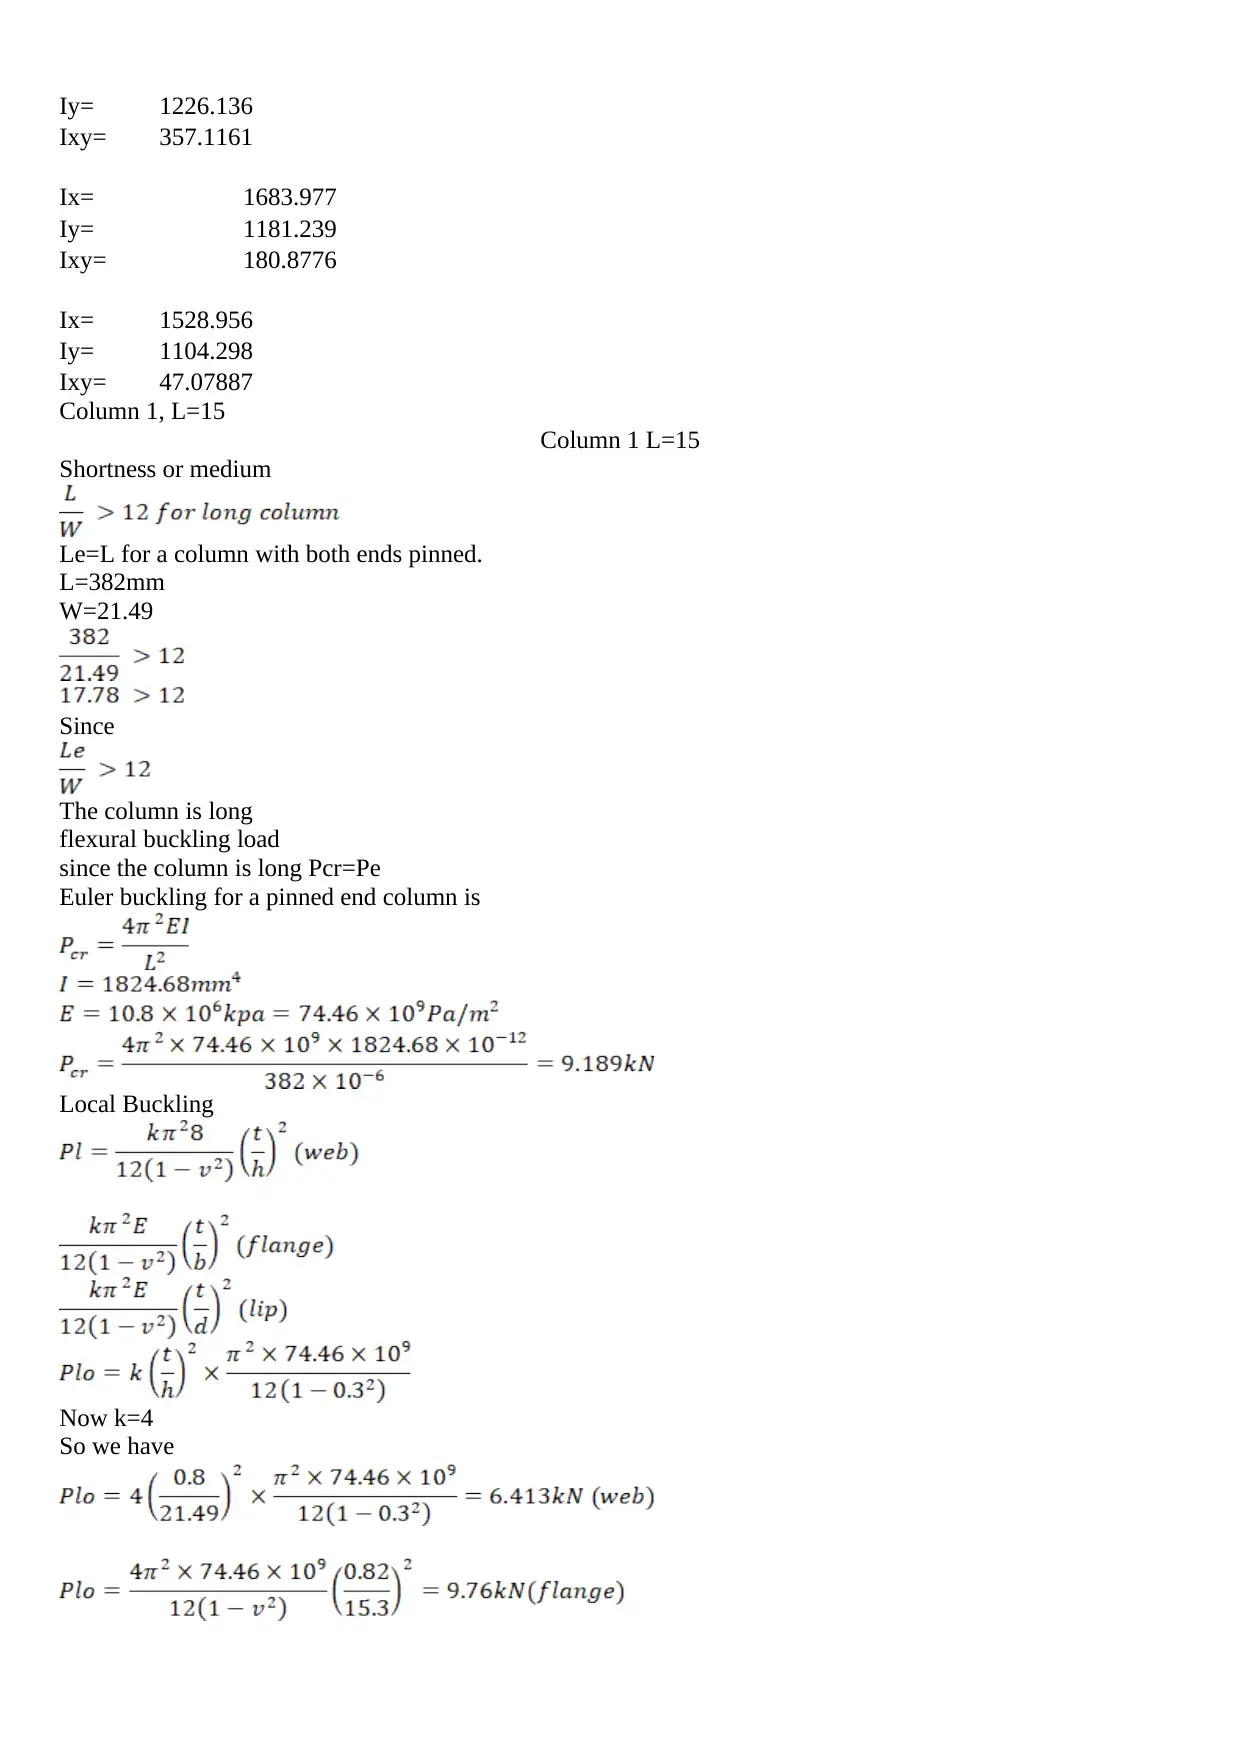
Column 1, L=15
Column 1 L=15
Shortness or medium
Le=L for a column with both ends pinned.
L=382mm
W=21.49
Since
The column is long
flexural buckling load
since the column is long Pcr=Pe
Euler buckling for a pinned end column is
Local Buckling
Now k=4
So we have
Ixy= 357.1161
Ix= 1683.977
Iy= 1181.239
Ixy= 180.8776
Ix= 1528.956
Iy= 1104.298
Ixy= 47.07887
Column 1, L=15
Column 1 L=15
Shortness or medium
Le=L for a column with both ends pinned.
L=382mm
W=21.49
Since
The column is long
flexural buckling load
since the column is long Pcr=Pe
Euler buckling for a pinned end column is
Local Buckling
Now k=4
So we have
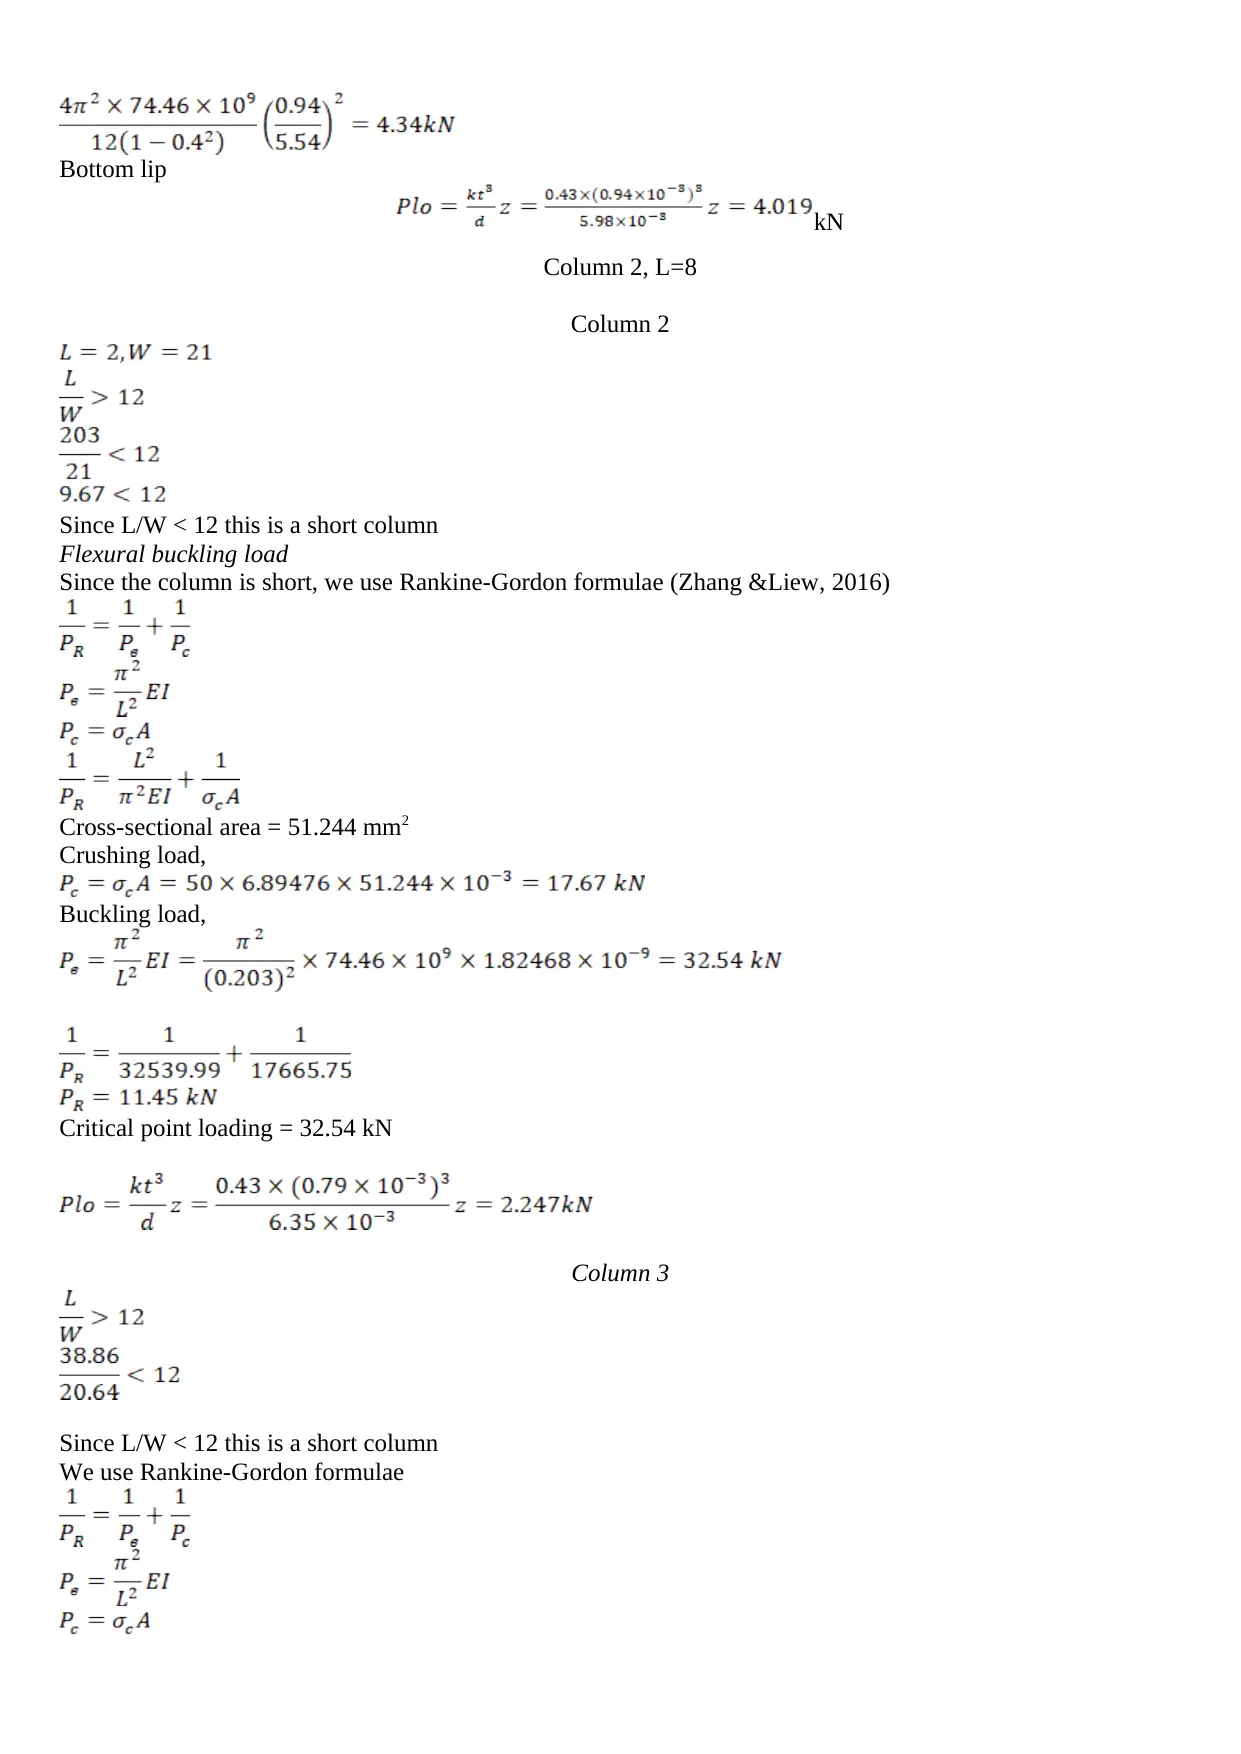
Bottom lip
kN
Column 2, L=8
Column 2
Since L/W < 12 this is a short column
Flexural buckling load
Since the column is short, we use Rankine-Gordon formulae (Zhang &Liew, 2016)
Cross-sectional area = 51.244 mm2
Crushing load,
Buckling load,
Critical point loading = 32.54 kN
Column 3
Since L/W < 12 this is a short column
We use Rankine-Gordon formulae
⊘ This is a preview!⊘
Do you want full access?
Subscribe today to unlock all pages.
Trusted by 1+ million students worldwide
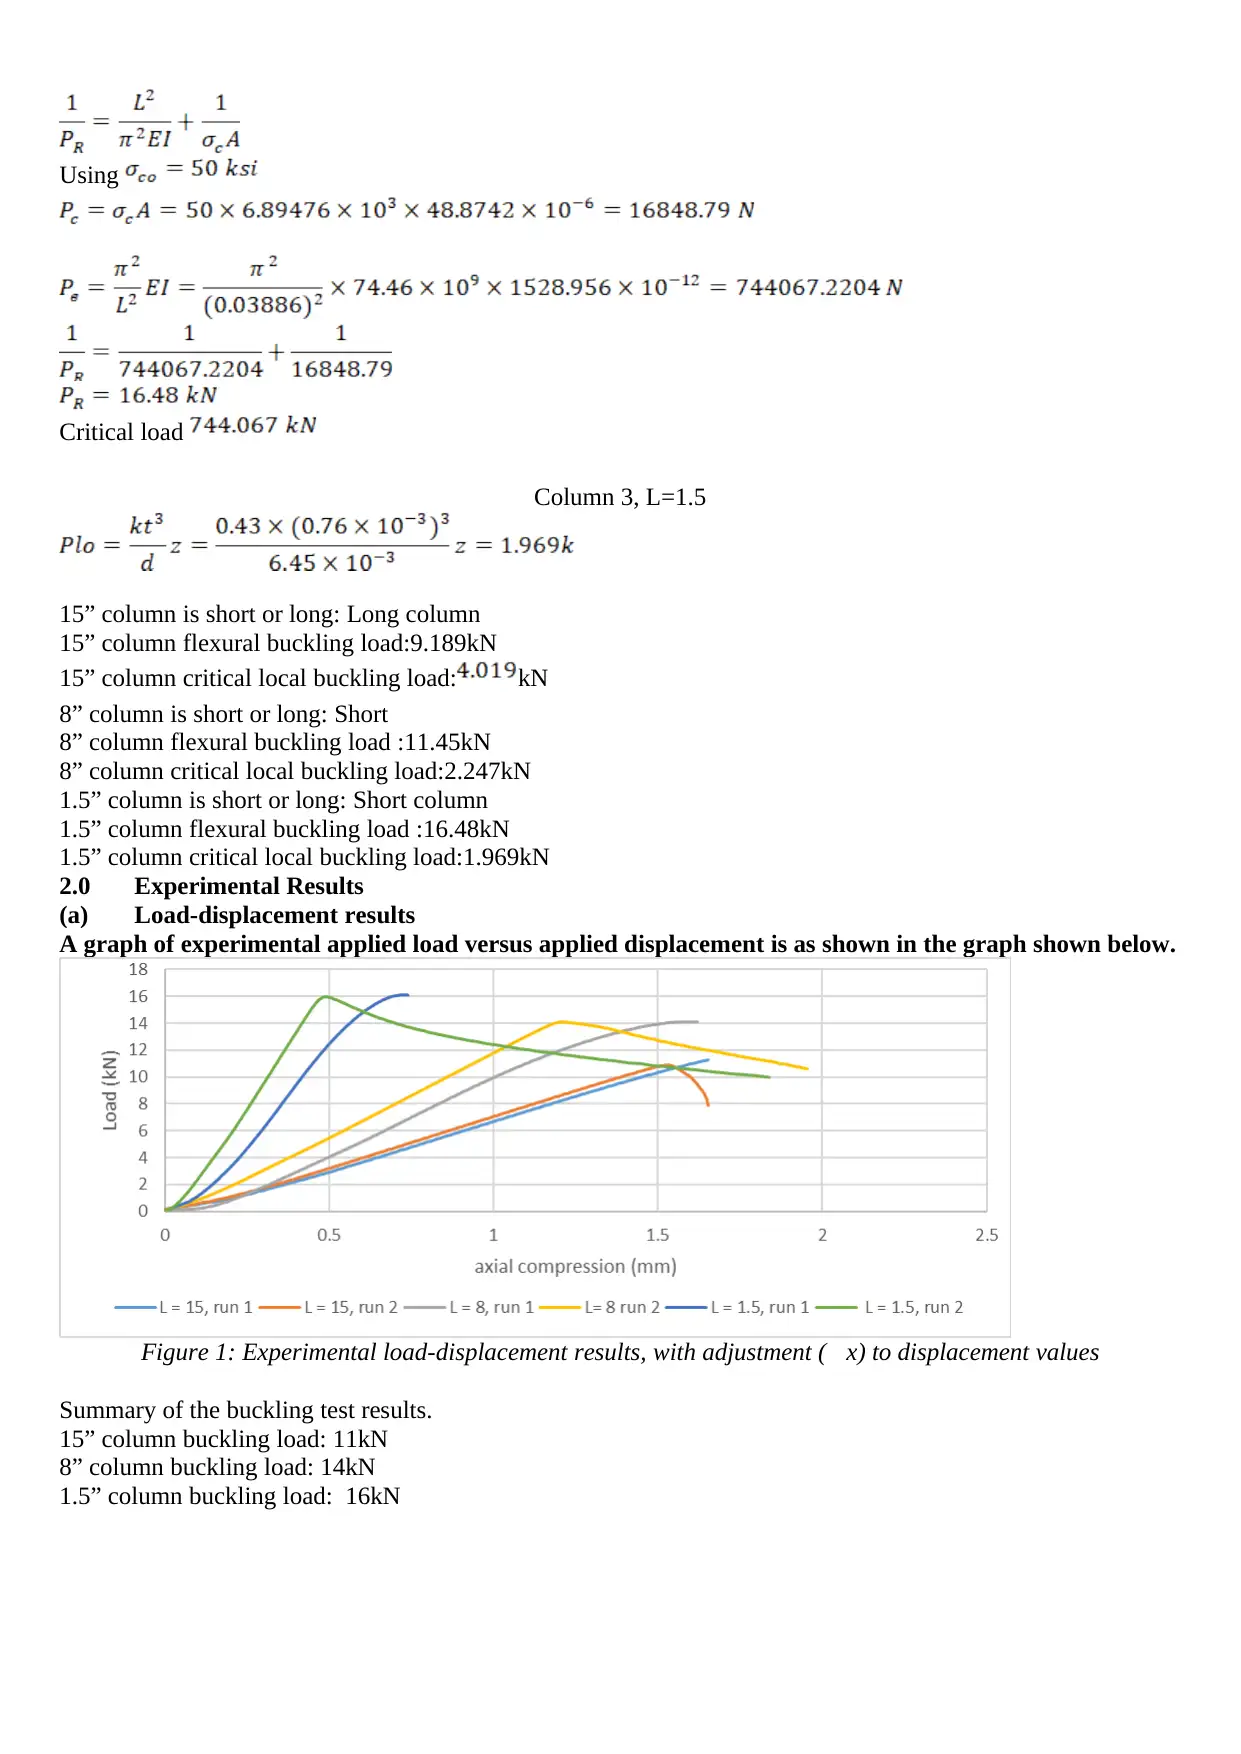
Using
Critical load
Column 3, L=1.5
15” column is short or long: Long column
15” column flexural buckling load:9.189kN
15” column critical local buckling load: kN
8” column is short or long: Short
8” column flexural buckling load :11.45kN
8” column critical local buckling load:2.247kN
1.5” column is short or long: Short column
1.5” column flexural buckling load :16.48kN
1.5” column critical local buckling load:1.969kN
2.0 Experimental Results
(a) Load-displacement results
A graph of experimental applied load versus applied displacement is as shown in the graph shown below.
Figure 1: Experimental load-displacement results, with adjustment (x) to displacement values
Summary of the buckling test results.
15” column buckling load: 11kN
8” column buckling load: 14kN
1.5” column buckling load: 16kN
Paraphrase This Document
Need a fresh take? Get an instant paraphrase of this document with our AI Paraphraser
For the 15” column, was the critical buckling mode flexural or local? (observed in the experiment)
For the 15” column, how many buckling half-waves were in the critical buckling mode? (observed in the
experiment)
Provide a sketch illustrating the buckling mode as described above (from the experimental observations)
Description of the behaviour of the 1.5” column:
1.5 column had the largest bulking load. A graph of load against the compression length was fairly linear at the
beginning of a graph of load against compression length. As the load increased, the graph gradually lost its
linear property as shown in the graph. After given load (about 15kN) the graph fairly remained constant before
exhibiting an inverse relationship between length and the load as depicted in the attached graph. Relative to the
other two columns it is seen that 1.5mm column being the column with the least length has the highest bulking
force. This finding is in line with the findings () who proved an inverse relationship between bulking load and
the length of the column.
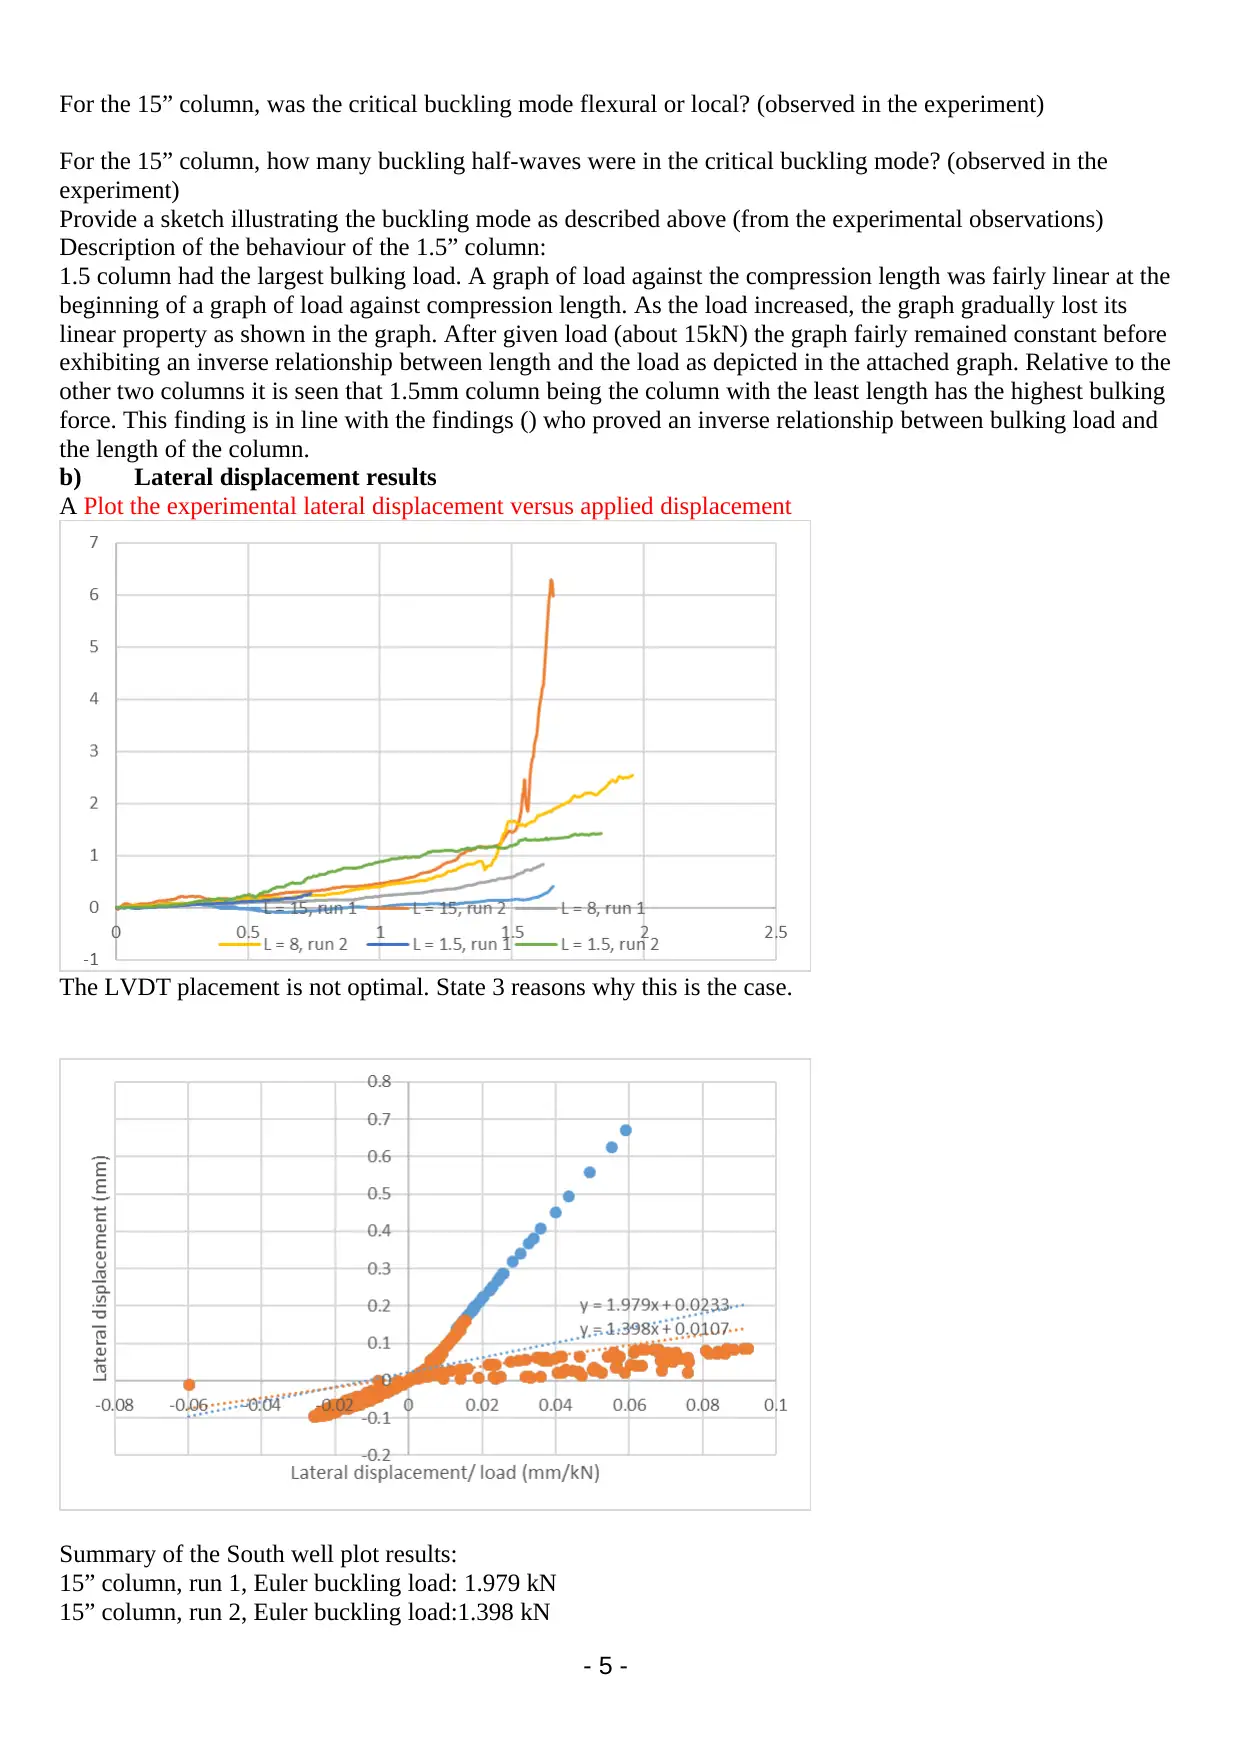
b) Lateral displacement results
A Plot the experimental lateral displacement versus applied displacement
The LVDT placement is not optimal. State 3 reasons why this is the case.
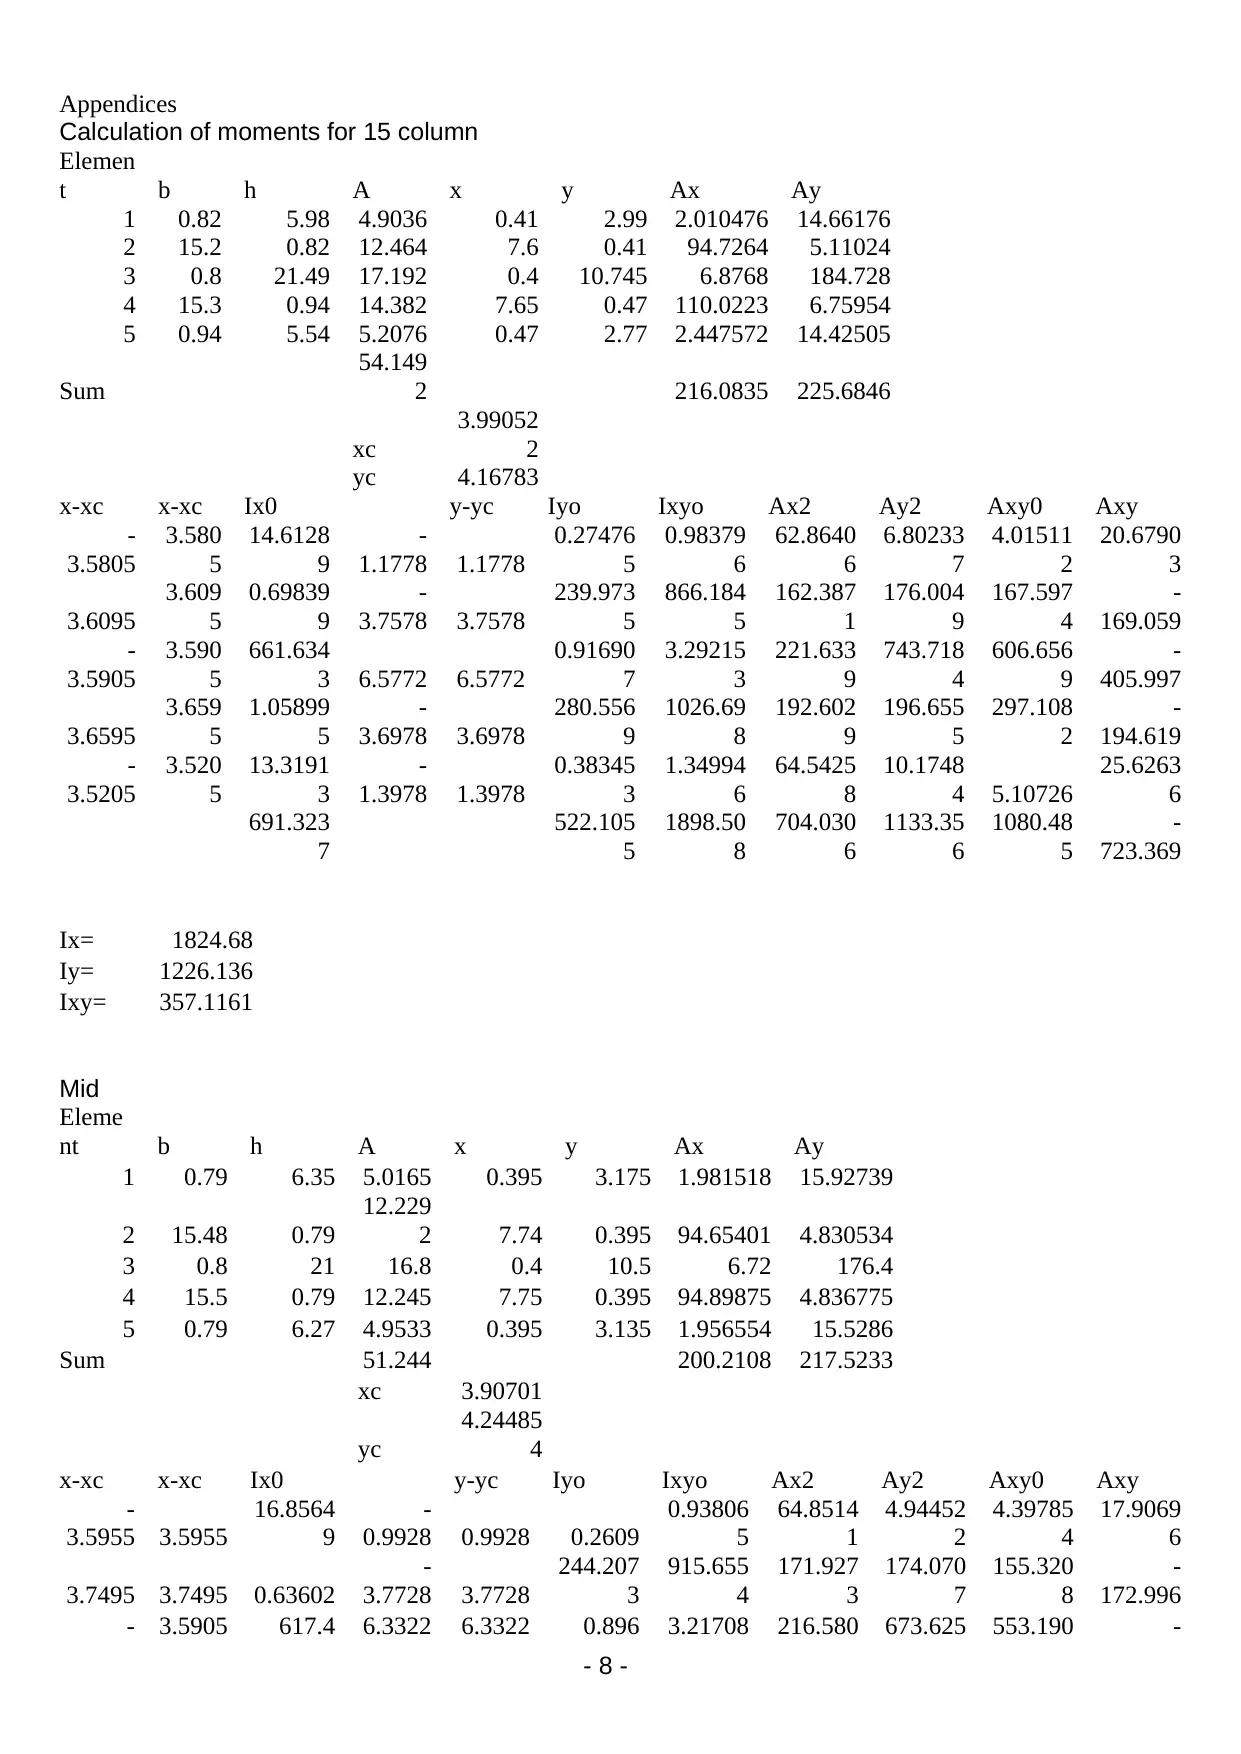
Summary of the South well plot results:
15” column, run 1, Euler buckling load: 1.979 kN
15” column, run 2, Euler buckling load:1.398 kN
- 5 -
For the 15” column, how many buckling half-waves were in the critical buckling mode? (observed in the
experiment)
Provide a sketch illustrating the buckling mode as described above (from the experimental observations)
Description of the behaviour of the 1.5” column:
1.5 column had the largest bulking load. A graph of load against the compression length was fairly linear at the
beginning of a graph of load against compression length. As the load increased, the graph gradually lost its
linear property as shown in the graph. After given load (about 15kN) the graph fairly remained constant before
exhibiting an inverse relationship between length and the load as depicted in the attached graph. Relative to the
other two columns it is seen that 1.5mm column being the column with the least length has the highest bulking
force. This finding is in line with the findings () who proved an inverse relationship between bulking load and
the length of the column.
b) Lateral displacement results
A Plot the experimental lateral displacement versus applied displacement
The LVDT placement is not optimal. State 3 reasons why this is the case.
Summary of the South well plot results:
15” column, run 1, Euler buckling load: 1.979 kN
15” column, run 2, Euler buckling load:1.398 kN
- 5 -

Comments from the south well results and what they communicate
The gradient of south well graph provides Euler buckling load which compares significantly with the obtained
values of local buckling load.
3.0 Discussion (25%)
How do the theoretical predictions and experimental results compare in terms of buckling load, critical buckling
mode and column classification for each column? (include a table in your response) (10%)
Column 1 (long) Column 2 (medium) Column 3 (short)
Theoretical 9.189kN 11.48kN 16.48kN
Experimental 11kN 14kN 16kN
Description The bucking load can be
predicted using the Euler
critical load formulae
For medium length
column the Euler
buckling load formula if
further from the
experimental result by a
factor of 10 tens.
The Euler buckling load
formula is
The obtained results compare significantly as the theoretical values are almost similar to the experimental
values as shown in the table.
Should the effective length ratio L’/L be the same for each column? Why/why not? (3%)
Yes. Because all the columns are assumed to be pinned at both ends. The ratio L’/L should be equivalent for
each column because this effective length ratio provides the means of classifying columns and their
corresponding failure modes.
How are thin-wall assumptions applied in calculating the buckling load? (3%)
It is assumed that the shear deformation is very small and therefore it can be neglected in calculating buckling
load. In addition, the plane sections are assumed to remain plane. In this case, displacements are small and
calculations can be performed from the original geometry of the structure.
Describe 3 aspects that cause the column to deflect laterally before buckling. (3%)
Compression: Lateral deflection may result from the applied vertical load which results in the compression of
the flanges of a section. The compression flange is forced to deflect laterally away from the original position
Torsion: forces on the flange can lead to the twisting of a section about its longitudinal axis resulting in lateral
movement of the section as well.
Tension: this acts in the same way as the deflection compression except that the lateral deflection is in the
opposite direction
Why does the load-displacement data have an initially non-linear region? (3%)
The column is assumed to be ideal such that it is perfectly straight and made of homogenous material that are
free from stress. At the initial stage, an application of force will cause the column to “jump” to a new
configuration because of the extremely thin columns. This explains why the initial stages of the load-
displacement columns are non-linear as shown in the graph.
Describe 3 sources of human error in the experimental results. (3%)
Observational errors such as parallax error would have led to erroneous results. Parallax is a type of systematic
error.
Another source of error arises from the inability to read measurements that fall between the scale markings.
This is a type of a random error affected limited by the precision of the measuring instrument.
The other possible source of human error is due to transposition in which a particular value is read from the
measuring instrument but another value is entered into the recording table.
Bibliography
- 6 -
⊘ This is a preview!⊘
Do you want full access?
Subscribe today to unlock all pages.
Trusted by 1+ million students worldwide

Arani, A.J. and Kolahchi, R., 2016. Buckling analysis of embedded concrete columns armed with carbon
nanotubes. Comput Concr, 17(5), pp.567-578.
Carrera, E., Pagani, A. and Banerjee, J.R., 2016. Linearized buckling analysis of isotropic and composite beam-
columns by Carrera Unified Formulation and dynamic stiffness method. Mechanics of Advanced Materials and
Structures, 23(9), pp.1092-1103.
Trahair, N.S., 2017. Flexural-torsional buckling of structures. Routledge.
Zhang, L. W., & Liew, K. M. (2016). Element-free geometrically nonlinear analysis of quadrilateral
functionally graded material plates with internal column supports. Composite Structures, 147, 99-110.
- 7 -
Paraphrase This Document
Need a fresh take? Get an instant paraphrase of this document with our AI Paraphraser
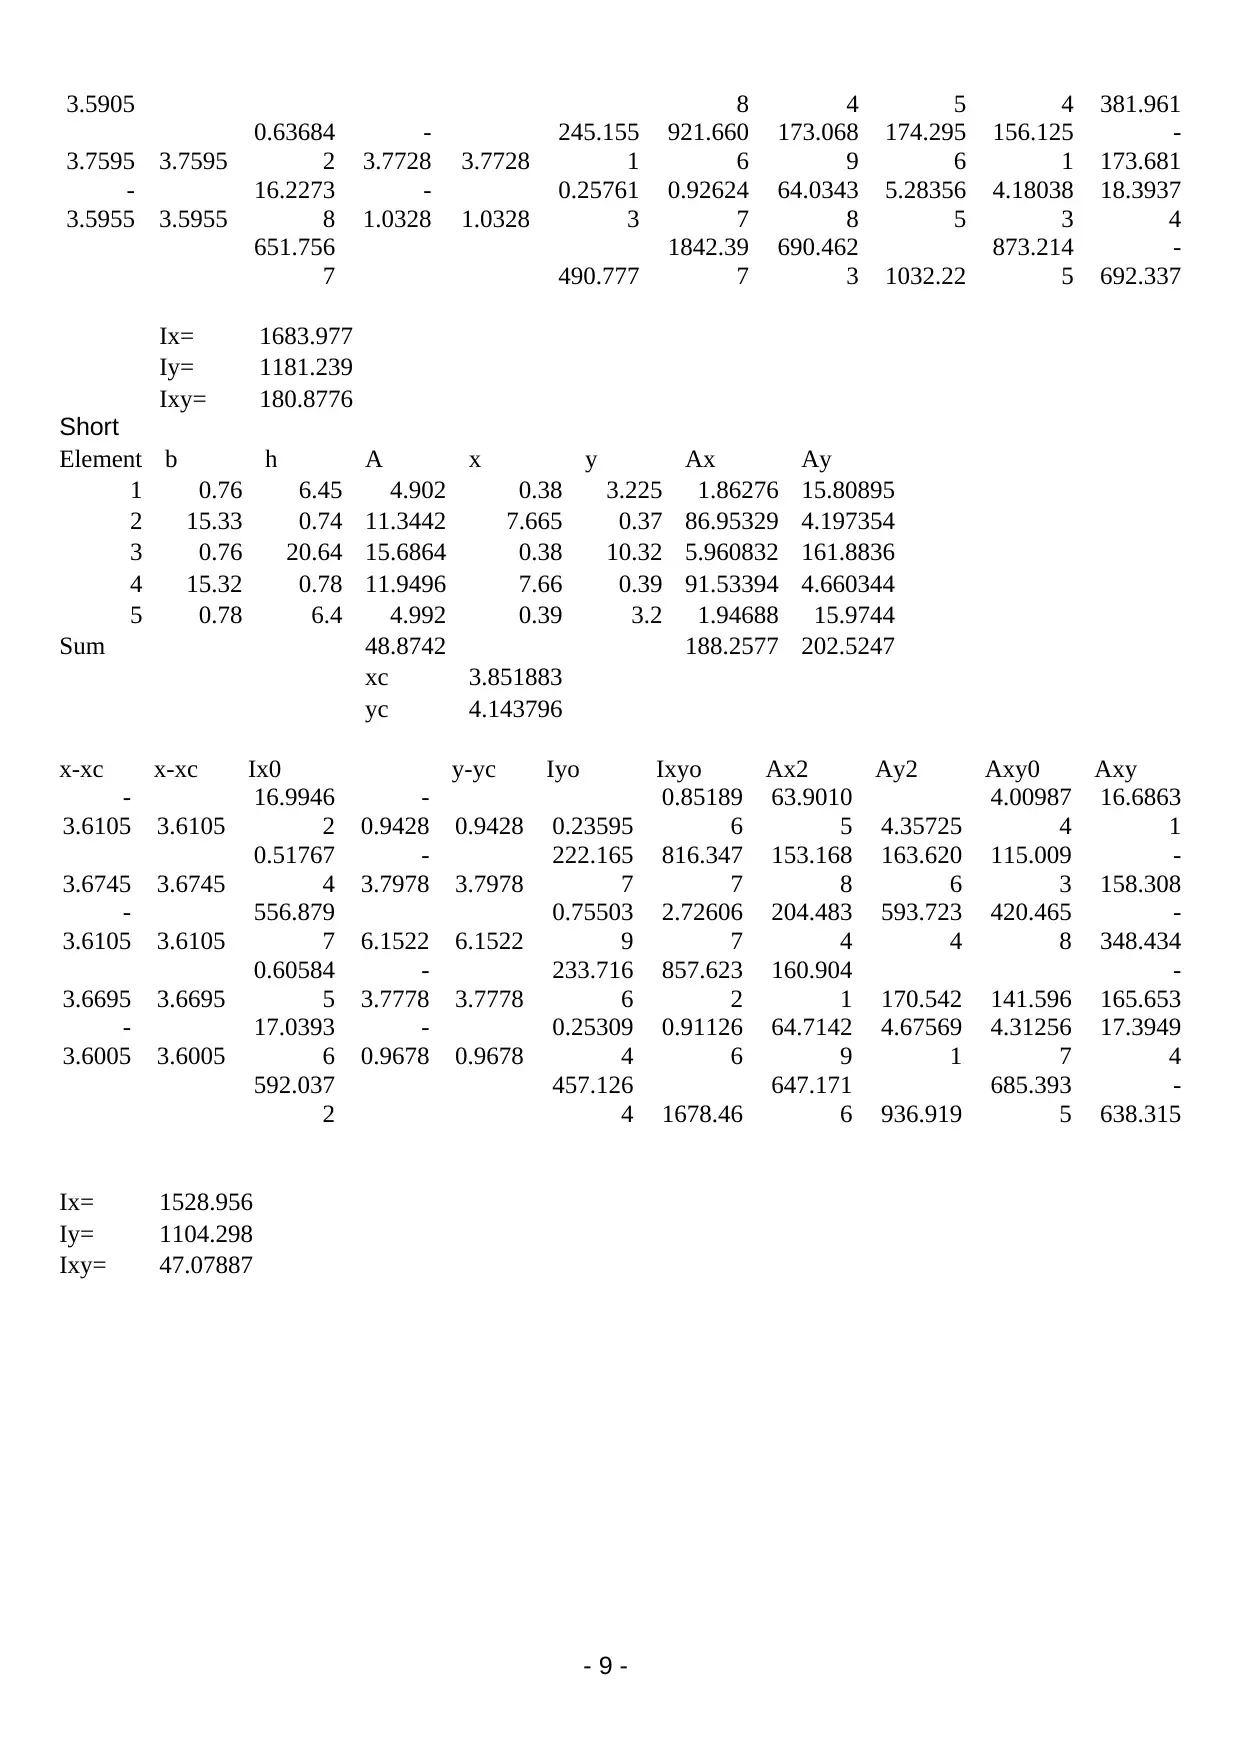
Appendices
Calculation of moments for 15 column
Elemen
t b h A x y Ax Ay
1 0.82 5.98 4.9036 0.41 2.99 2.010476 14.66176
2 15.2 0.82 12.464 7.6 0.41 94.7264 5.11024
3 0.8 21.49 17.192 0.4 10.745 6.8768 184.728
4 15.3 0.94 14.382 7.65 0.47 110.0223 6.75954
5 0.94 5.54 5.2076 0.47 2.77 2.447572 14.42505
Sum
54.149
2 216.0835 225.6846
xc
3.99052
2
yc 4.16783
x-xc x-xc Ix0 y-yc Iyo Ixyo Ax2 Ay2 Axy0 Axy
-
3.5805
3.580
5
14.6128
9
-
1.1778 1.1778
0.27476
5
0.98379
6
62.8640
6
6.80233
7
4.01511
2
20.6790
3
3.6095
3.609
5
0.69839
9
-
3.7578 3.7578
239.973
5
866.184
5
162.387
1
176.004
9
167.597
4
-
169.059
-
3.5905
3.590
5
661.634
3 6.5772 6.5772
0.91690
7
3.29215
3
221.633
9
743.718
4
606.656
9
-
405.997
3.6595
3.659
5
1.05899
5
-
3.6978 3.6978
280.556
9
1026.69
8
192.602
9
196.655
5
297.108
2
-
194.619
-
3.5205
3.520
5
13.3191
3
-
1.3978 1.3978
0.38345
3
1.34994
6
64.5425
8
10.1748
4 5.10726
25.6263
6
691.323
7
522.105
5
1898.50
8
704.030
6
1133.35
6
1080.48
5
-
723.369
Ix= 1824.68
Iy= 1226.136
Ixy= 357.1161
Mid
Eleme
nt b h A x y Ax Ay
1 0.79 6.35 5.0165 0.395 3.175 1.981518 15.92739
2 15.48 0.79
12.229
2 7.74 0.395 94.65401 4.830534
3 0.8 21 16.8 0.4 10.5 6.72 176.4
4 15.5 0.79 12.245 7.75 0.395 94.89875 4.836775
5 0.79 6.27 4.9533 0.395 3.135 1.956554 15.5286
Sum 51.244 200.2108 217.5233
xc 3.90701
yc
4.24485
4
x-xc x-xc Ix0 y-yc Iyo Ixyo Ax2 Ay2 Axy0 Axy
-
3.5955 3.5955
16.8564
9
-
0.9928 0.9928 0.2609
0.93806
5
64.8514
1
4.94452
2
4.39785
4
17.9069
6
3.7495 3.7495 0.63602
-
3.7728 3.7728
244.207
3
915.655
4
171.927
3
174.070
7
155.320
8
-
172.996
- 3.5905 617.4 6.3322 6.3322 0.896 3.21708 216.580 673.625 553.190 -
- 8 -
3.5905 8 4 5 4 381.961
3.7595 3.7595
0.63684
2
-
3.7728 3.7728
245.155
1
921.660
6
173.068
9
174.295
6
156.125
1
-
173.681
-
3.5955 3.5955
16.2273
8
-
1.0328 1.0328
0.25761
3
0.92624
7
64.0343
8
5.28356
5
4.18038
3
18.3937
4
651.756
7 490.777
1842.39
7
690.462
3 1032.22
873.214
5
-
692.337
Ix= 1683.977
Iy= 1181.239
Ixy= 180.8776
Short
Element b h A x y Ax Ay
1 0.76 6.45 4.902 0.38 3.225 1.86276 15.80895
2 15.33 0.74 11.3442 7.665 0.37 86.95329 4.197354
3 0.76 20.64 15.6864 0.38 10.32 5.960832 161.8836
4 15.32 0.78 11.9496 7.66 0.39 91.53394 4.660344
5 0.78 6.4 4.992 0.39 3.2 1.94688 15.9744
Sum 48.8742 188.2577 202.5247
xc 3.851883
yc 4.143796
x-xc x-xc Ix0 y-yc Iyo Ixyo Ax2 Ay2 Axy0 Axy
-
3.6105 3.6105
16.9946
2
-
0.9428 0.9428 0.23595
0.85189
6
63.9010
5 4.35725
4.00987
4
16.6863
1
3.6745 3.6745
0.51767
4
-
3.7978 3.7978
222.165
7
816.347
7
153.168
8
163.620
6
115.009
3
-
158.308
-
3.6105 3.6105
556.879
7 6.1522 6.1522
0.75503
9
2.72606
7
204.483
4
593.723
4
420.465
8
-
348.434
3.6695 3.6695
0.60584
5
-
3.7778 3.7778
233.716
6
857.623
2
160.904
1 170.542 141.596
-
165.653
-
3.6005 3.6005
17.0393
6
-
0.9678 0.9678
0.25309
4
0.91126
6
64.7142
9
4.67569
1
4.31256
7
17.3949
4
592.037
2
457.126
4 1678.46
647.171
6 936.919
685.393
5
-
638.315
Ix= 1528.956
Iy= 1104.298
Ixy= 47.07887
- 9 -
⊘ This is a preview!⊘
Do you want full access?
Subscribe today to unlock all pages.
Trusted by 1+ million students worldwide
1 out of 9
Your All-in-One AI-Powered Toolkit for Academic Success.
+13062052269
info@desklib.com
Available 24*7 on WhatsApp / Email
![[object Object]](/_next/static/media/star-bottom.7253800d.svg)
Unlock your academic potential
Copyright © 2020–2026 A2Z Services. All Rights Reserved. Developed and managed by ZUCOL.