Eco-Audit Analysis: Electric Bike Frame Material and Manufacturing
VerifiedAdded on 2020/04/21
|60
|6580
|84
Report
AI Summary
This report presents an eco-audit of electric bike frame materials, focusing on environmental and cost considerations using the CES tool. The study analyzes steel 4130, bamboo with aluminum joints, aluminum 6061, and carbon fiber/epoxy, examining their life cycle stages and manufacturing processes. The results from the CES tool are presented, comparing the materials' energy consumption, CO2 footprint, and cost. The report discusses material selection criteria, considering environmental ratings, cost ratings, and life cycle factors. The manufacturing processes for each material are detailed, including steel, carbon fiber, bamboo, and aluminum frames. The conclusion highlights carbon fiber/epoxy as the best material based on the analysis, despite its higher cost, emphasizing the importance of prioritizing environmental compatibility. The report includes appendices with detailed eco-audit reports for steel 4130, providing a comprehensive overview of the environmental impact of each material across its life cycle. This report is a valuable resource for students on Desklib seeking information on sustainable material selection in engineering design.
Eco Audit
1 | P a g e
Eco-Audit of an electric bike frame
1 | P a g e
Eco-Audit of an electric bike frame
Paraphrase This Document
Need a fresh take? Get an instant paraphrase of this document with our AI Paraphraser
Eco Audit
Abstract
The assignment deals with process involved in eco-audit process, especially for the material
selection of frames of the electric bike. To analyze the different parameter related with
environmental and cost, CES tool has been utilized and data were presented for making criteria
of material selection. The different stages of life cycle have also been considered for making
criteria for material selection. A brief manufacturing process is described followed by
conclusion.
2 | P a g e
Eco Audit
Contents
Introduction......................................................................................................................................4
Method.............................................................................................................................................4
Results..............................................................................................................................................4
Steel 4130....................................................................................................................................4
Bamboo with aluminium (6061) joints........................................................................................5
Aluminium 6061..........................................................................................................................5
Carbon fibre/epoxy......................................................................................................................6
Discussion........................................................................................................................................6
Material selection and manufacturing process................................................................................7
1) Steel frame:.......................................................................................................................7
2) Carbon frame.....................................................................................................................7
3) Bamboo frame...................................................................................................................8
4) Aluminium frame..............................................................................................................9
Conclusion.......................................................................................................................................9
References......................................................................................................................................10
3 | P a g e
⊘ This is a preview!⊘
Do you want full access?
Subscribe today to unlock all pages.
Trusted by 1+ million students worldwide
Eco Audit
Introduction
Motor bike is one of the most important and popular vehicle in all over world, but due to fuel
used in this vehicle in the form of petroleum product, bringing it down from popularity. There
are several attempt has been taken to reduce the fuel consumption in bike, in order to increase the
efficiency and reduce the impact on environment. Innovation of fuel bike into electric car is one
such option, in which we will use battery in place of liquid petroleum. In order to design the bike
for electric power, we have to design the frame accordingly; the different manufacturing process
for different material is given as follows.
Method
For the purpose of environmental audit, the best way is to start from the analysis the given
material which is listed in the assignment; we have to know the different property of each
material by giving the required data set in CES tool pack and CES selector for material. This
software provide the instant report especially for the purpose of early design in the software, with
the use of CES tool pack we can easily investigate the CO2 footprint details, Energy details and
cost details simultaneously, this will help further investigative the result in deciding the material
selection. All the parameter given in CES tool pack is according to the England currency and
their environmental consideration.
Results
The result obtained from the CES tool pack for four different materials are given in appendices
of this report.
Discussion
Based on the above fact and figure, the material can be analysed which is as follows,
The various end of life potential for all four materials indicates that aluminium has minimum
potential, this means that the reusability of aluminium is maximum even at the end of life it can
be used by re-manufacture the material from old one. This life cycle potential of aluminium is
followed by and then bamboo, the maximum potential comes under the carbon fibre material.
The cost of different material is also described in above table, and it was found that, the
maximum cost occurring in the given material is from carbon fibre and least expensive material
is bamboo with aluminium joints.
The selection criteria of different material also depends upon what is our objective to achieve, in
a particular project, in this case, since it is eco audit, so I have to give priority to environmental
factor. Since life cycle of different material is given as 15 years for carbon and steel and 5 years
for bamboo and aluminium. The priority selection for material will be done on giving rating for
different material, which is described in the table below.
4 | P a g e
Paraphrase This Document
Need a fresh take? Get an instant paraphrase of this document with our AI Paraphraser
Eco Audit
Materials Energy Cost
Environmenta
l rating
Cost
rating
Life cycle
factor Total factor
Steel 4130 -441 388 5 2 3 30
Bamboo -66.6 138 8 5 1 40
Aluminium -1.09E+03 146 7 4 1 28
Carbon fibre -31 827 6 3 3 54
Table 1 - Selection criteria for materials
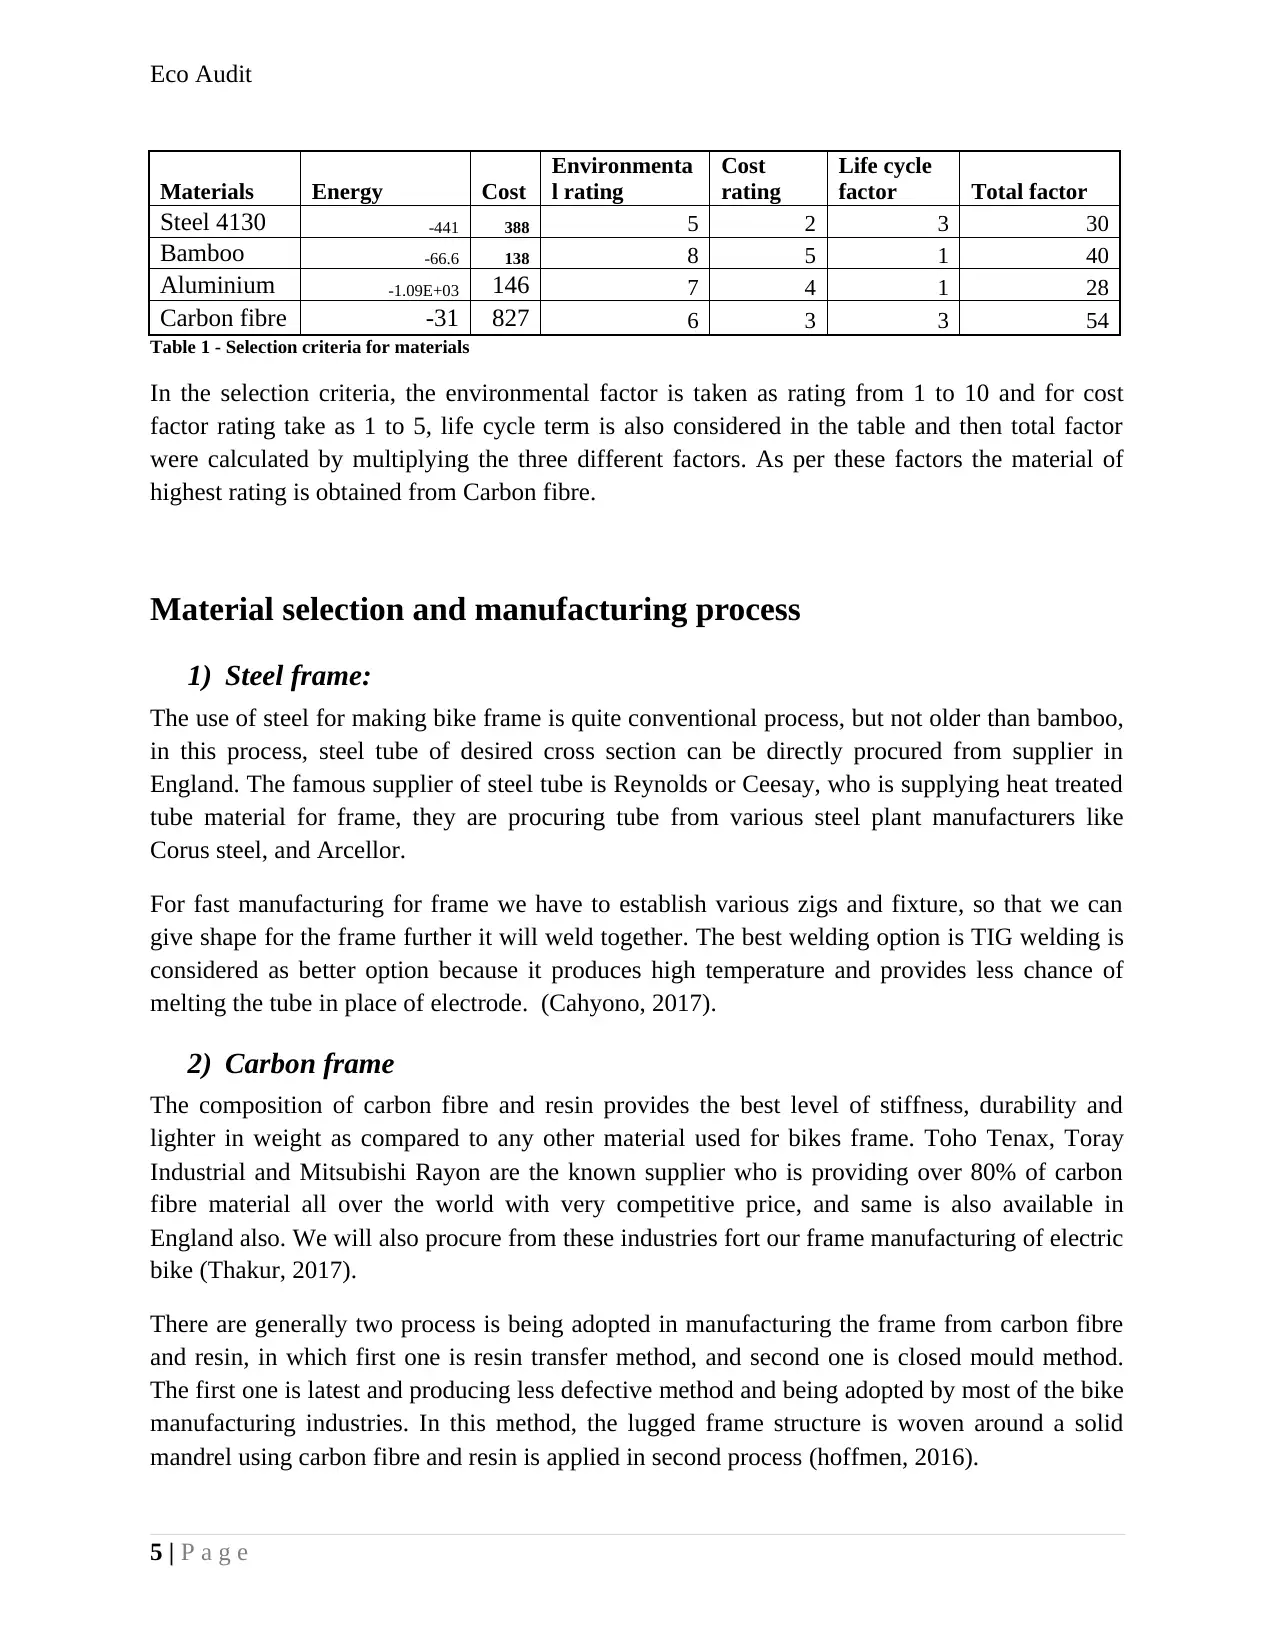
In the selection criteria, the environmental factor is taken as rating from 1 to 10 and for cost
factor rating take as 1 to 5, life cycle term is also considered in the table and then total factor
were calculated by multiplying the three different factors. As per these factors the material of
highest rating is obtained from Carbon fibre.
Material selection and manufacturing process
1) Steel frame:
The use of steel for making bike frame is quite conventional process, but not older than bamboo,
in this process, steel tube of desired cross section can be directly procured from supplier in
England. The famous supplier of steel tube is Reynolds or Ceesay, who is supplying heat treated
tube material for frame, they are procuring tube from various steel plant manufacturers like
Corus steel, and Arcellor.
For fast manufacturing for frame we have to establish various zigs and fixture, so that we can
give shape for the frame further it will weld together. The best welding option is TIG welding is
considered as better option because it produces high temperature and provides less chance of
melting the tube in place of electrode. (Cahyono, 2017).
2) Carbon frame
The composition of carbon fibre and resin provides the best level of stiffness, durability and
lighter in weight as compared to any other material used for bikes frame. Toho Tenax, Toray
Industrial and Mitsubishi Rayon are the known supplier who is providing over 80% of carbon
fibre material all over the world with very competitive price, and same is also available in
England also. We will also procure from these industries fort our frame manufacturing of electric
bike (Thakur, 2017).
There are generally two process is being adopted in manufacturing the frame from carbon fibre
and resin, in which first one is resin transfer method, and second one is closed mould method.
The first one is latest and producing less defective method and being adopted by most of the bike
manufacturing industries. In this method, the lugged frame structure is woven around a solid
mandrel using carbon fibre and resin is applied in second process (hoffmen, 2016).
5 | P a g e
Materials Energy Cost
Environmenta
l rating
Cost
rating
Life cycle
factor Total factor
Steel 4130 -441 388 5 2 3 30
Bamboo -66.6 138 8 5 1 40
Aluminium -1.09E+03 146 7 4 1 28
Carbon fibre -31 827 6 3 3 54
Table 1 - Selection criteria for materials
In the selection criteria, the environmental factor is taken as rating from 1 to 10 and for cost
factor rating take as 1 to 5, life cycle term is also considered in the table and then total factor
were calculated by multiplying the three different factors. As per these factors the material of
highest rating is obtained from Carbon fibre.
Material selection and manufacturing process
1) Steel frame:
The use of steel for making bike frame is quite conventional process, but not older than bamboo,
in this process, steel tube of desired cross section can be directly procured from supplier in
England. The famous supplier of steel tube is Reynolds or Ceesay, who is supplying heat treated
tube material for frame, they are procuring tube from various steel plant manufacturers like
Corus steel, and Arcellor.
For fast manufacturing for frame we have to establish various zigs and fixture, so that we can
give shape for the frame further it will weld together. The best welding option is TIG welding is
considered as better option because it produces high temperature and provides less chance of
melting the tube in place of electrode. (Cahyono, 2017).
2) Carbon frame
The composition of carbon fibre and resin provides the best level of stiffness, durability and
lighter in weight as compared to any other material used for bikes frame. Toho Tenax, Toray
Industrial and Mitsubishi Rayon are the known supplier who is providing over 80% of carbon
fibre material all over the world with very competitive price, and same is also available in
England also. We will also procure from these industries fort our frame manufacturing of electric
bike (Thakur, 2017).
There are generally two process is being adopted in manufacturing the frame from carbon fibre
and resin, in which first one is resin transfer method, and second one is closed mould method.
The first one is latest and producing less defective method and being adopted by most of the bike
manufacturing industries. In this method, the lugged frame structure is woven around a solid
mandrel using carbon fibre and resin is applied in second process (hoffmen, 2016).
5 | P a g e
Eco Audit
The second process is also known as tube to tube or monocoque construction, in this method a
light thing metal frame is being taken and over wrapping is done with carbon fibre and resin, all
giving proper wrap to for required section, all the frame is kept into a pre shaped mould and
baked in oven at high pressure. In this we provide the thermoset to the carbon fibre with resin,
the frame after heat treatment becomes high strength material and lighter in weight which is
suitable for frame structure. This process is suitable for large volume of production and is being
used now days.
3) Bamboo frame
The oldest method of making bike frame is bamboo frame. After introduction of different
material to the world bamboo has been replaced by this material but with the advent of green
movement, this process is being adopted again by few manufacturers. The transportation cost
will be very less if we install the facility at this place (Wiafe-Akenteng, 2016).
The manufacturing process will starts with harvesting the bamboo, stored it is dry place, because
it is in raw stage. The Starks of this bamboo is heat treated so that it become more durable, the
heat treatment can be automated by providing continuous flame or torch heating, the bamboos
are susceptible to moisture, and to avoid this we can coat this with polyurethane (Jonathan
Arnone, 2015).
4) Aluminium frame
The frame made with aluminium alloys is having lightest weight in all above material. The main
supplier of 7005 grade aluminium alloys is aluminium warehouse limited, which can supply the
tubes of any cross section which will be useful for our bike frame. Due to its property, this
material can take form of any shape very easily (Cheney, 2017).
The process starts with heat treatment of aluminium alloys with T4 and T6 heat treatment
process. In T4 heat treatment, this will be heated up to 480oC and cooled slowly, this is done to
acquire the desired shapes of the frame, and after T4 treatment we can go directly to T6 to
strengthen the aluminium alloys. Rest of the process follows after heat treatment is similar to
steel frame (Goldberg, 2015).
Conclusion
Based on the above rating and manufacturing process, finally we can conclude that, carbon fibre
with epoxy resin is the best material for making bike frames; even it is costliest of all of the four
materials. But in order to sustain the environmental compatibility, most of the processes and
material giving rise to the cost, instead of rising cost, the people are selecting the material which
is environmental friendly, because most of the people aware loosing eco-friendly scenario at the
price of low cost material selection, ultimately results much costlier for next generation.
6 | P a g e
⊘ This is a preview!⊘
Do you want full access?
Subscribe today to unlock all pages.
Trusted by 1+ million students worldwide
Eco Audit
References
Cahyono, S. I. (2017). Analysis of electric bicycle frame geometries. American Institute of
Physics, 1-6.
Cheney, B. (2017). Waste Heat Recovery in Bicycle Manufacturing Process for Specialized.
Nicholas School of the Environmental studies, 1-55.
Goldberg, D. (2015). Bicycle Manufacturing Industry. npcs, 1-9.
hoffmen, V. (2016). Carbon Fiber. Velocity journal, 1-5.
Jonathan Arnone, R. B. (2015). Engineering a Bamboo Bicycle. Worcester Polytechnic Institute,
1-110.
Material Selection using CES edupack. (2010). Granta Design, 1-57.
Thakur, M. S. (2017). Investigation of design parameter of two wheeler frame through
comparative analysis. Scholar of Automobile Engineering, 1-4.
Wiafe-Akenteng, D. (2016). Bamboo for bikes. ghana bamboo bike organisation, 1-20.
yen, c. (2016). Design and development of carbon fibre bike frame. Technosoft age, 1-8.
7 | P a g e
Paraphrase This Document
Need a fresh take? Get an instant paraphrase of this document with our AI Paraphraser
Eco Audit
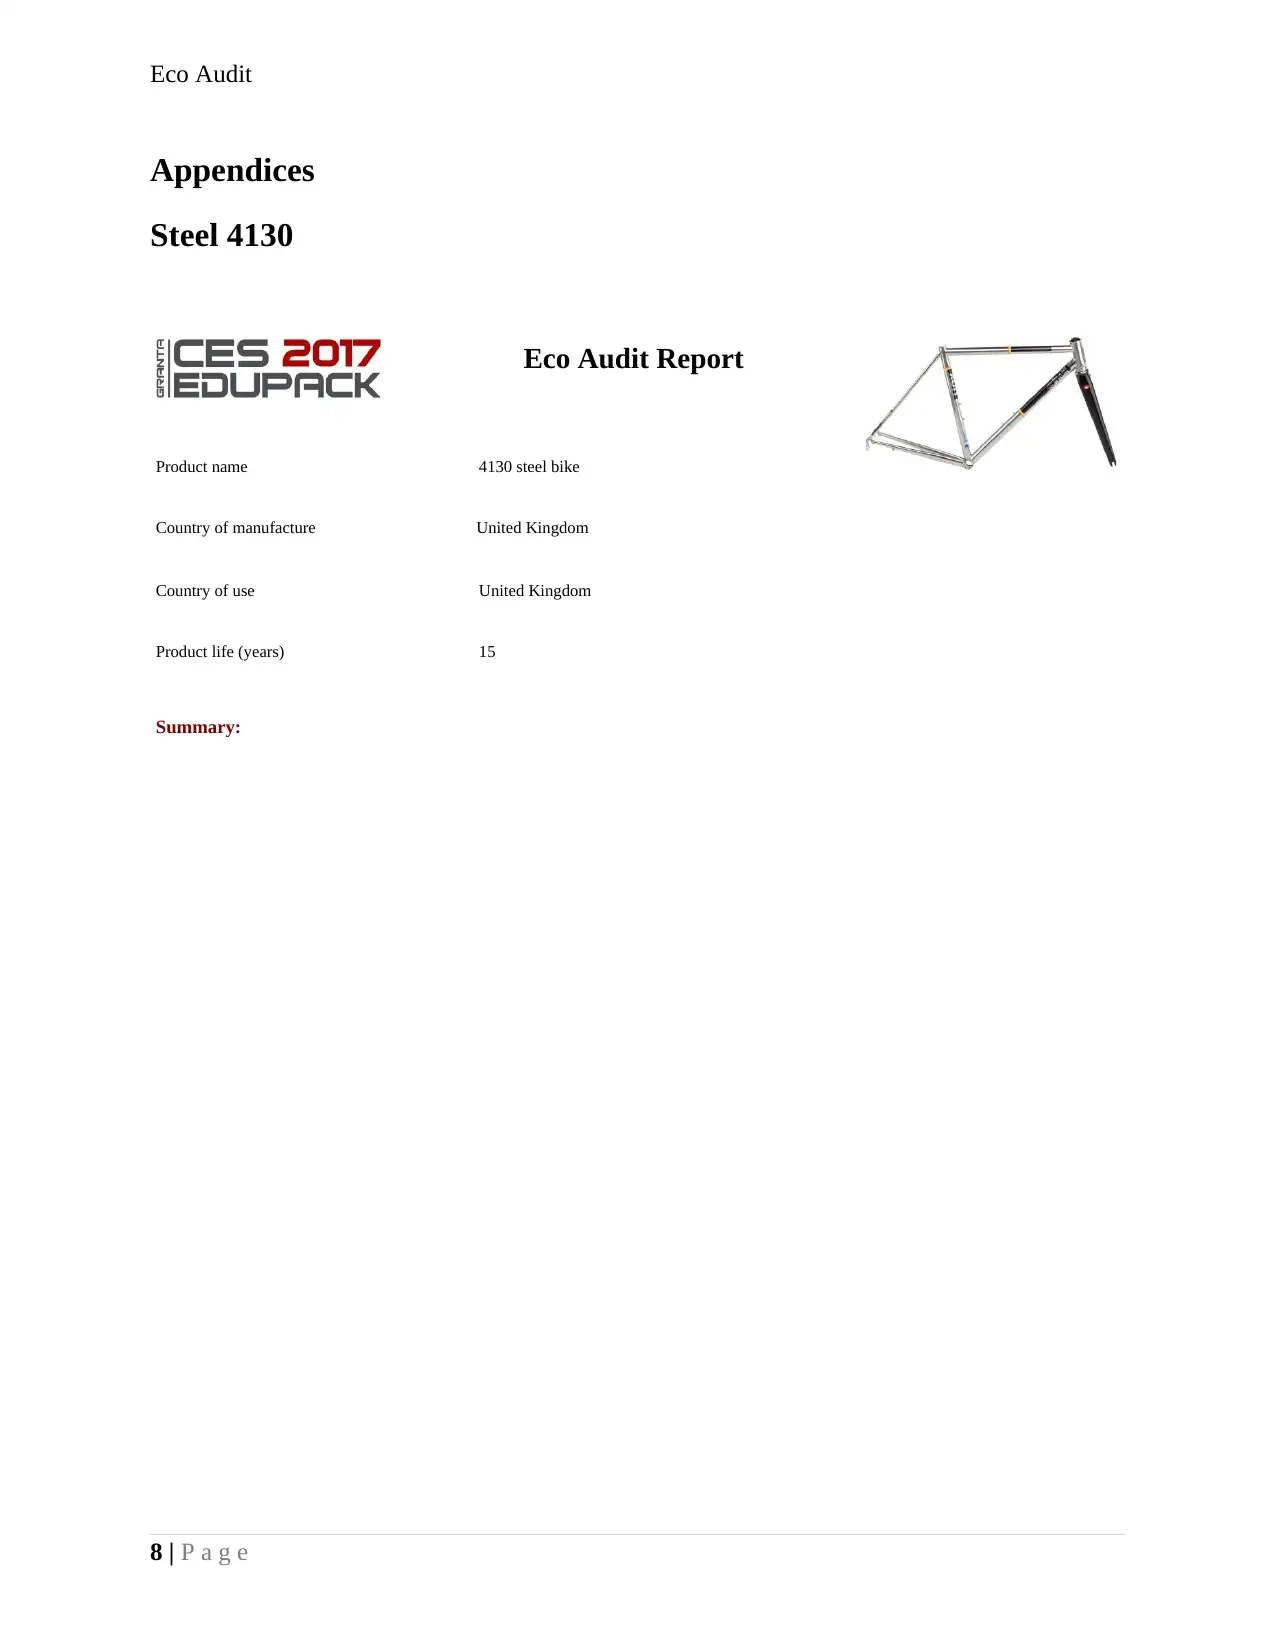
Appendices
Steel 4130
Eco Audit Report
Product name 4130 steel bike
Country of manufacture United Kingdom
Country of use United Kingdom
Product life (years) 15
Summary:
8 | P a g e
Appendices
Steel 4130
Eco Audit Report
Product name 4130 steel bike
Country of manufacture United Kingdom
Country of use United Kingdom
Product life (years) 15
Summary:
8 | P a g e
Eco Audit
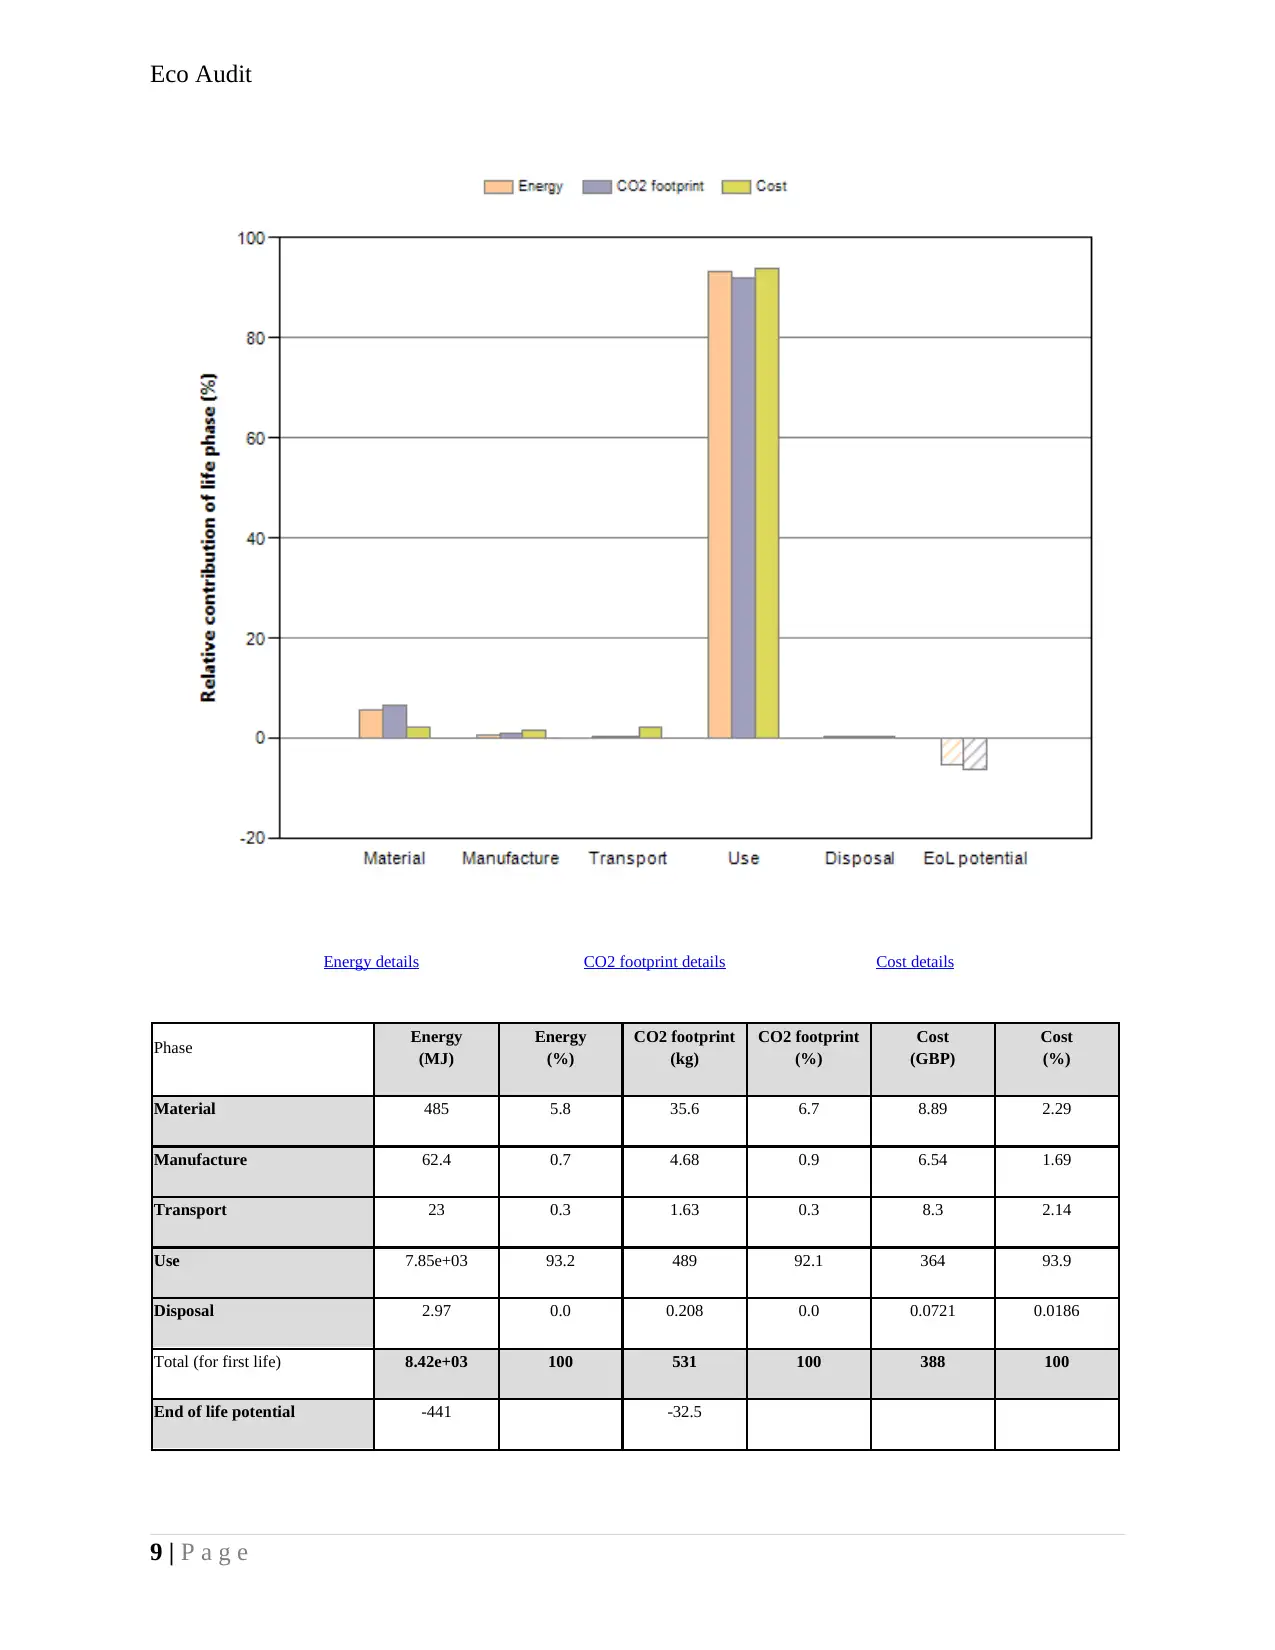
Energy details CO2 footprint details Cost details
Phase Energy
(MJ)
Energy
(%)
CO2 footprint
(kg)
CO2 footprint
(%)
Cost
(GBP)
Cost
(%)
Material 485 5.8 35.6 6.7 8.89 2.29
Manufacture 62.4 0.7 4.68 0.9 6.54 1.69
Transport 23 0.3 1.63 0.3 8.3 2.14
Use 7.85e+03 93.2 489 92.1 364 93.9
Disposal 2.97 0.0 0.208 0.0 0.0721 0.0186
Total (for first life) 8.42e+03 100 531 100 388 100
End of life potential -441 -32.5
9 | P a g e
⊘ This is a preview!⊘
Do you want full access?
Subscribe today to unlock all pages.
Trusted by 1+ million students worldwide
Eco Audit
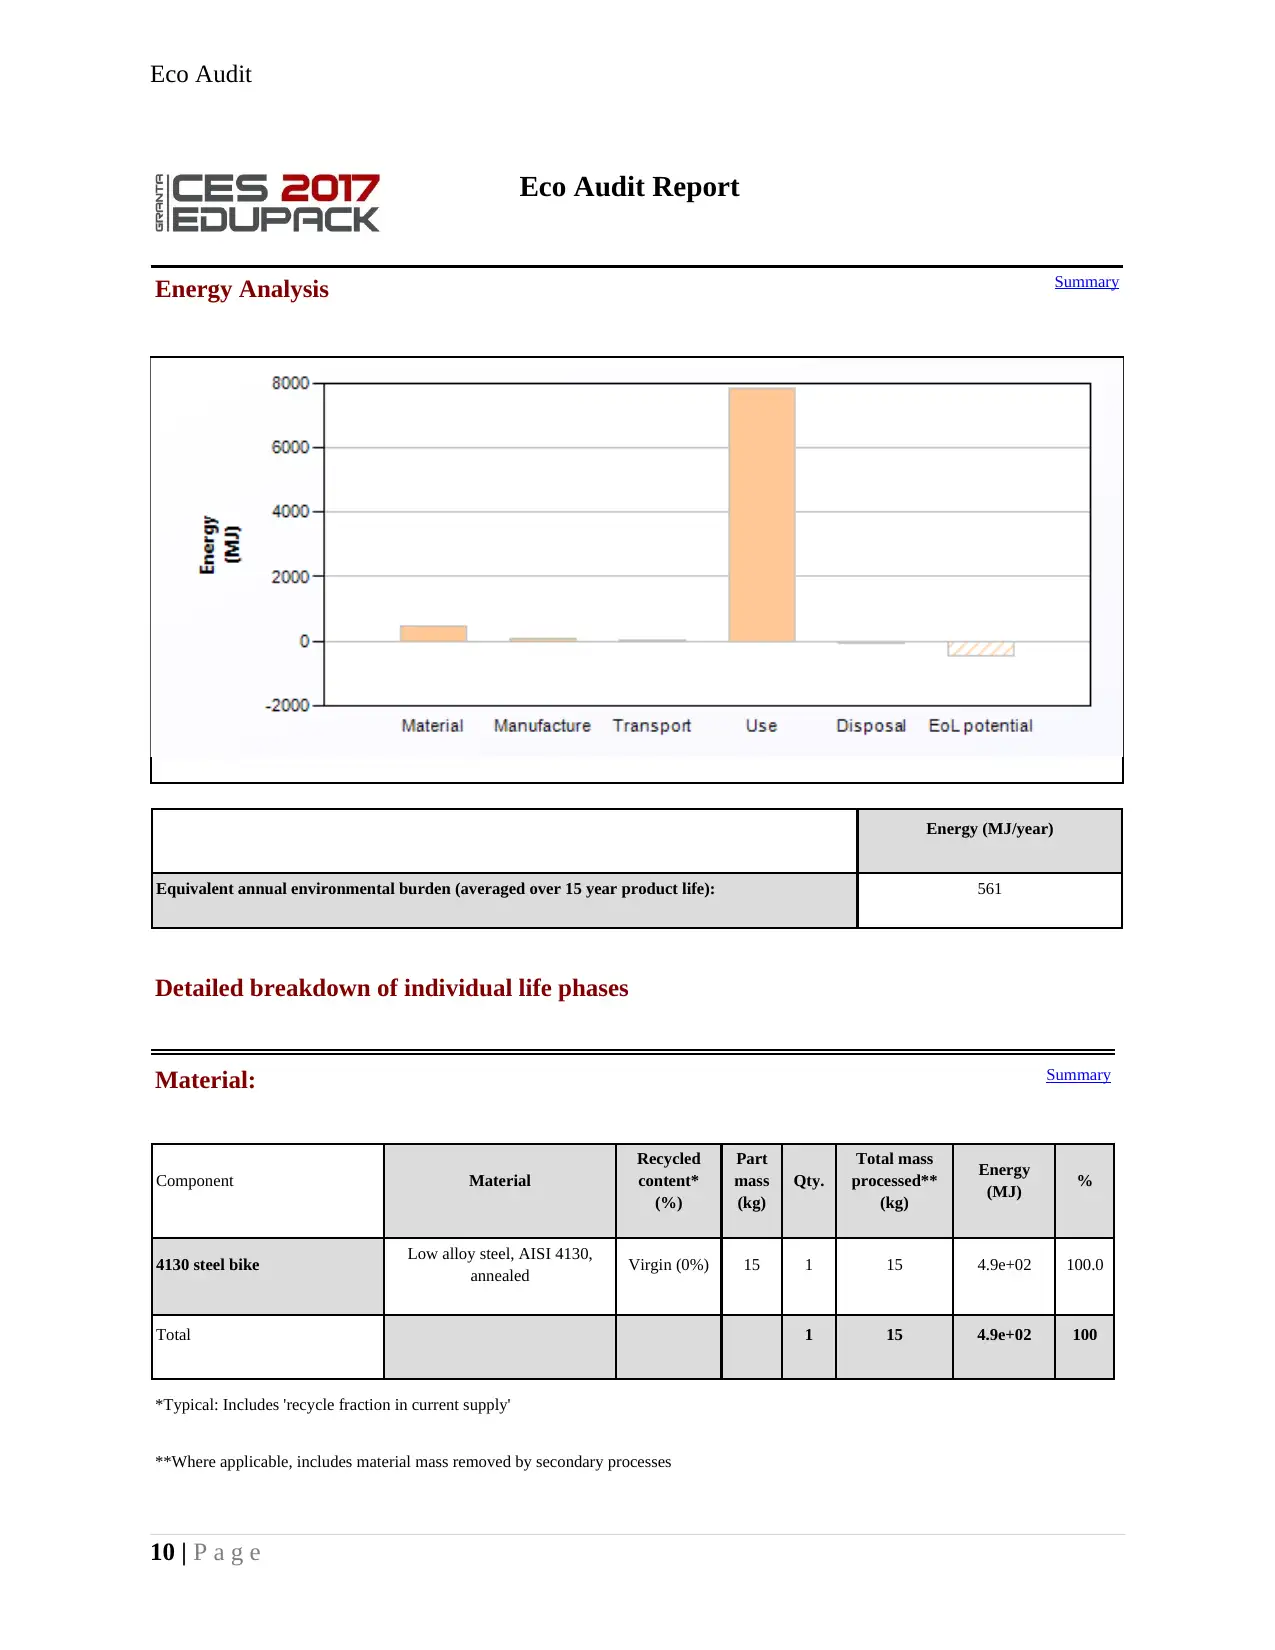
Eco Audit Report
Summary
Energy Analysis
Energy (MJ/year)
Equivalent annual environmental burden (averaged over 15 year product life): 561
Detailed breakdown of individual life phases
Material: Summary
Component Material
Recycled
content*
(%)
Part
mass
(kg)
Qty.
Total mass
processed**
(kg)
Energy
(MJ) %
4130 steel bike Low alloy steel, AISI 4130,
annealed Virgin (0%) 15 1 15 4.9e+02 100.0
Total 1 15 4.9e+02 100
*Typical: Includes 'recycle fraction in current supply'
**Where applicable, includes material mass removed by secondary processes
10 | P a g e
Paraphrase This Document
Need a fresh take? Get an instant paraphrase of this document with our AI Paraphraser
Eco Audit
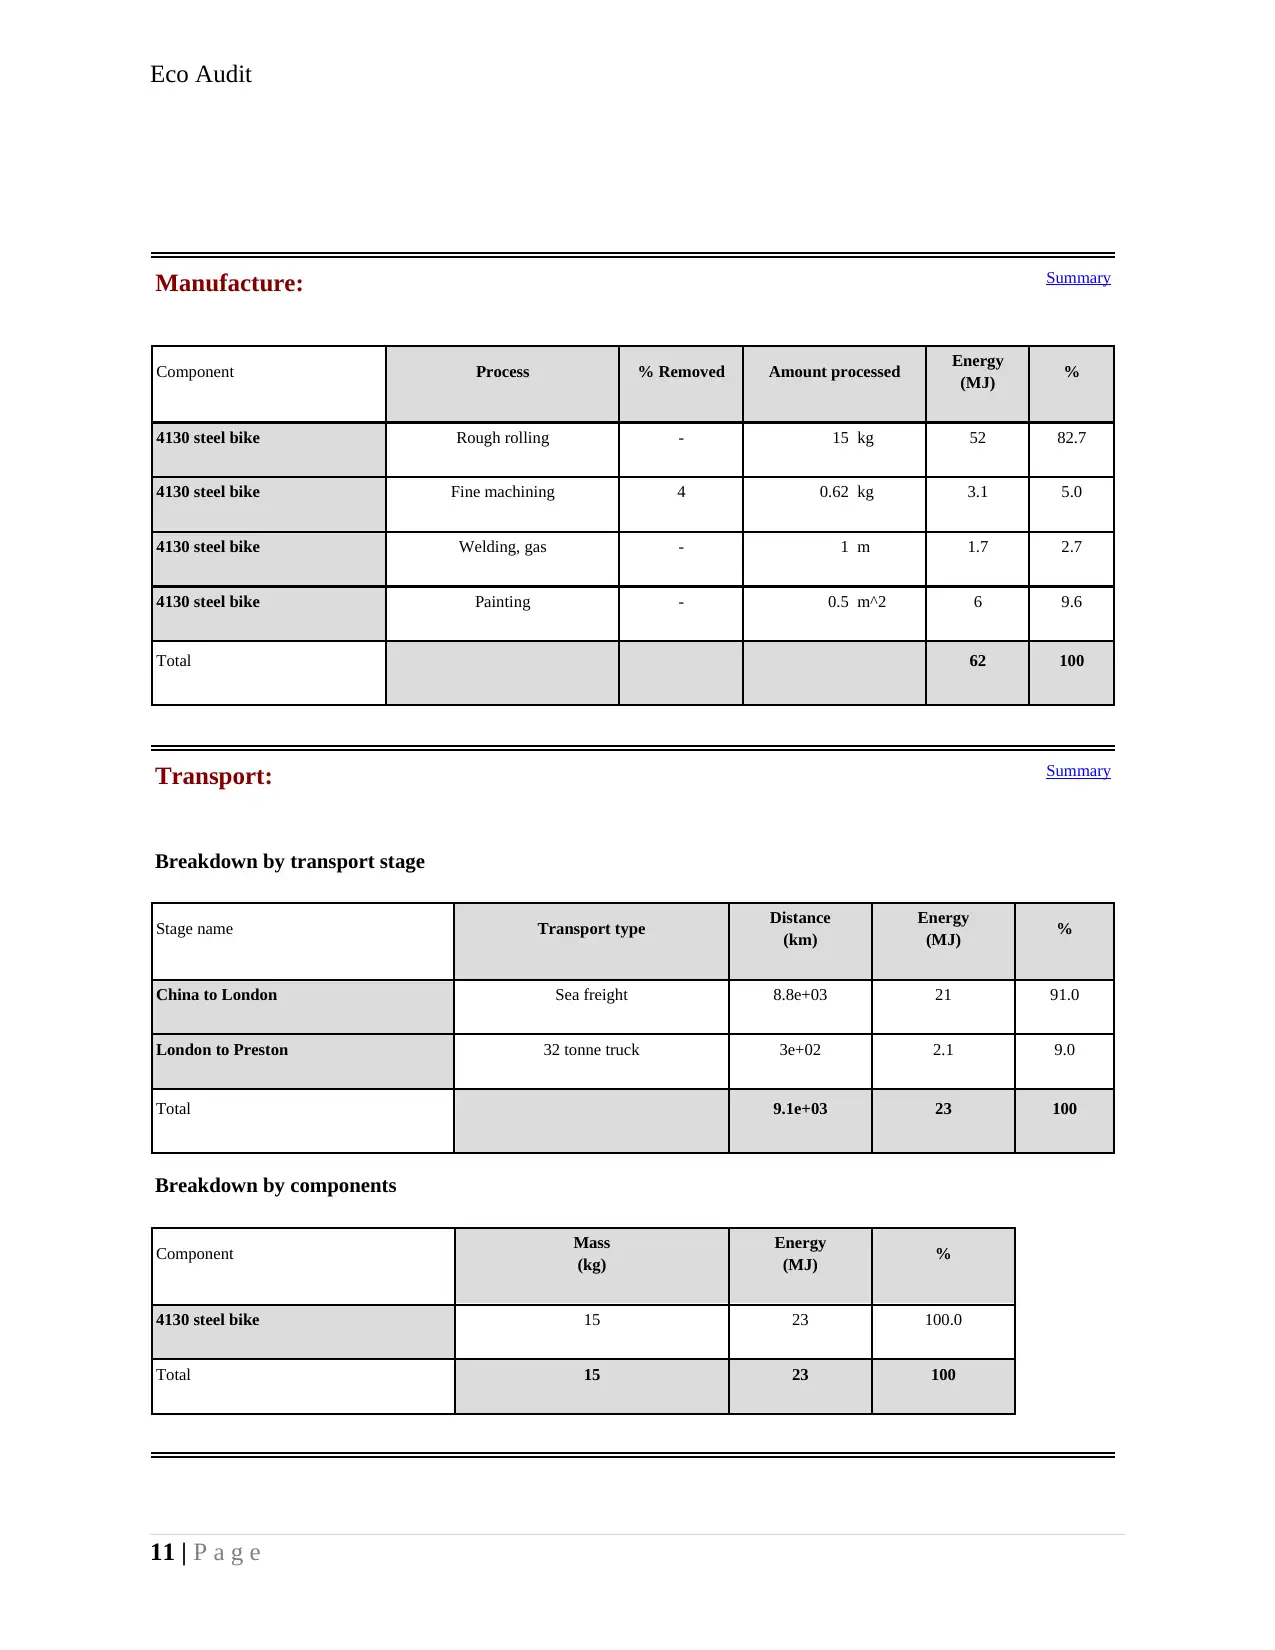
Manufacture: Summary
Component Process % Removed Amount processed Energy
(MJ) %
4130 steel bike Rough rolling - 15 kg 52 82.7
4130 steel bike Fine machining 4 0.62 kg 3.1 5.0
4130 steel bike Welding, gas - 1 m 1.7 2.7
4130 steel bike Painting - 0.5 m^2 6 9.6
Total 62 100
Transport: Summary
Breakdown by transport stage
Stage name Transport type Distance
(km)
Energy
(MJ) %
China to London Sea freight 8.8e+03 21 91.0
London to Preston 32 tonne truck 3e+02 2.1 9.0
Total 9.1e+03 23 100
Breakdown by components
Component Mass
(kg)
Energy
(MJ) %
4130 steel bike 15 23 100.0
Total 15 23 100
11 | P a g e
Eco Audit
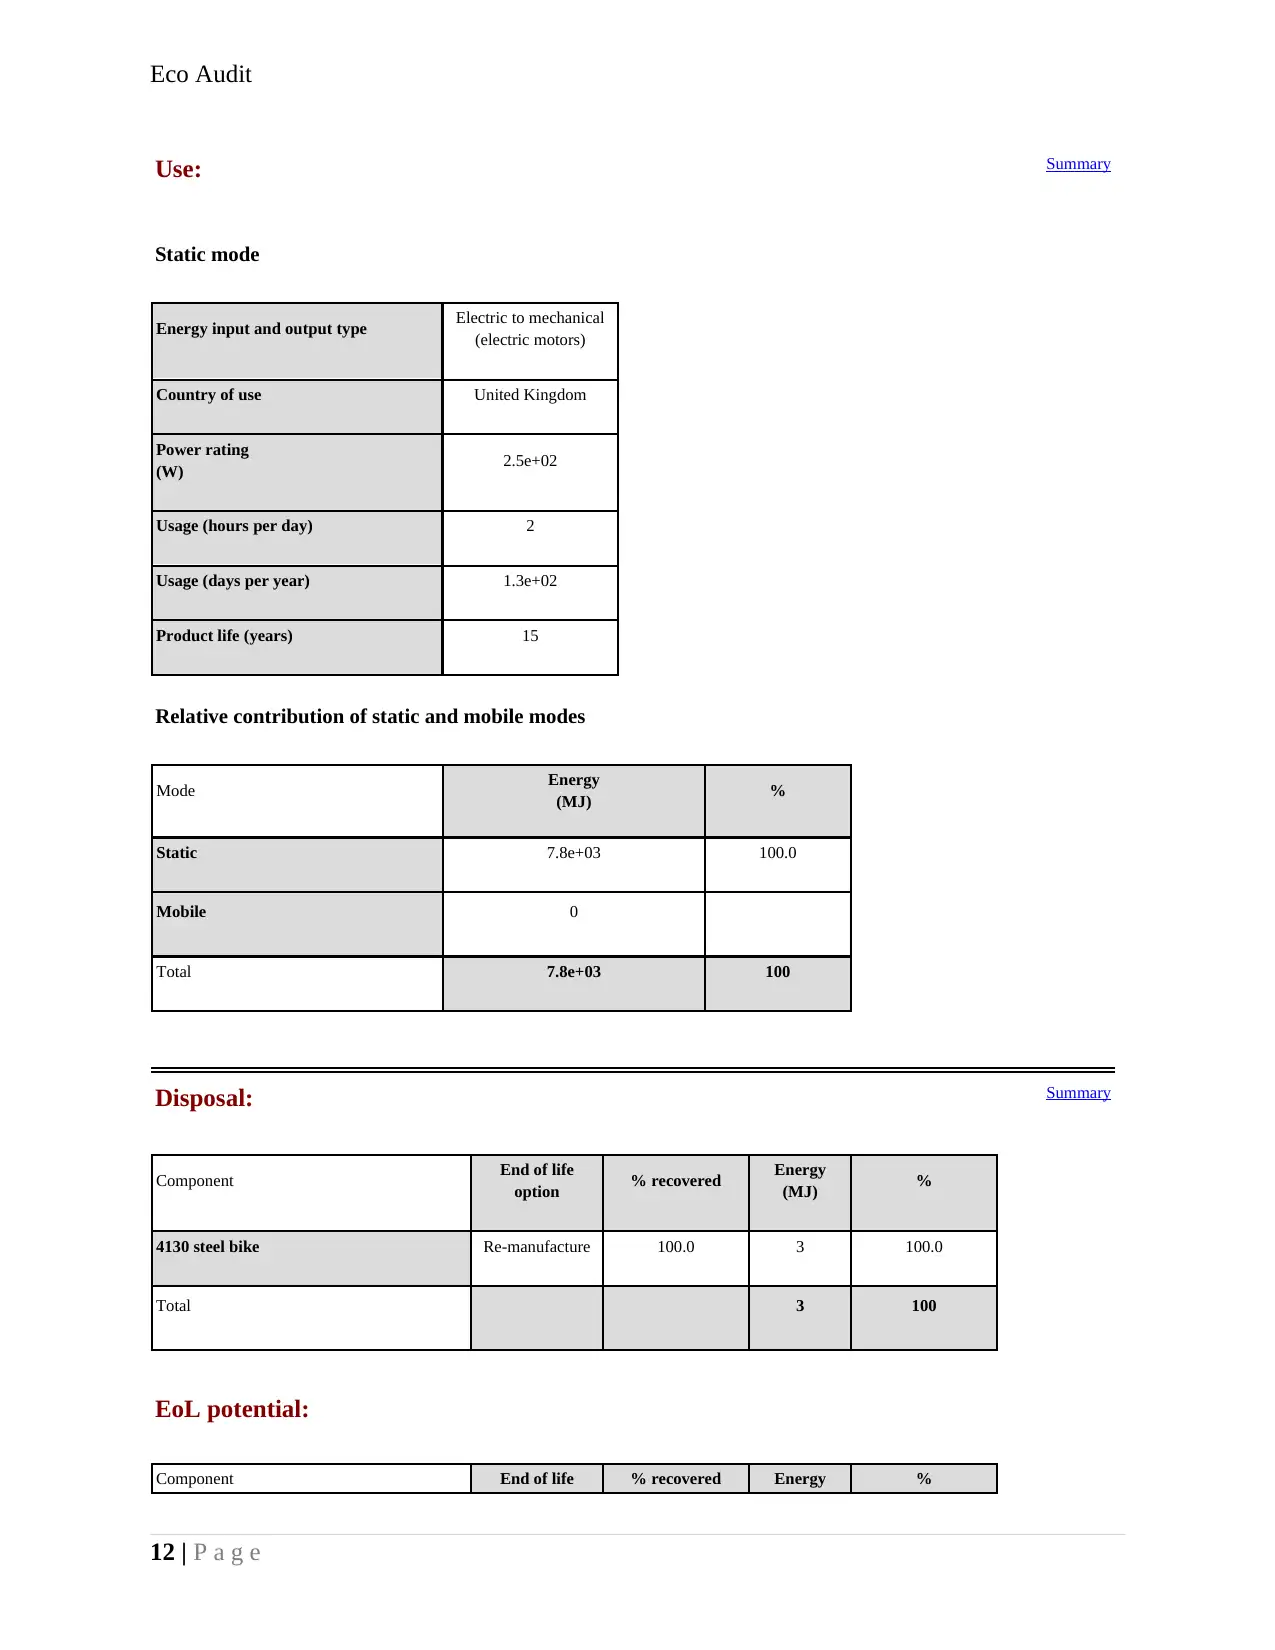
Use: Summary
Static mode
Energy input and output type Electric to mechanical
(electric motors)
Country of use United Kingdom
Power rating
(W) 2.5e+02
Usage (hours per day) 2
Usage (days per year) 1.3e+02
Product life (years) 15
Relative contribution of static and mobile modes
Mode Energy
(MJ) %
Static 7.8e+03 100.0
Mobile 0
Total 7.8e+03 100
Disposal: Summary
Component End of life
option % recovered Energy
(MJ) %
4130 steel bike Re-manufacture 100.0 3 100.0
Total 3 100
EoL potential:
Component End of life % recovered Energy %
12 | P a g e
⊘ This is a preview!⊘
Do you want full access?
Subscribe today to unlock all pages.
Trusted by 1+ million students worldwide
1 out of 60

Your All-in-One AI-Powered Toolkit for Academic Success.
+13062052269
info@desklib.com
Available 24*7 on WhatsApp / Email
![[object Object]](/_next/static/media/star-bottom.7253800d.svg)
Unlock your academic potential
Copyright © 2020–2026 A2Z Services. All Rights Reserved. Developed and managed by ZUCOL.