Testing of Materials: Tensile Testing and Material Properties Analysis
VerifiedAdded on 2022/05/23
|16
|2686
|15
Report
AI Summary
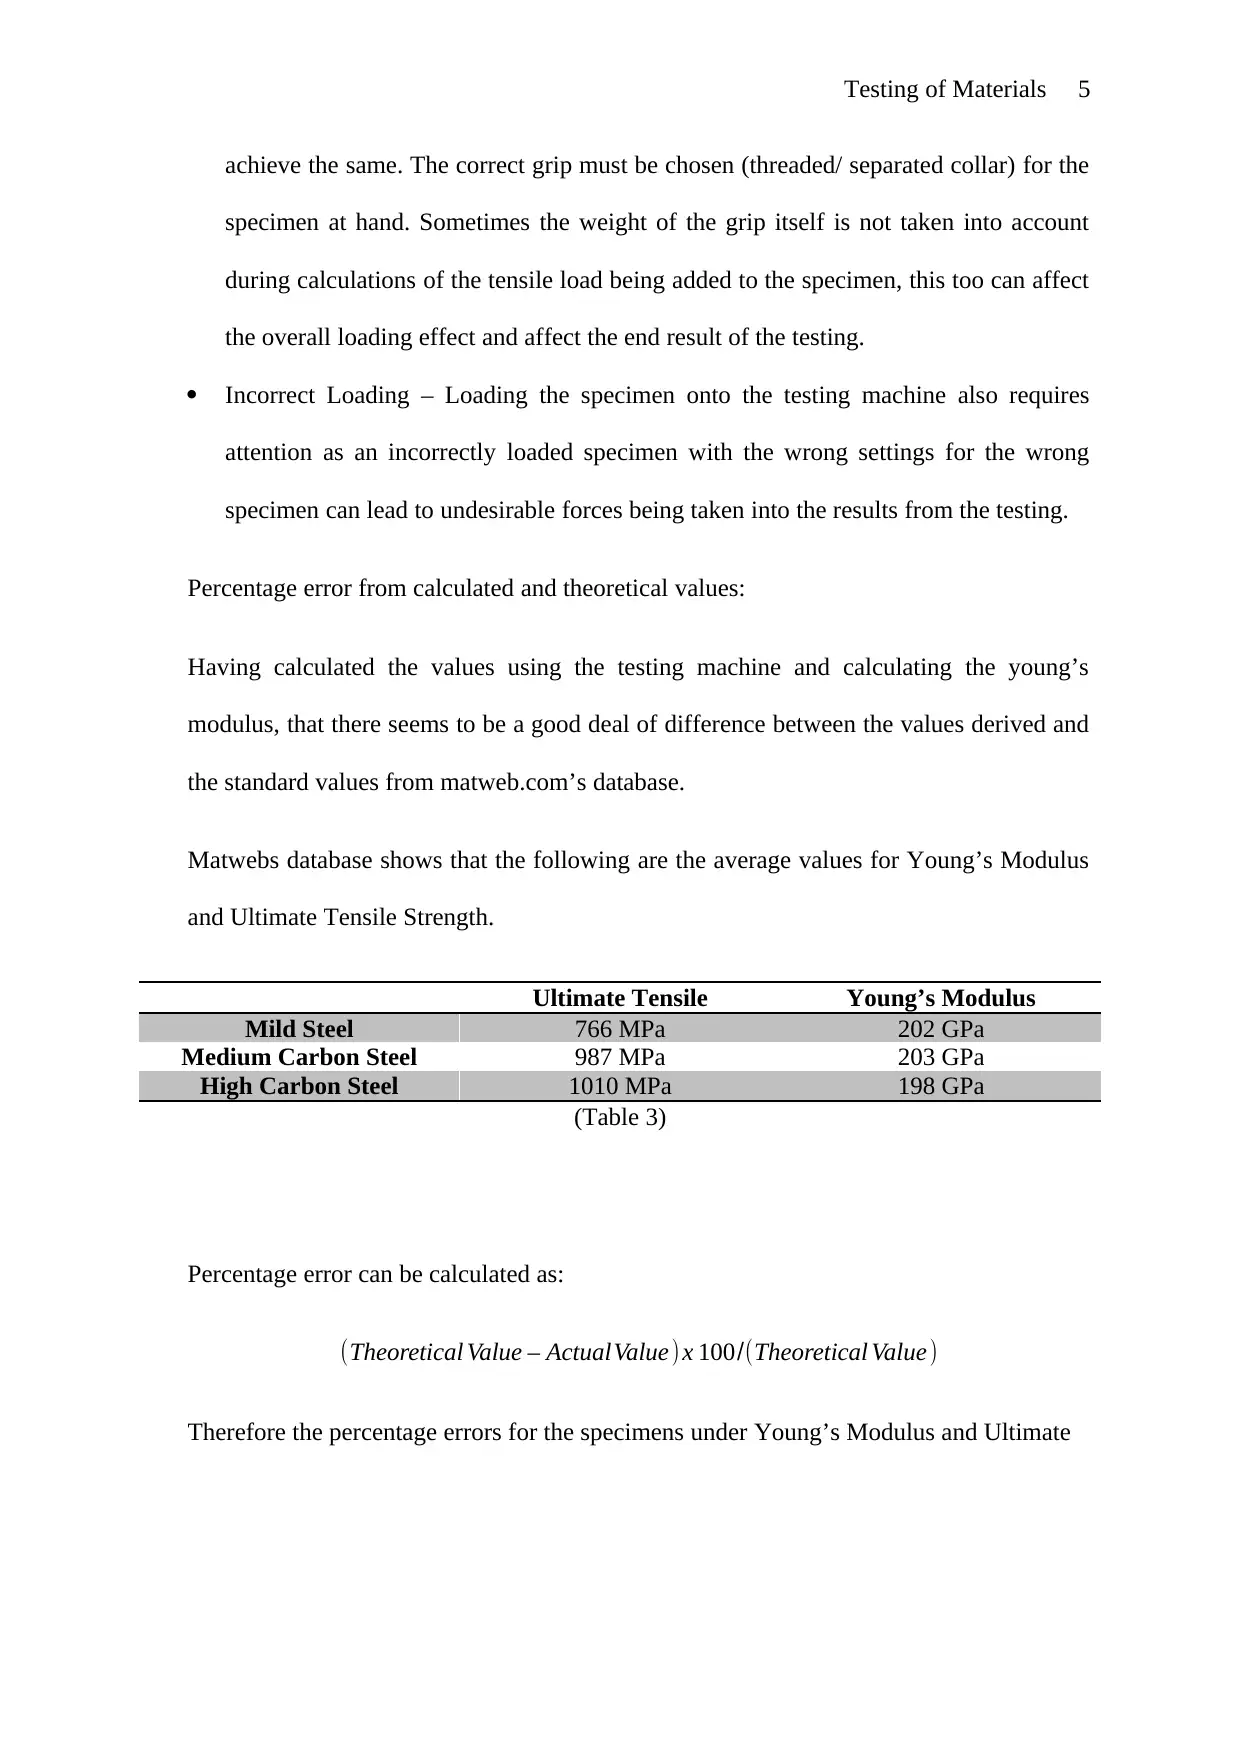
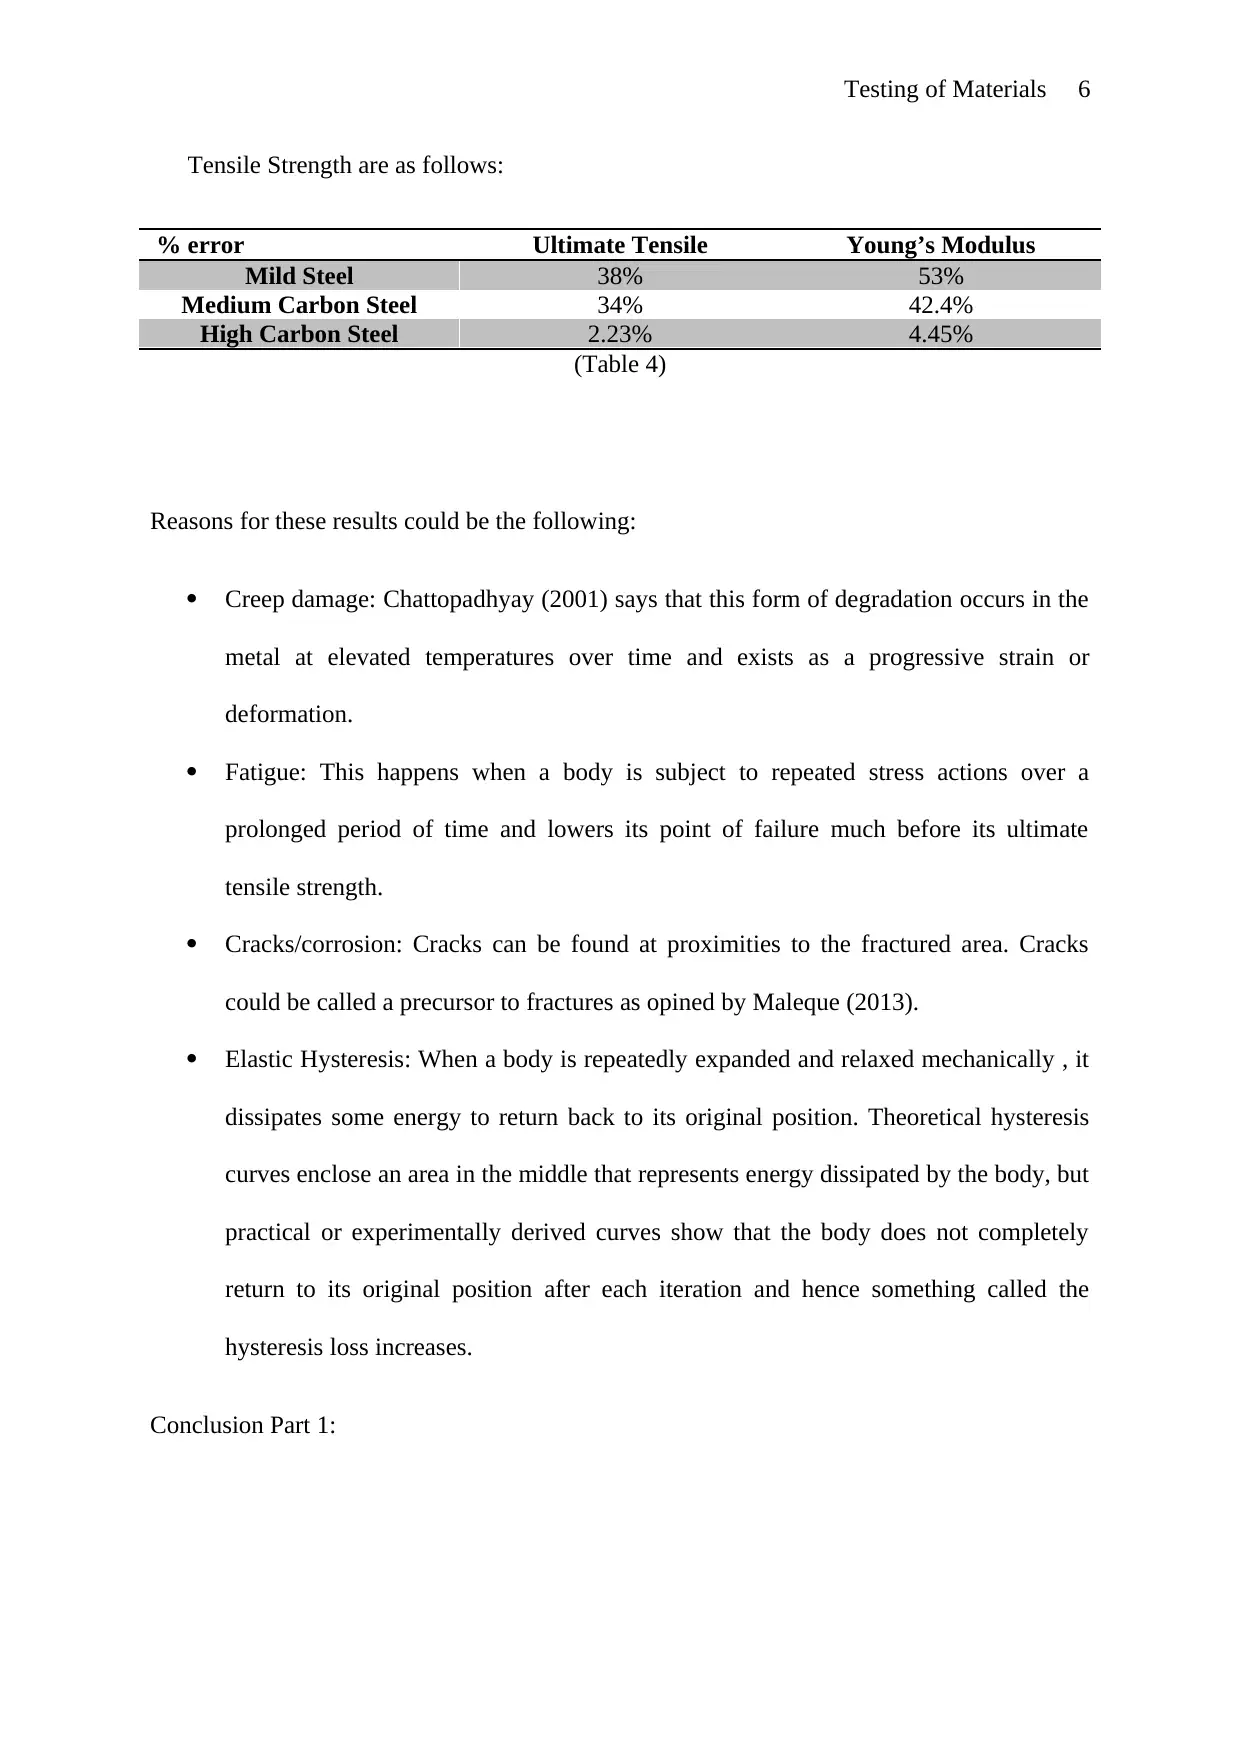
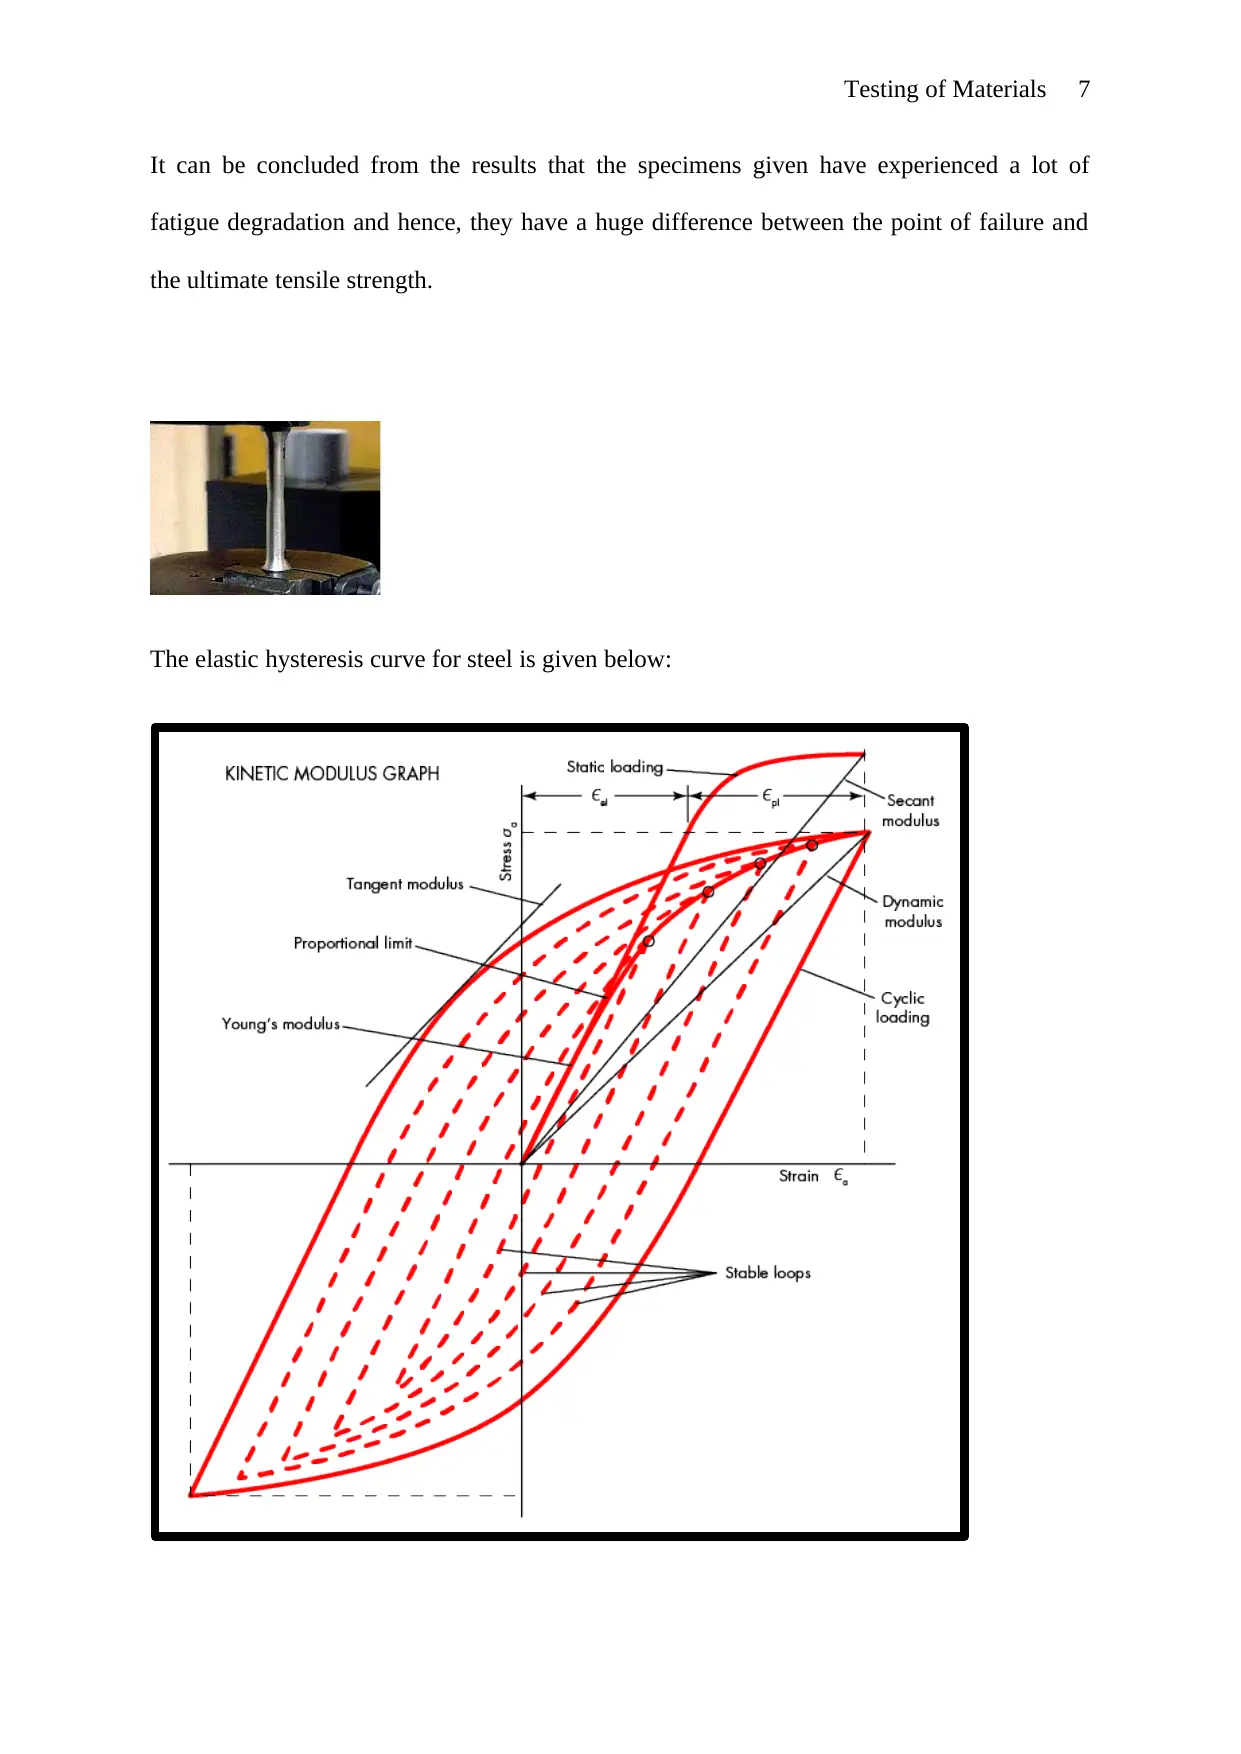
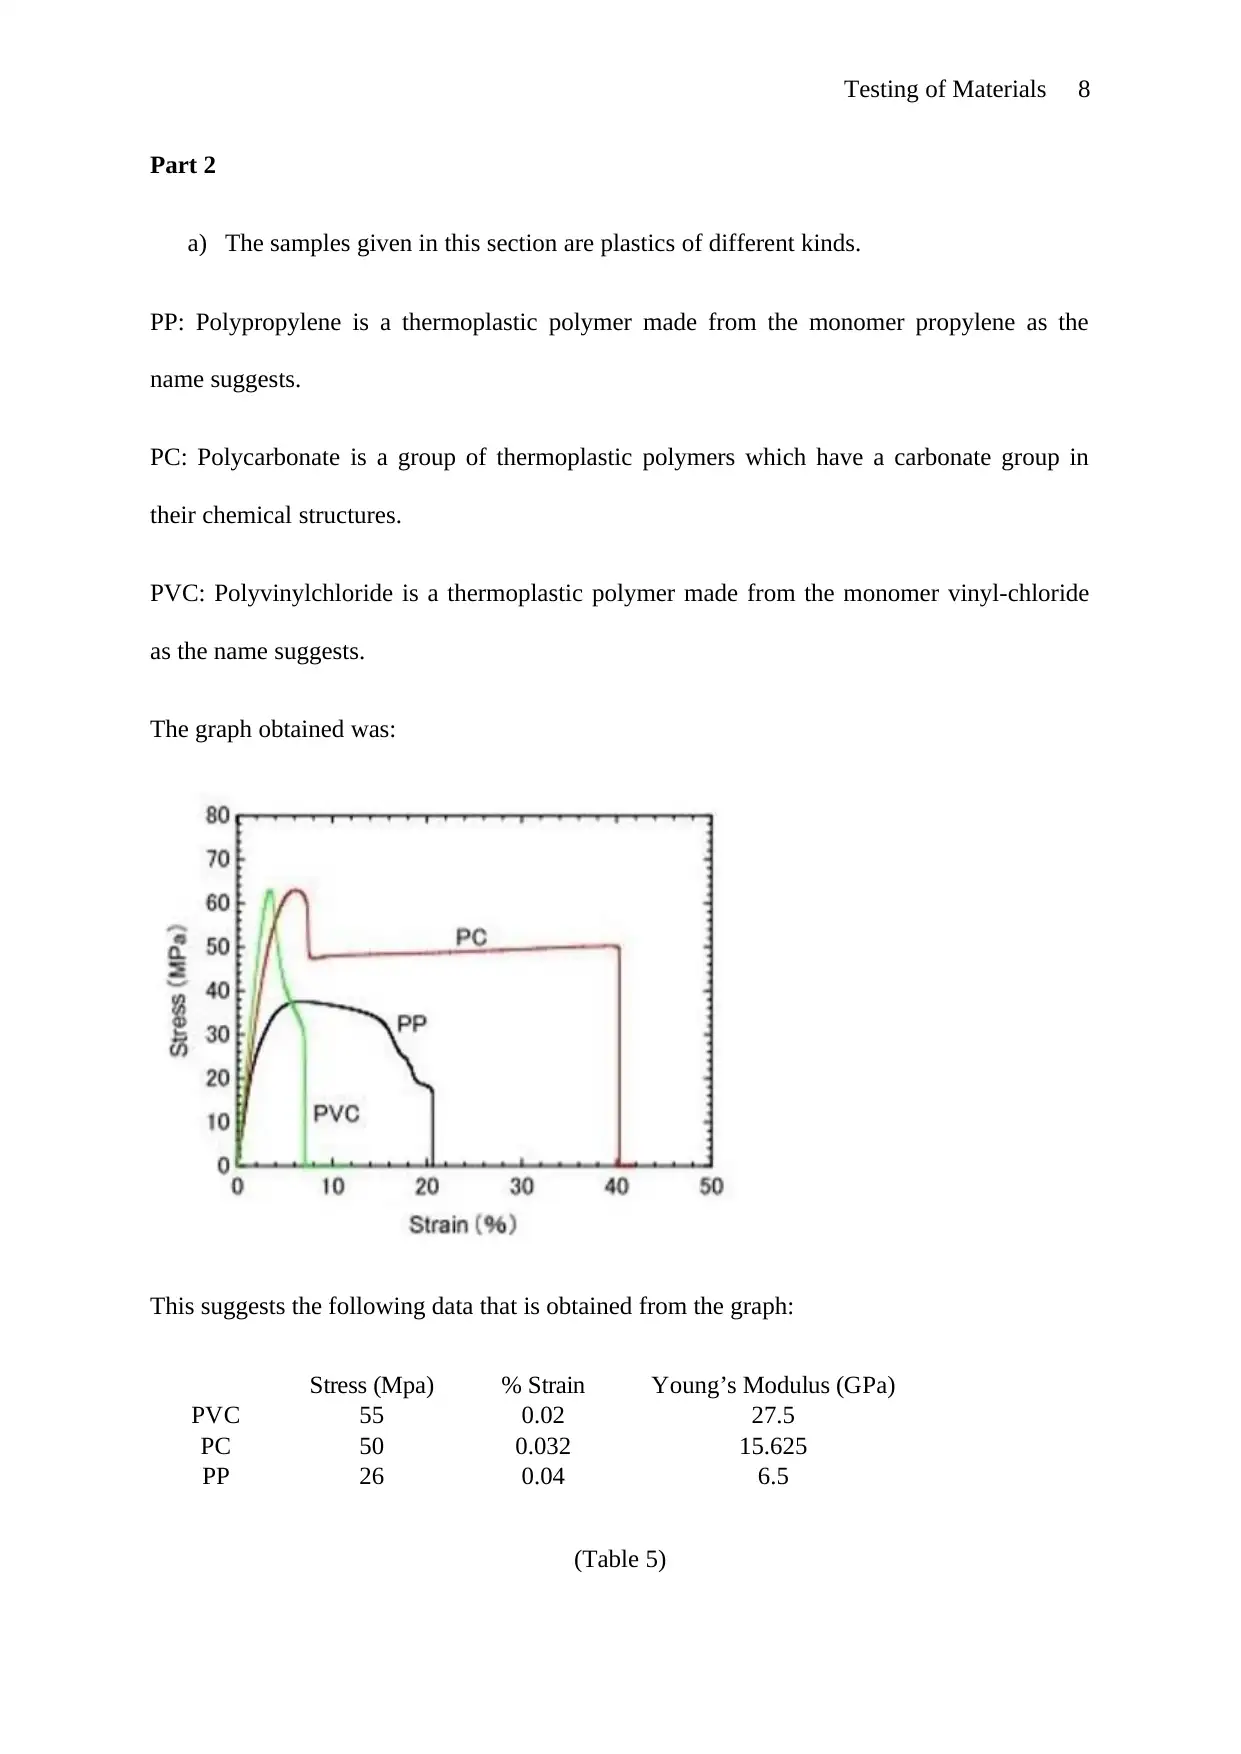
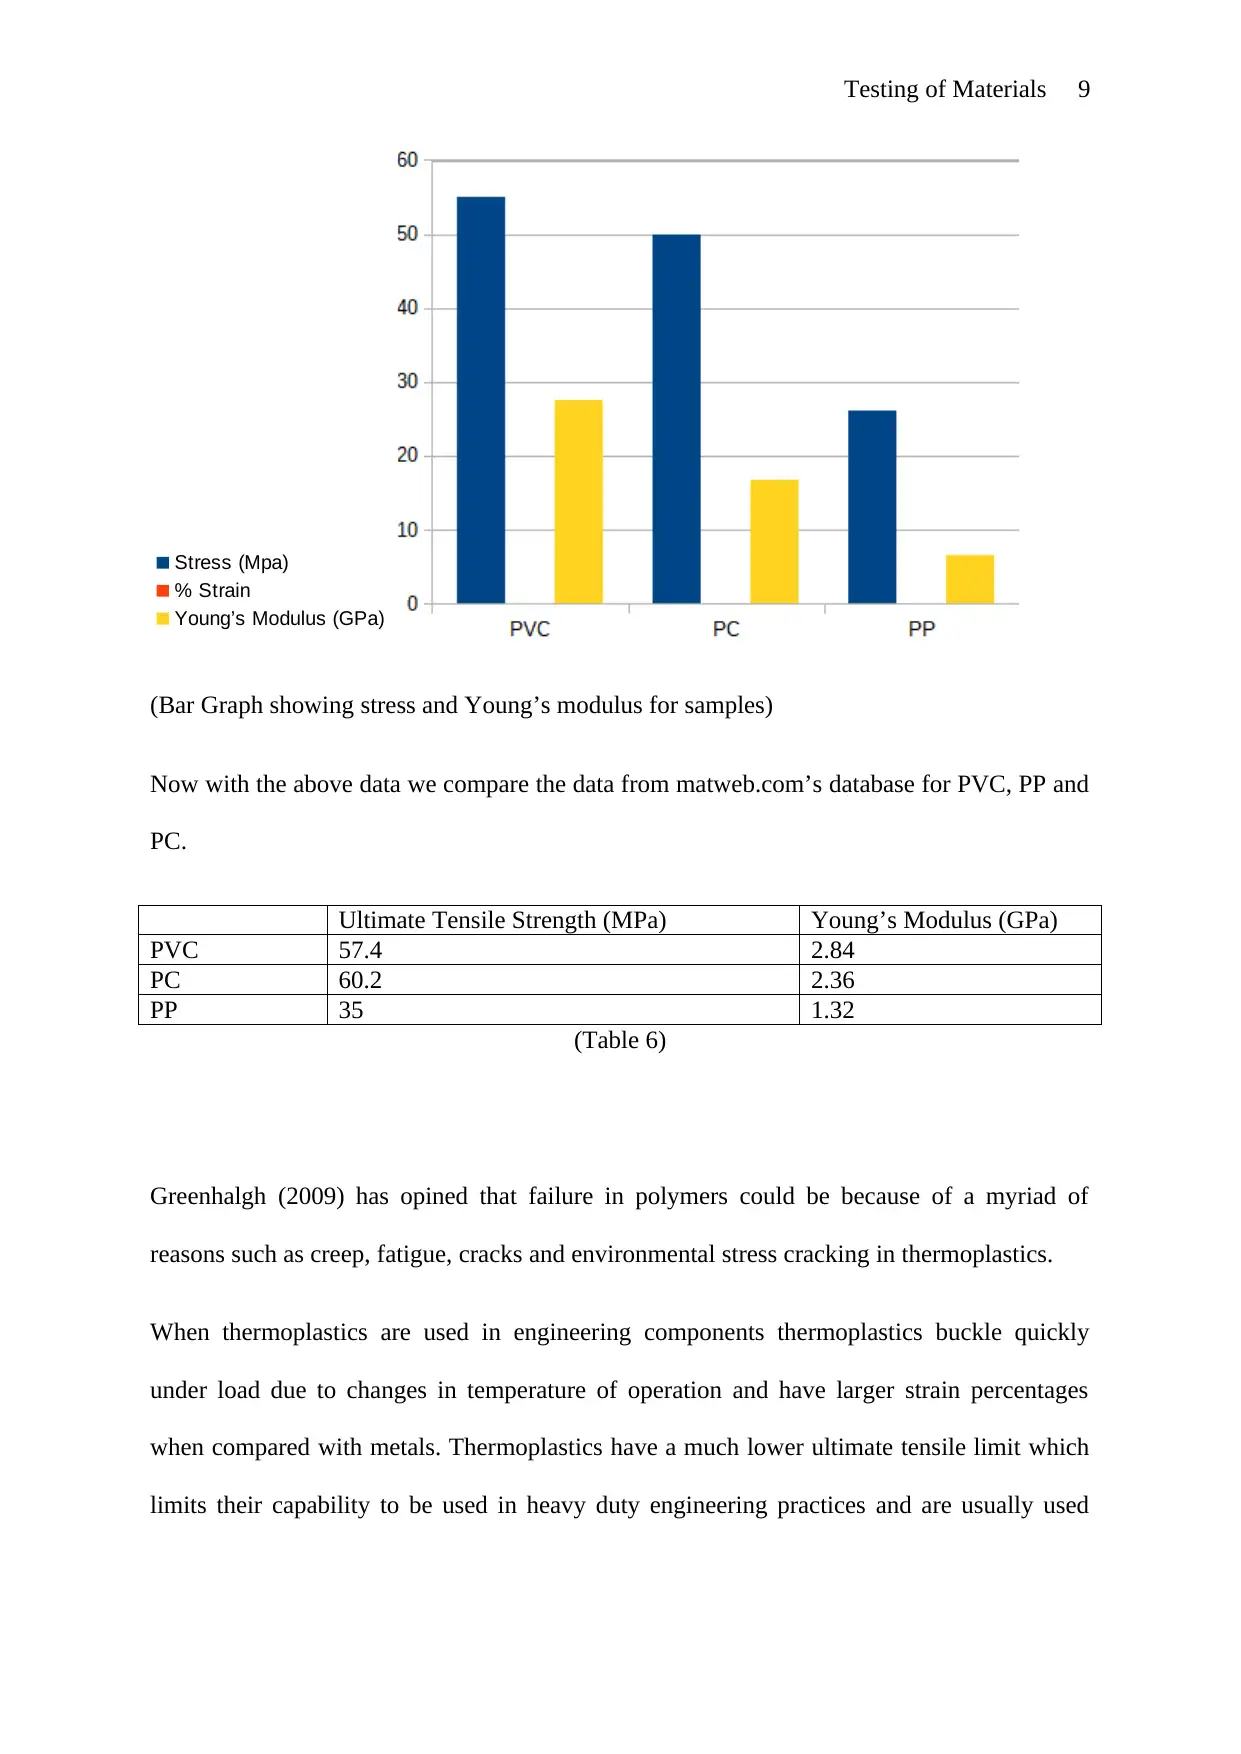
This lab report details the tensile testing of steel and plastic samples. The study includes the analysis of Mild Steel, Medium Carbon Steel, and High Carbon Steel, along with Polypropylene (PP), Polycarbonate (PC), and Polyvinylchloride (PVC). The report covers the calculation of Young's Modulus, Ultimate Tensile Strength, and the creation of stress-strain graphs. Percentage errors between experimental and theoretical values are calculated and discussed, considering factors like creep, fatigue, and cracking. The report also provides comparisons of material properties and discusses the degradation of plastics and metals under various conditions, including the effects of UV exposure, hoop stress, and cyclic loading. Additionally, the report explores the application of non-destructive and destructive testing methods.

Testing of Materials 1
Scientific Testing of Materials
Name of Student:
Name of University:
Author’s Note:
Scientific Testing of Materials
Name of Student:
Name of University:
Author’s Note:
Paraphrase This Document
Need a fresh take? Get an instant paraphrase of this document with our AI Paraphraser

Testing of Materials 2
Part 1
Objectives: To carry out testing on samples of steel with different percentages of carbon
using tensile testing equipment and present them graphically. To calculate Young’s Modulus
of given materials and verifying theoretical values graphically.
Lab Report:
We know that,
Young’s Modulus of Any Material (E) = Tensile Stress / Tensile Strain
Ultimate Tensile Strength (UTS) is σmax = Pmax /A0 , where Pmax is the load at failure and A0 is
the initial area before the necking phenomenon.
The Yield point (Yp) is the point where the deformation is permanent in the material which is
under a load. This means that the load causes the deformation to go from elastic to plastic.
The 3 samples of steel to be tested were Mild Steel ( 0.18% Carbon), Medium Carbon Steel
(0.41% Carbon) and High Carbon Steel (0.81% Carbon).
It is important to note that the prominence of the yield point decreases with the increase in
carbon percentage, that is, the yield point for High Carbon Steel is less prominent than the
other two samples as indicated graphically.
The samples were designed so as to conform to the requirements of standardized testing and
these specimens have a gage and 2 shoulders which can be gripped by the testing machine.
Tensile load is applied and readings are taken in accordance to the graph plotted after using
the testing machine that applies a continuous load on the specimen.

Testing of Materials 3
Stress vs Strain Graph
Hooke’s law says that the ratio of the stress and strain is a constant called the Young’s
Modulus. Therefore, E= Stress/ Strain. Using the parallel secant method, we try to find the
yield point in order to calculate the Young’s Modulus. The following diagram, the yellow
line denotes the line that runs parallel to the linear portion of the curve (secant) and therefore
we are able to calculate the proof stress. This method is mainly used for brittle materials.
(Stress Strain curve with proof stress)
⊘ This is a preview!⊘
Do you want full access?
Subscribe today to unlock all pages.

Trusted by 1+ million students worldwide

Testing of Materials 4
We use similar methods to calculate the proof stress and strain factors needed to calculate the
Young’s Modulus, and we get the data given in chart form below:
Stress (MPa) Strain
Mild Steel 2.995x10² 0.00318
Medium Carbon Steel 4.801x10² 0.00411
High Carbon Steel 8.137 x 10² 0.00740
(Table 1)
Ultimate Tensile Young’s Modulus
Mild Steel 469.8 MPa 94.1 GPa
Medium Carbon Steel 650.6 MPa 117 GPa
High Carbon Steel 987.5 MPa 110 GPa
(Table 2)
The correct SI unit for stress is Pascals (Pa) and is usually used in the order of Mega, as the
prefix, for Young’s Modulus however, the prefix Giga is used while the unit is Pascals. Strain
is a dimensionless quantity because it is the ratio of the change in length to the actual length
of the specimen. Pascal is the derived unit of pressure, and has the same dimensions as
pressure, N/mm2 in the SI system.
As with any method of testing precaution needs to be taken to ensure all factors are accounted
for while the testing takes place and does not interfere are contribute to the results. These
unwanted factors can be the result of faulty reading and a few have been categorized in this
section.
Axial misalignment – If the specimen is not correctly aligned with the grips of the
testing machine the tensile loading on the specimen will be uneven. This will result in
more stress being realised by an uneven cross-section and reflect poorly on the results.
Wrong grip choice or grip weight – A testing machine is designed to test hundreds if
not thousands of specimen of different classes and thus has different settings to
Paraphrase This Document
Need a fresh take? Get an instant paraphrase of this document with our AI Paraphraser

Testing of Materials 5
achieve the same. The correct grip must be chosen (threaded/ separated collar) for the
specimen at hand. Sometimes the weight of the grip itself is not taken into account
during calculations of the tensile load being added to the specimen, this too can affect
the overall loading effect and affect the end result of the testing.
Incorrect Loading – Loading the specimen onto the testing machine also requires
attention as an incorrectly loaded specimen with the wrong settings for the wrong
specimen can lead to undesirable forces being taken into the results from the testing.
Percentage error from calculated and theoretical values:
Having calculated the values using the testing machine and calculating the young’s
modulus, that there seems to be a good deal of difference between the values derived and
the standard values from matweb.com’s database.
Matwebs database shows that the following are the average values for Young’s Modulus
and Ultimate Tensile Strength.
Ultimate Tensile Young’s Modulus
Mild Steel 766 MPa 202 GPa
Medium Carbon Steel 987 MPa 203 GPa
High Carbon Steel 1010 MPa 198 GPa
(Table 3)
Percentage error can be calculated as:
(Theoretical Value – ActualValue)x 100/(Theoretical Value)
Therefore the percentage errors for the specimens under Young’s Modulus and Ultimate

Testing of Materials 6
Tensile Strength are as follows:
% error Ultimate Tensile Young’s Modulus
Mild Steel 38% 53%
Medium Carbon Steel 34% 42.4%
High Carbon Steel 2.23% 4.45%
(Table 4)
Reasons for these results could be the following:
Creep damage: Chattopadhyay (2001) says that this form of degradation occurs in the
metal at elevated temperatures over time and exists as a progressive strain or
deformation.
Fatigue: This happens when a body is subject to repeated stress actions over a
prolonged period of time and lowers its point of failure much before its ultimate
tensile strength.
Cracks/corrosion: Cracks can be found at proximities to the fractured area. Cracks
could be called a precursor to fractures as opined by Maleque (2013).
Elastic Hysteresis: When a body is repeatedly expanded and relaxed mechanically , it
dissipates some energy to return back to its original position. Theoretical hysteresis
curves enclose an area in the middle that represents energy dissipated by the body, but
practical or experimentally derived curves show that the body does not completely
return to its original position after each iteration and hence something called the
hysteresis loss increases.
Conclusion Part 1:
⊘ This is a preview!⊘
Do you want full access?
Subscribe today to unlock all pages.

Trusted by 1+ million students worldwide

Testing of Materials 7
It can be concluded from the results that the specimens given have experienced a lot of
fatigue degradation and hence, they have a huge difference between the point of failure and
the ultimate tensile strength.
The elastic hysteresis curve for steel is given below:
It can be concluded from the results that the specimens given have experienced a lot of
fatigue degradation and hence, they have a huge difference between the point of failure and
the ultimate tensile strength.
The elastic hysteresis curve for steel is given below:
Paraphrase This Document
Need a fresh take? Get an instant paraphrase of this document with our AI Paraphraser

Testing of Materials 8
Part 2
a) The samples given in this section are plastics of different kinds.
PP: Polypropylene is a thermoplastic polymer made from the monomer propylene as the
name suggests.
PC: Polycarbonate is a group of thermoplastic polymers which have a carbonate group in
their chemical structures.
PVC: Polyvinylchloride is a thermoplastic polymer made from the monomer vinyl-chloride
as the name suggests.
The graph obtained was:
This suggests the following data that is obtained from the graph:
Stress (Mpa) % Strain Young’s Modulus (GPa)
PVC 55 0.02 27.5
PC 50 0.032 15.625
PP 26 0.04 6.5
(Table 5)

Testing of Materials 9
Stress (Mpa)
% Strain
Young’s Modulus (GPa)
(Bar Graph showing stress and Young’s modulus for samples)
Now with the above data we compare the data from matweb.com’s database for PVC, PP and
PC.
Ultimate Tensile Strength (MPa) Young’s Modulus (GPa)
PVC 57.4 2.84
PC 60.2 2.36
PP 35 1.32
(Table 6)
Greenhalgh (2009) has opined that failure in polymers could be because of a myriad of
reasons such as creep, fatigue, cracks and environmental stress cracking in thermoplastics.
When thermoplastics are used in engineering components thermoplastics buckle quickly
under load due to changes in temperature of operation and have larger strain percentages
when compared with metals. Thermoplastics have a much lower ultimate tensile limit which
limits their capability to be used in heavy duty engineering practices and are usually used
⊘ This is a preview!⊘
Do you want full access?
Subscribe today to unlock all pages.

Trusted by 1+ million students worldwide

Testing of Materials 10
because of their cheaper cost of production, resistance to the action of rust unlike the
weakness of metals which are prone to oxidation, electrically insulative nature and so on.
b) We shall now look into the properties of high carbon steel, low carbon steel,
polyvinylchloride (PVC) and Polypropylene.
Before we begin examining the various outcomes of the data obtained on these materials, it is
important to understand toughness, which can be denoted as the energy absorbed by the
specimen before it gives into failure (yield point). This is the area under the stress-strain
curve till the yield point.
For high carbon steel, the higher percentage of carbon gives the material high strength but it
is not as tough, because its elongation is poor and it is too brittle, the necking phenomenon
occurs at a very high ultimate tensile strength too. This material is best used for rigid
structures that need to inhibit vibrations like the base of heavy vibrating machinery, and so
on.
Low carbon steel has high ductility and hence has good elongation according to the force
applied but yields too quickly at lower stresses and is not suitable for applications in high
tensile loading conditions.
PVC, being a thermoplastic polymer-plastic material has a transition from ductile to brittle
under cyclic loading, that is under repetitive loading the fatigue point gets easier to approach
with little stress applied. Hence plastics are at a disadvantage to metals in the area of handling
repetitive stress loading conditions.
Polypropylene is a thermoplastic which too has a transition from ductile to brittle under
cyclic loading and it has a much lower ultimate tensile strength when compared to PVC and
Paraphrase This Document
Need a fresh take? Get an instant paraphrase of this document with our AI Paraphraser

Testing of Materials 11
has a weaker yield point. Polypropylene has a higher percentage elongation for a given stress
and hence can be considered to be more ductile.
(Gradual change from ductile to brittle in thermoplastics, Titow (2012))
As such, thermoplastics have different applications in comparison with carbon-steel
materials, they are more ductile and have a lower cost of manufacturing. Thermoplastics
deform by elongation to a point where they experience shear fracture or cleavage fracture via
necking where the load per cross-sectional area increases and then the material fractures.
Metals on the other hand have in comparison smaller elongation and fracture due to
propagation of cracks which happens as a result of void nucleation in ductile and propagation
of existing cracks in brittle materials.
c) Non-destructive tests are performed on the principle of preserving the sample for
further use and hence these tests don’t employ high values of force. Destructive tests
are ones where load is applied on the work piece. Non-destructive tests use methods
such as visual inspection, ultrasonic testing, and eddy current testing and so on to
determine the properties of the metal.

Testing of Materials 12
⊘ This is a preview!⊘
Do you want full access?
Subscribe today to unlock all pages.

Trusted by 1+ million students worldwide
1 out of 16
Related Documents
Your All-in-One AI-Powered Toolkit for Academic Success.
+13062052269
info@desklib.com
Available 24*7 on WhatsApp / Email
Unlock your academic potential
Copyright © 2020–2025 A2Z Services. All Rights Reserved. Developed and managed by ZUCOL.


