Math 1070: Spreadsheet Project Statistical Analysis Report
VerifiedAdded on 2022/08/25
|5
|377
|13
Practical Assignment
AI Summary
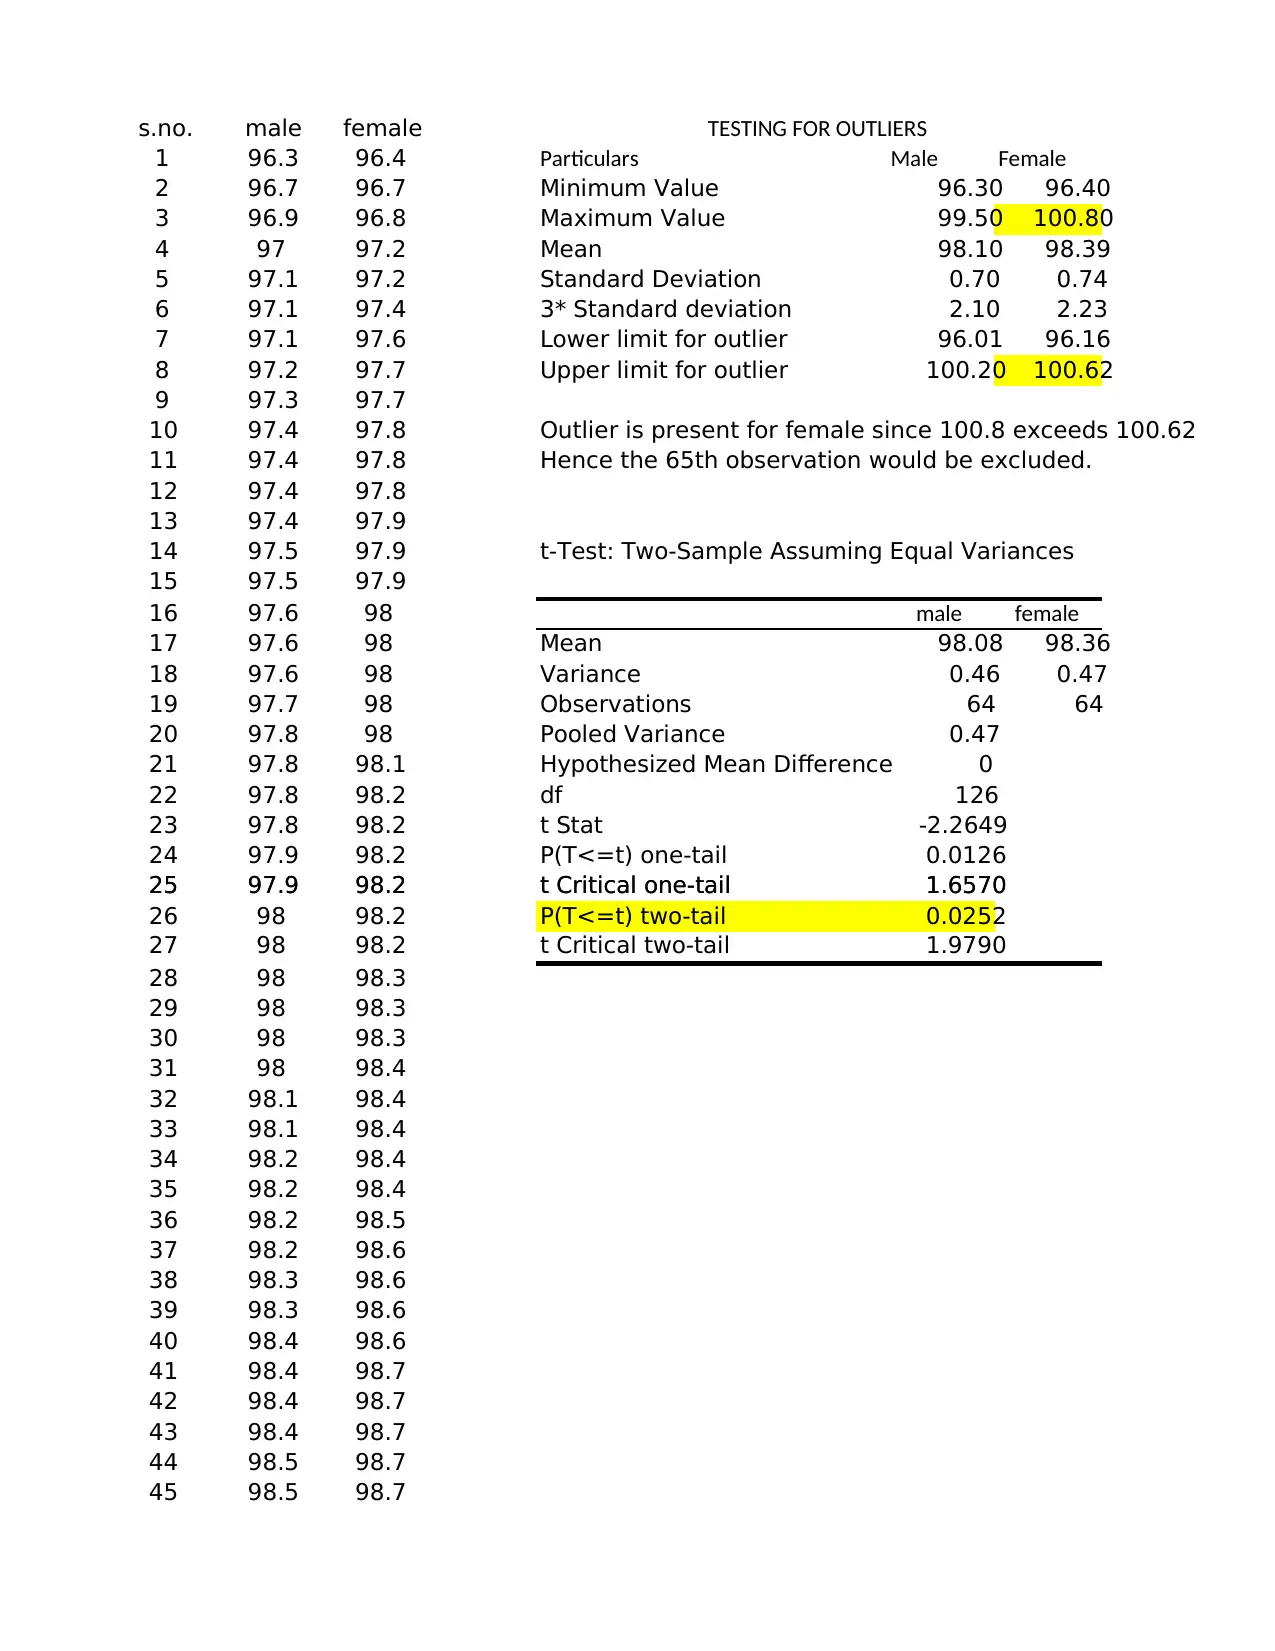
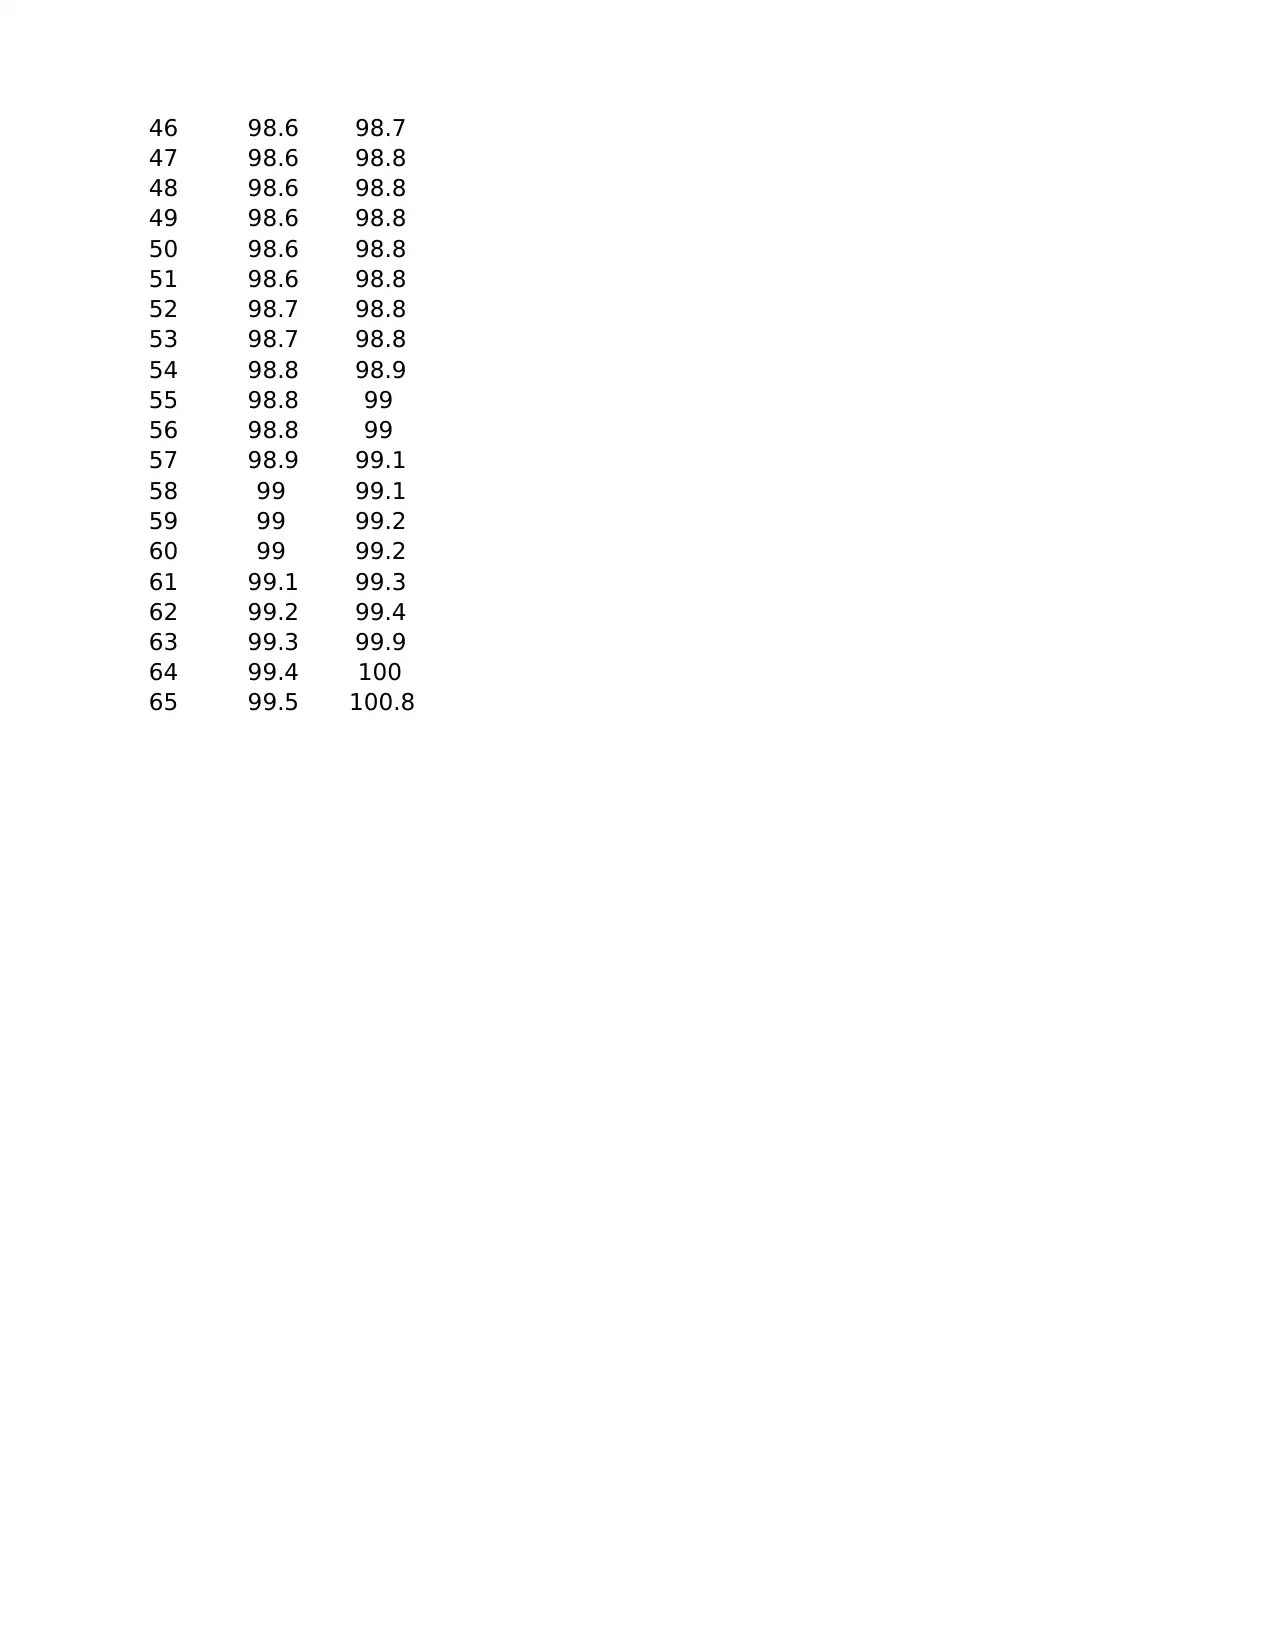
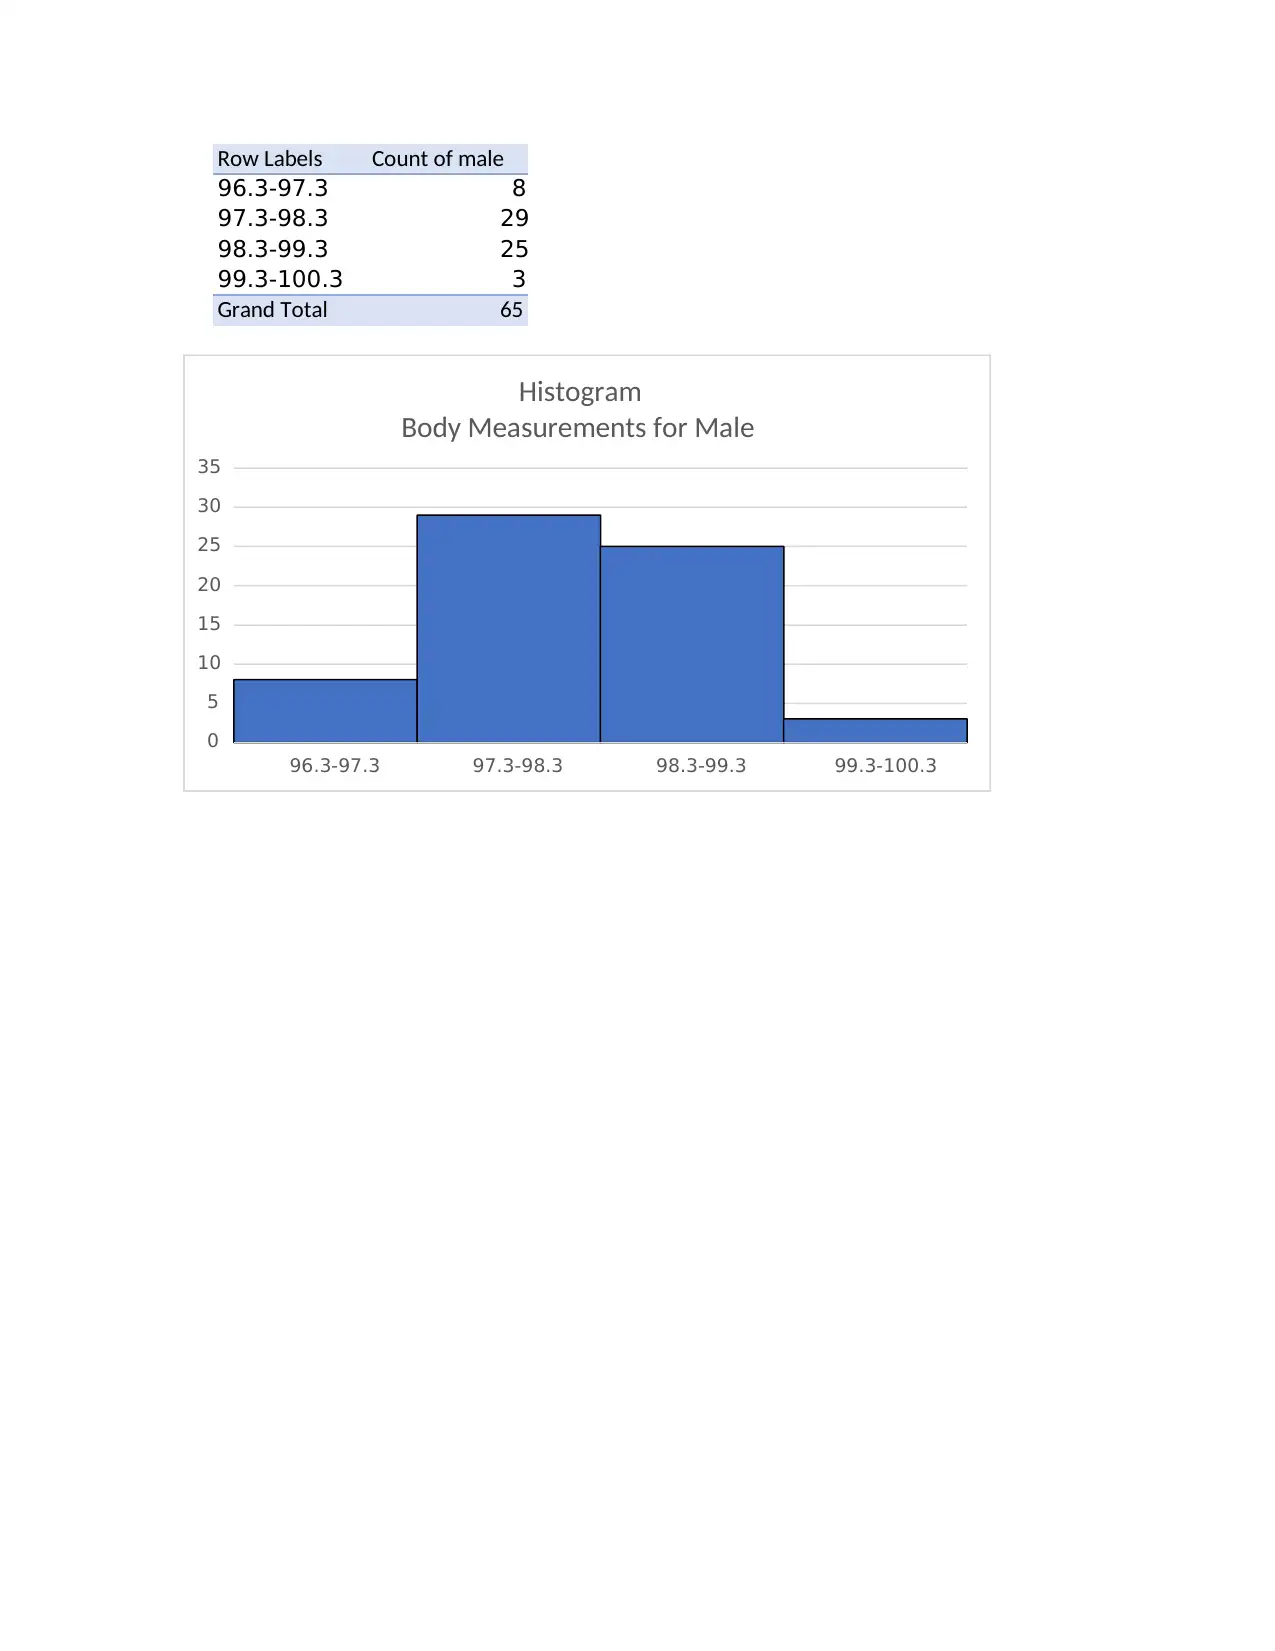
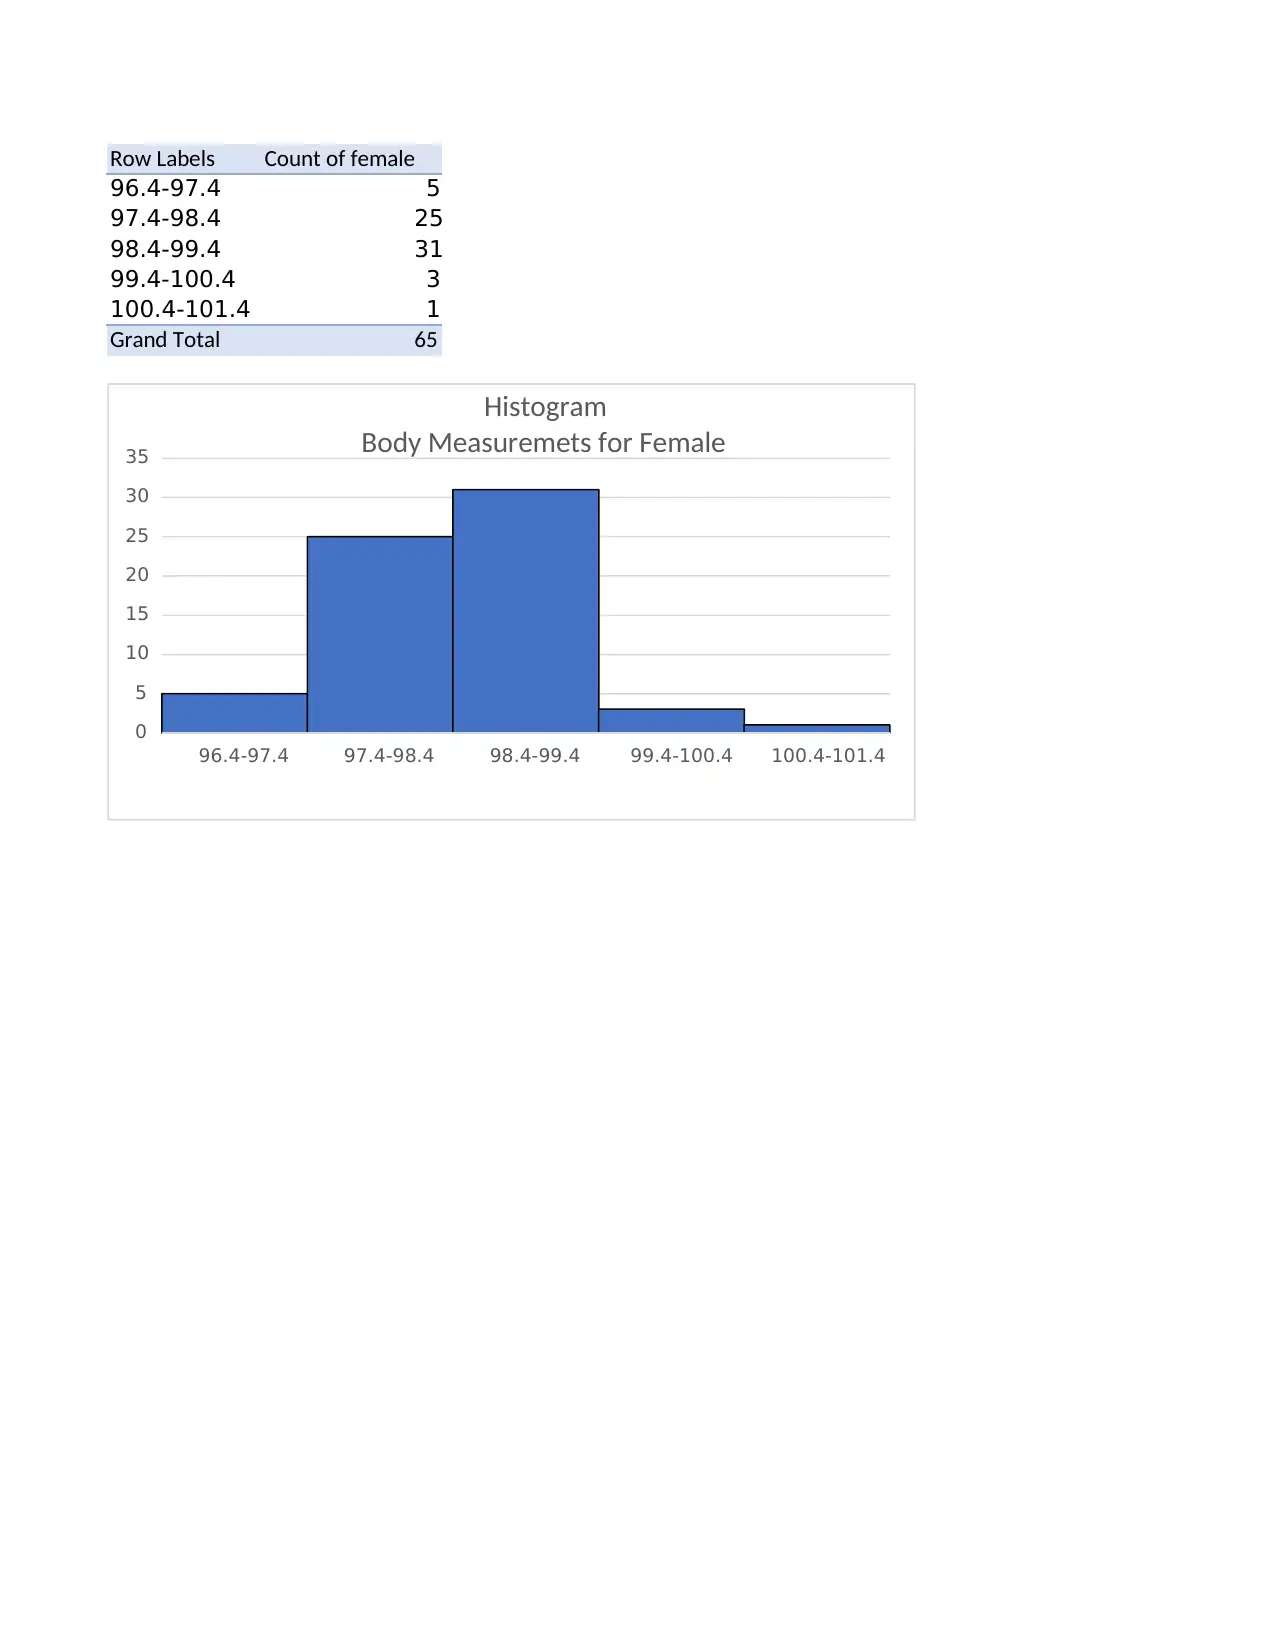
This assignment analyzes a spreadsheet project likely from a Math 1070 course, focusing on statistical analysis and data interpretation. The project involves analyzing two datasets, presumably representing male and female body measurements. The analysis includes calculating descriptive statistics such as minimum, maximum, mean, and standard deviation. Outlier detection is performed, identifying a potential outlier in the female dataset. A t-test is conducted to compare the means of the two groups. Histograms are generated to visualize the distribution of the data for both males and females. The solution demonstrates the application of statistical concepts and the use of spreadsheet software for data analysis, including calculations, graphing, and interpretation of results. The document serves as a practical example of statistical analysis, offering insights into data characteristics, comparisons, and potential outliers, as well as providing a breakdown of the steps followed in the analysis.

1 out of 5

Your All-in-One AI-Powered Toolkit for Academic Success.
+13062052269
info@desklib.com
Available 24*7 on WhatsApp / Email
![[object Object]](/_next/static/media/star-bottom.7253800d.svg)
Copyright © 2020–2026 A2Z Services. All Rights Reserved. Developed and managed by ZUCOL.