Math 2218 Assignment 2: Confidence Intervals and Sample Size

Verified

Added on  2022/11/12

|9
|655
|192
Homework Assignment
AI Summary
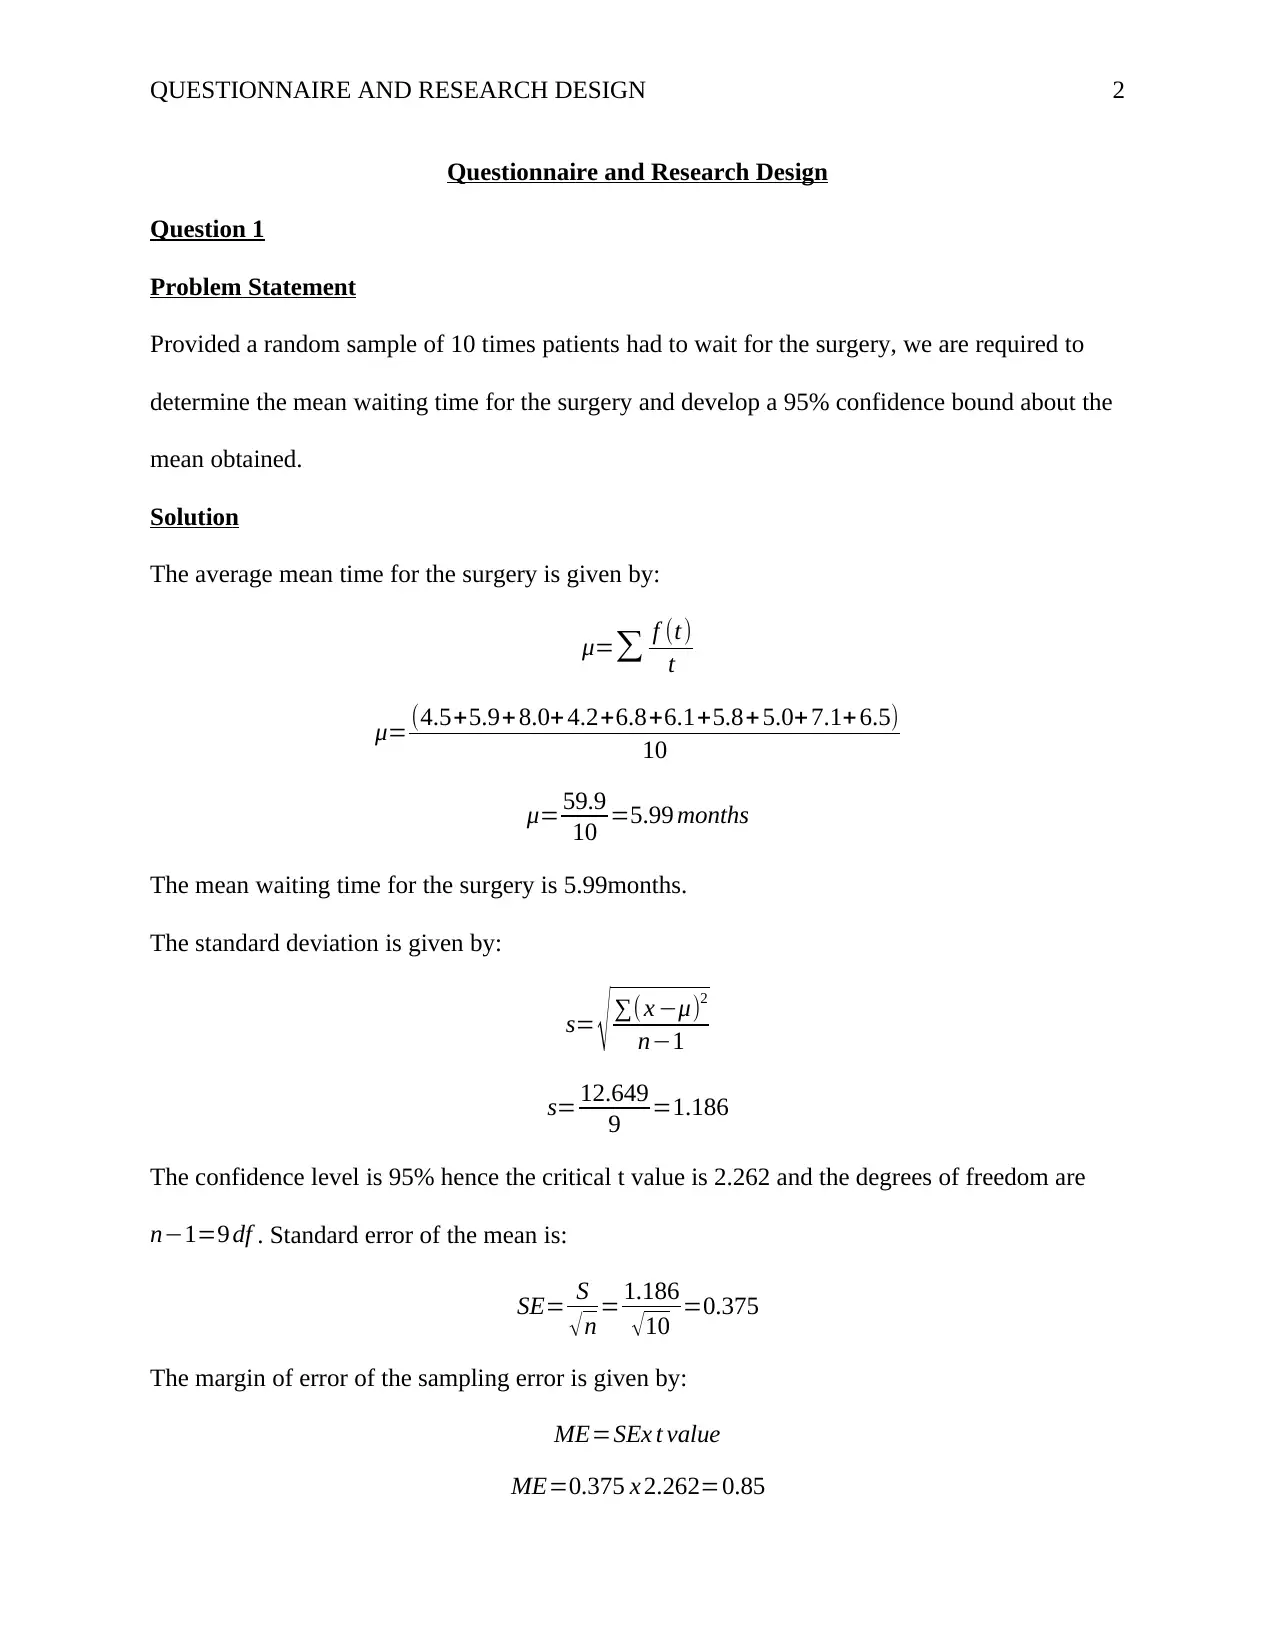
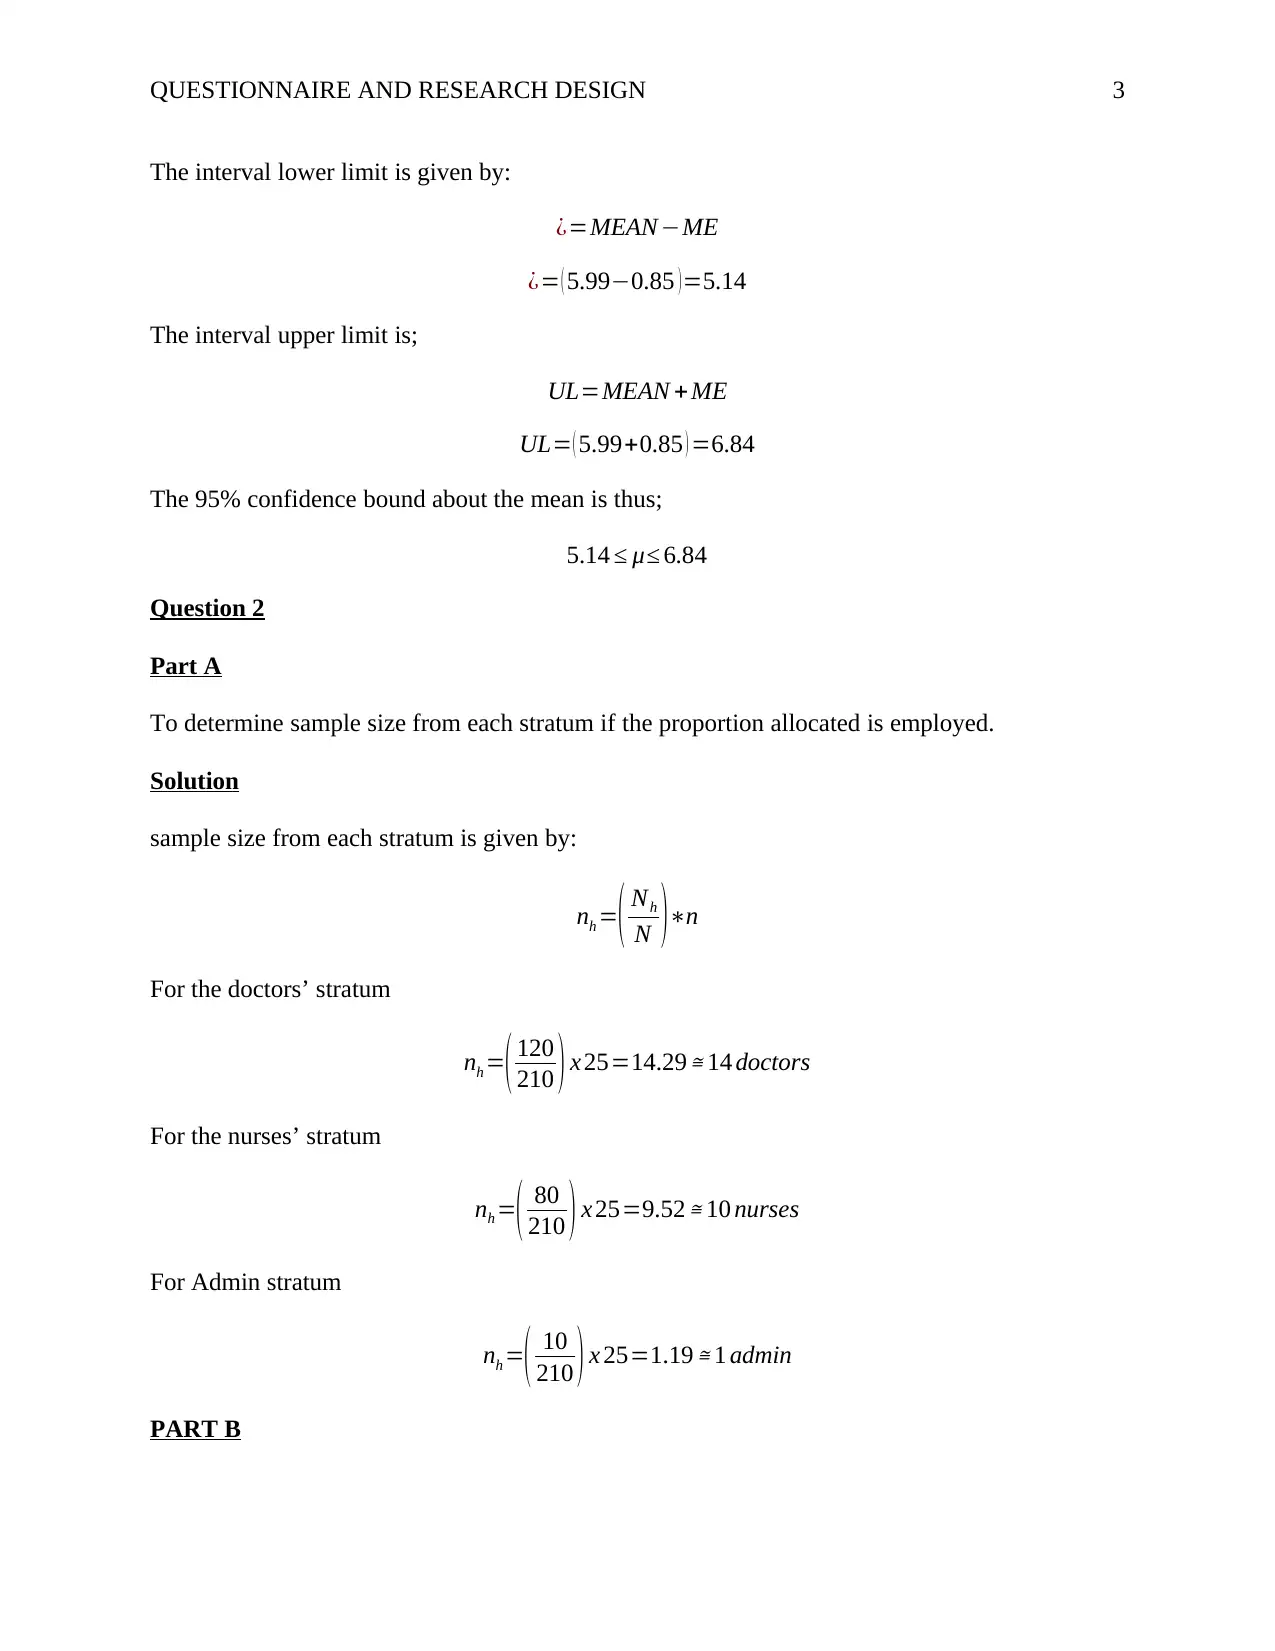
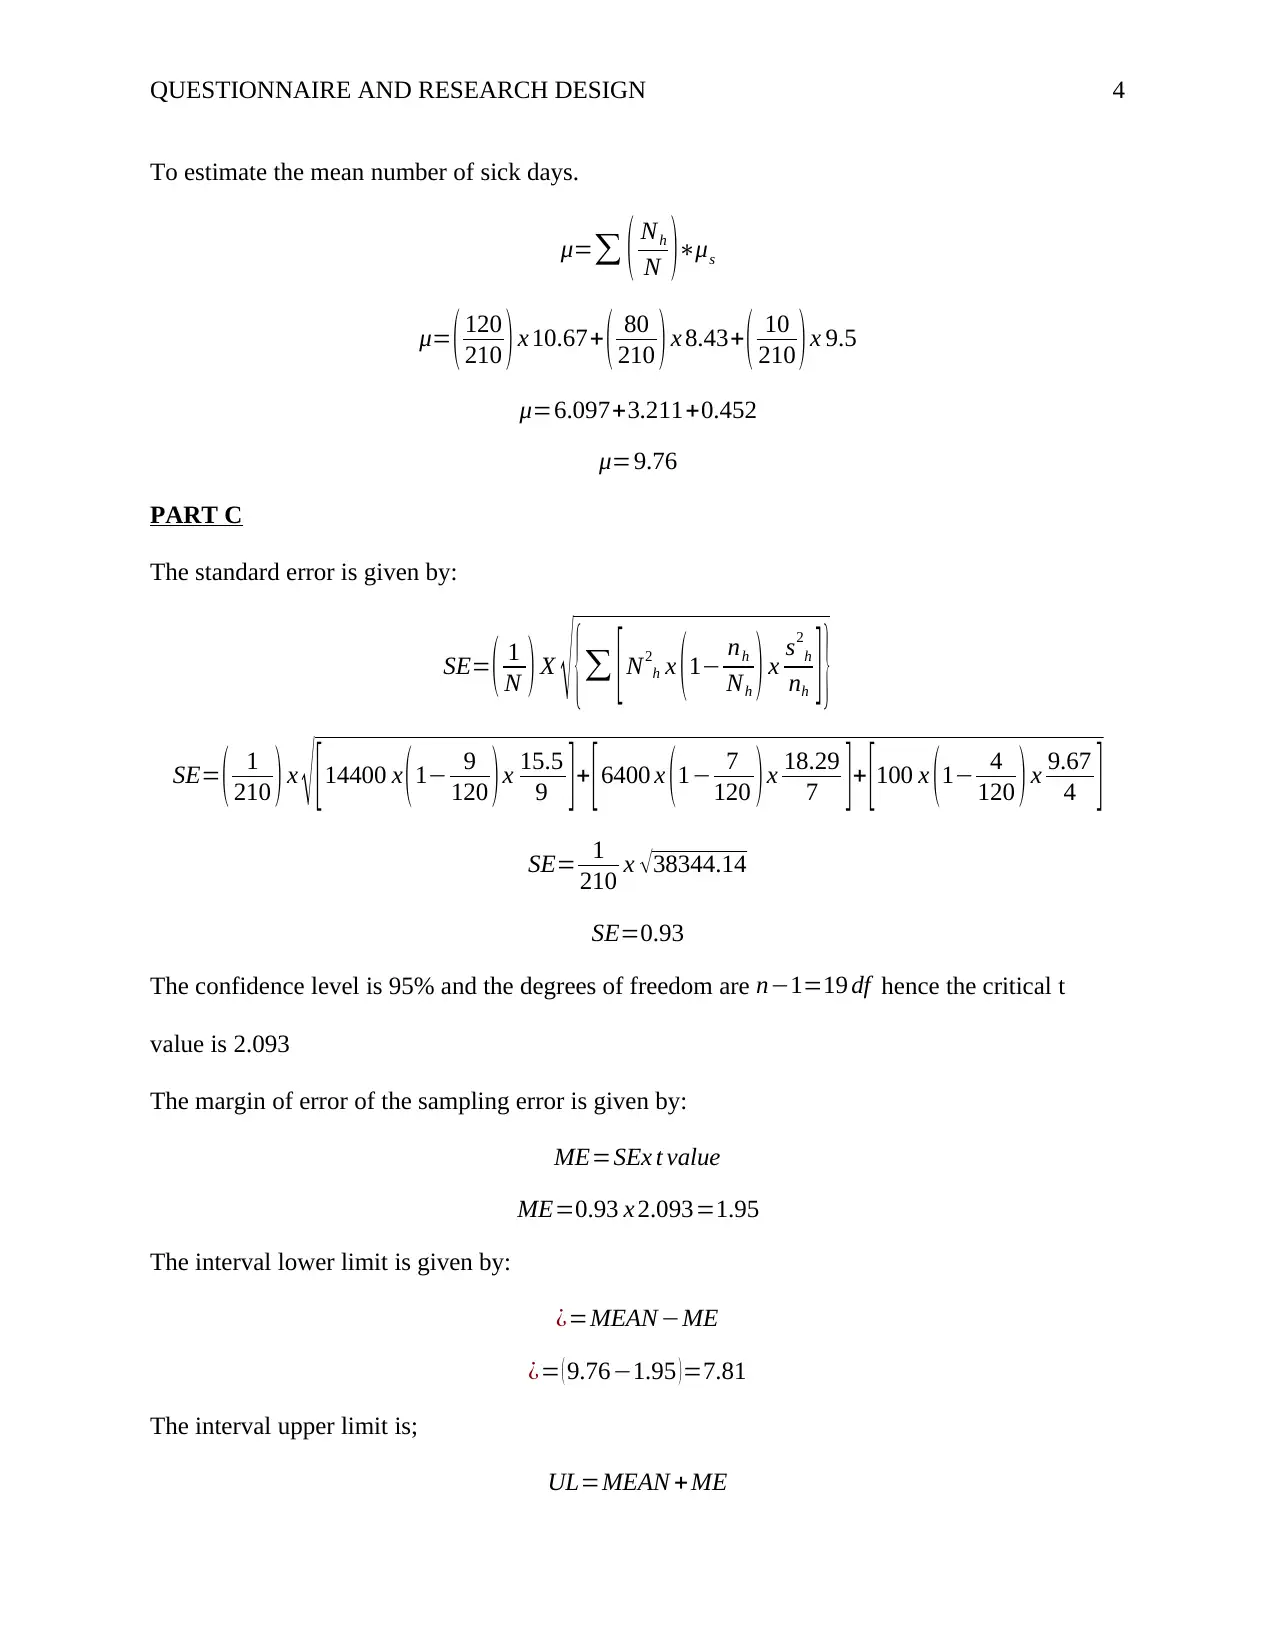
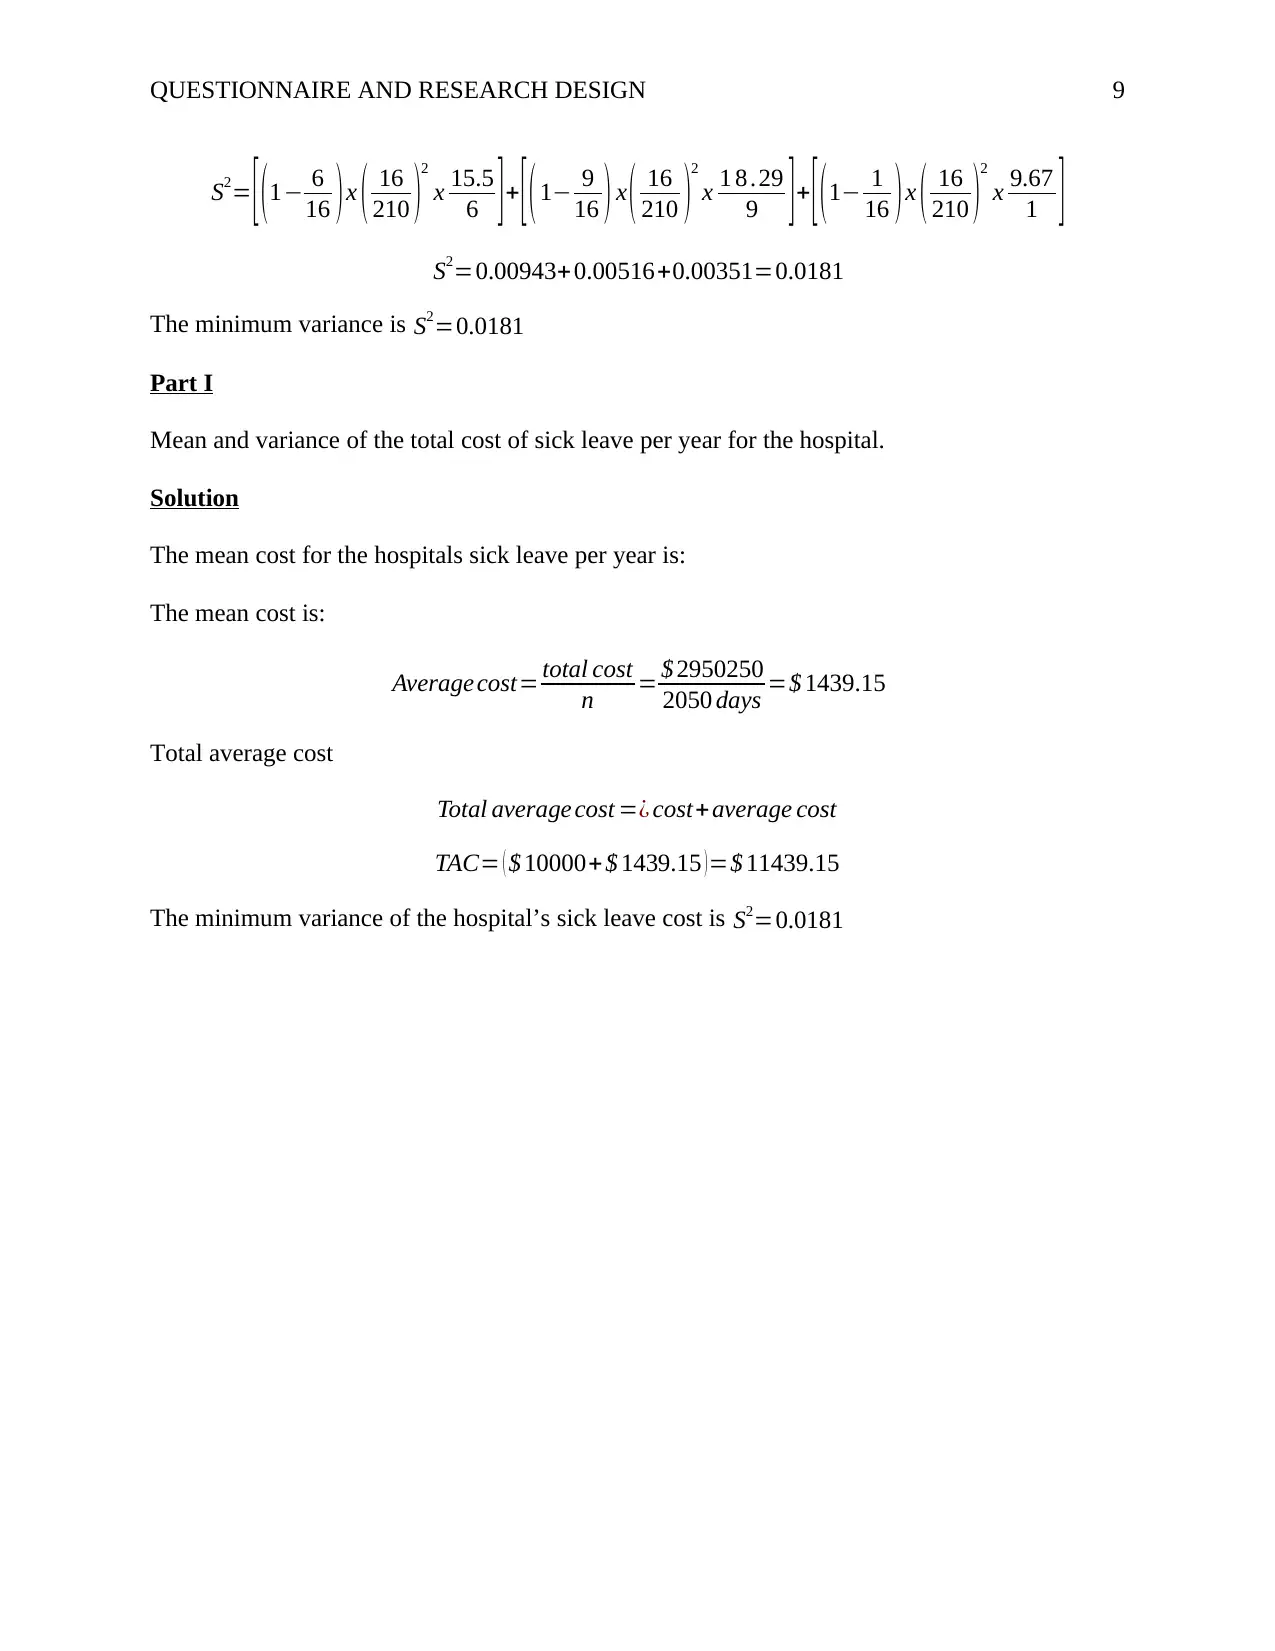
This document presents the solutions to Math 2218 Assignment 2, focusing on statistical sampling and analysis. The assignment addresses two main problems: estimating the mean waiting time for surgery in a public hospital using a simple random sample and determining a 95% confidence bound, and estimating the average number of sick days in a hospital using stratified random sampling. The solutions include calculations for mean, standard deviation, confidence intervals, and sample size determination for each stratum. The document also addresses estimating the total number of sick days and the mean cost of sick leave, along with their respective confidence bounds. Furthermore, it explores optimal sample allocation to minimize variance and calculates the minimum variance. Finally, it provides the mean and variance of the total cost of sick leave per year.
Document Page
Running head: QUESTIONNAIRE AND RESEARCH DESIGN 1
Questionnaire and Research Design
Student Name
Professor’s Name
University Name
Date
tabler-icon-diamond-filled.svg

Paraphrase This Document

Need a fresh take? Get an instant paraphrase of this document with our AI Paraphraser
Document Page
QUESTIONNAIRE AND RESEARCH DESIGN 2
Questionnaire and Research Design
Question 1
Problem Statement
Provided a random sample of 10 times patients had to wait for the surgery, we are required to
determine the mean waiting time for the surgery and develop a 95% confidence bound about the
mean obtained.
Solution
The average mean time for the surgery is given by:
μ= f (t)
t
μ= (4.5+5.9+ 8.0+ 4.2+6.8+6.1+5.8+ 5.0+ 7.1+ 6.5)
10
μ= 59.9
10 =5.99 months
The mean waiting time for the surgery is 5.99months.
The standard deviation is given by:
s= (x μ)2
n1
s= 12.649
9 =1.186
The confidence level is 95% hence the critical t value is 2.262 and the degrees of freedom are
n1=9 df . Standard error of the mean is:
SE= S
n = 1.186
10 =0.375
The margin of error of the sampling error is given by:
ME=SEx t value
ME=0.375 x 2.262=0.85
Document Page
QUESTIONNAIRE AND RESEARCH DESIGN 3
The interval lower limit is given by:
¿=MEAN ME
¿= ( 5.990.85 )=5.14
The interval upper limit is;
UL=MEAN + ME
UL= ( 5.99+0.85 ) =6.84
The 95% confidence bound about the mean is thus;
5.14 μ 6.84
Question 2
Part A
To determine sample size from each stratum if the proportion allocated is employed.
Solution
sample size from each stratum is given by:
nh =( Nh
N )n
For the doctors’ stratum
nh =( 120
210 ) x 25=14.29 14 doctors
For the nurses’ stratum
nh =( 80
210 ) x 25=9.52 10 nurses
For Admin stratum
nh =( 10
210 ) x 25=1.19 1 admin
PART B
Document Page
QUESTIONNAIRE AND RESEARCH DESIGN 4
To estimate the mean number of sick days.
μ= ( Nh
N )μs
μ= ( 120
210 ) x 10.67+ ( 80
210 ) x 8.43+ ( 10
210 ) x 9.5
μ=6.097+3.211+0.452
μ=9.76
PART C
The standard error is given by:
SE= ( 1
N ) X { [N2
h x (1 nh
Nh ) x s2
h
nh ] }
SE= ( 1
210 ) x [ 14400 x ( 1 9
120 ) x 15.5
9 ] + [ 6400 x ( 1 7
120 ) x 18.29
7 ] + [ 100 x ( 1 4
120 ) x 9.67
4 ]
SE= 1
210 x 38344.14
SE=0.93
The confidence level is 95% and the degrees of freedom are n1=19 df hence the critical t
value is 2.093
The margin of error of the sampling error is given by:
ME=SEx t value
ME=0.93 x 2.093=1.95
The interval lower limit is given by:
¿=MEAN ME
¿= ( 9.761.95 )=7.81
The interval upper limit is;
UL=MEAN + ME
tabler-icon-diamond-filled.svg

Paraphrase This Document

Need a fresh take? Get an instant paraphrase of this document with our AI Paraphraser
Document Page
QUESTIONNAIRE AND RESEARCH DESIGN 5
UL= ( 9.76+1.95 )=11.71
The 95% confidence bound about the mean is thus;
7.81 μ 11.71
Part D
To estimate the total number of sick days for the year.
Solution
The total number of sick days for the year for the whole population is given by:
t= Nh x μh
t= ( 120 x 10.67 )+ ( 80 x 8.43 ) +(10 x 9.5)
t=2049.8 days 2050 days
All the personnel in the hospital combined have sick days equivalent to 2049.8days.
PART E
Placing a bound on the total number of staff sick days and interpreting the results.
Solution
The standard error is given by:
SE= [ N 2
h x ( 1 nh
Nh ) x S2
h
nh ]
SE=
{[ [1202 X (1 9
120 ) X 15.5
9 ]+
[802 X (1 7
80 ) X 18.29
7 ]+ [102 X (1 4
10 ) X 9.67
4 ] ] }
SE= 38344.14
SE=195.82
The confidence interval is 95%, the degrees of freedom (19df). The critical value of t for the
confidence interval and the degrees of freedom is 2.093. The margin of error is given by:
ME=SEx t value
Document Page
QUESTIONNAIRE AND RESEARCH DESIGN 6
ME=195.82 x 2.093=409.85
The interval lower limit is given by:
¿=daysME
¿= ( 2049.8409.85 )=1639.95 days 1640 days
The interval upper limit is;
UL=days + ME
UL= ( 2049.8+409.85 )=2459.65 days 2460 days
The 95% confidence bound about the days is thus;
1640 days t 2460 days
PART F
To estimate the mean cost of sick leave for the hospital.
Solution
Total cost of replacing the staff during sick leaves.
Cost = ( 120 x 10.67 x 2000 ) + ( 80 x 8.43 x 500 ) +( 10 x 9.5 x 550)
cost=$ 2950250
The mean cost is:
Average cost= total cost
n = $ 2950250
2050 days =$ 1439.15
Total average cost
Total average cost =¿ cost+average cost
TAC= ( $ 10000+ $ 1439.15 ) =$ 11439.15
Part G
Solution
Placing a bound on the mean cost of sick Leave in the hospital.
The lower limit of the average cost is given by:
Document Page
QUESTIONNAIRE AND RESEARCH DESIGN 7
Total average cost
upper bound of days = $ 2950250
2460 days =$ 1199.30
The upper limit of the cost is given by:
Total averagecost
lower bound of days = $ 2950250
1640 days =$ 1798.93
Including the $10000 fixed cost, the bound becomes:
$ 11199.30 Average cost $ $ 11798.93
Part H
Estimating the size of stratified sample n that minimize the variance
Solution
For optimal allocation
nh =
( Nh Sh
Ch
Ni Si
Ci
)n
While the variance is:
S2= ( 1 nh
Nh ) ( Nh
N ) 2 S2
h
nh
Solving for n gives:
n= ( Nh Sh
Ch ) ( Nh Sh Ch )
N2 D+ Nh S2
h
The standard deviations for doctor =3.937, for nurses =4.277, for admin=3.110.
The value of
( Nh Sh
Ch )= [ 120 x 3.937
2000 ] + [ 80 x 4.277
500 ] + [ 10 x 3.110
550 ]
tabler-icon-diamond-filled.svg

Paraphrase This Document

Need a fresh take? Get an instant paraphrase of this document with our AI Paraphraser
Document Page
QUESTIONNAIRE AND RESEARCH DESIGN 8
( Nh Sh
Ch )=29.192
( N h Sh Ch ) = ( 120 x 3.937 x 2000 ) + ( 80 x 4.277 x 500 ) +(120 x 3. 11 x 550)
( N h Sh Ch ) =28900.24
N h S2
h= ( 120 x 15.5 ) + ( 80 x 18.29 ) + ( 10 x 9.67 ) =4786.4
Thus, solving for n:
28900.24 X 27.192
( 210 ) 2 + 4786.4 =16 individuals
Hence the stratified sample size should have 16 individuals.
The number of individuals in each stratum is given by:
n1=
( Nh Sh
Ch
N i Si
Ci
)n=16 [ 120 x 3.937
44.72
27.192 ]=6.2 6 doctors
n2 =
( Nh Sh
Ch
N i Si
Ci
)n=16 [ 80 x 4.277
22.36
2 7.192 ]=9.00 9 nurses
n3 =
( Nh Sh
Ch
N i Si
Ci
)n=16 [ 10 x 3.11
23.45
27.192 ]=0.78 1 admn
Hence, each stratum should have 6doctors, 9 nurses and 1 administrator so that the variance can
be minimized.
Minimum variance is given by:
S2= ( 1 nh
Nh ) ( Nh
N ) 2 S2
h
nh
Document Page
QUESTIONNAIRE AND RESEARCH DESIGN 9
S2= [ ( 1 6
16 ) x ( 16
210 )
2
x 15.5
6 ] + [ ( 1 9
16 ) x ( 16
210 )
2
x 1 8 .29
9 ] + [ ( 1 1
16 ) x ( 16
210 )
2
x 9.67
1 ]
S2=0.00943+0.00516+0.00351=0.0181
The minimum variance is S2=0.0181
Part I
Mean and variance of the total cost of sick leave per year for the hospital.
Solution
The mean cost for the hospitals sick leave per year is:
The mean cost is:
Average cost= total cost
n = $ 2950250
2050 days =$ 1439.15
Total average cost
Total average cost =¿ cost+average cost
TAC= ( $ 10000+ $ 1439.15 ) =$ 11439.15
The minimum variance of the hospital’s sick leave cost is S2=0.0181
chevron_up_icon
1 out of 9
circle_padding
hide_on_mobile
zoom_out_icon
[object Object]