MATH 230 Take-Home Final Examination: Statistical Reasoning

Verified

Added on  2022/09/06

|8
|852
|16
Homework Assignment
AI Summary
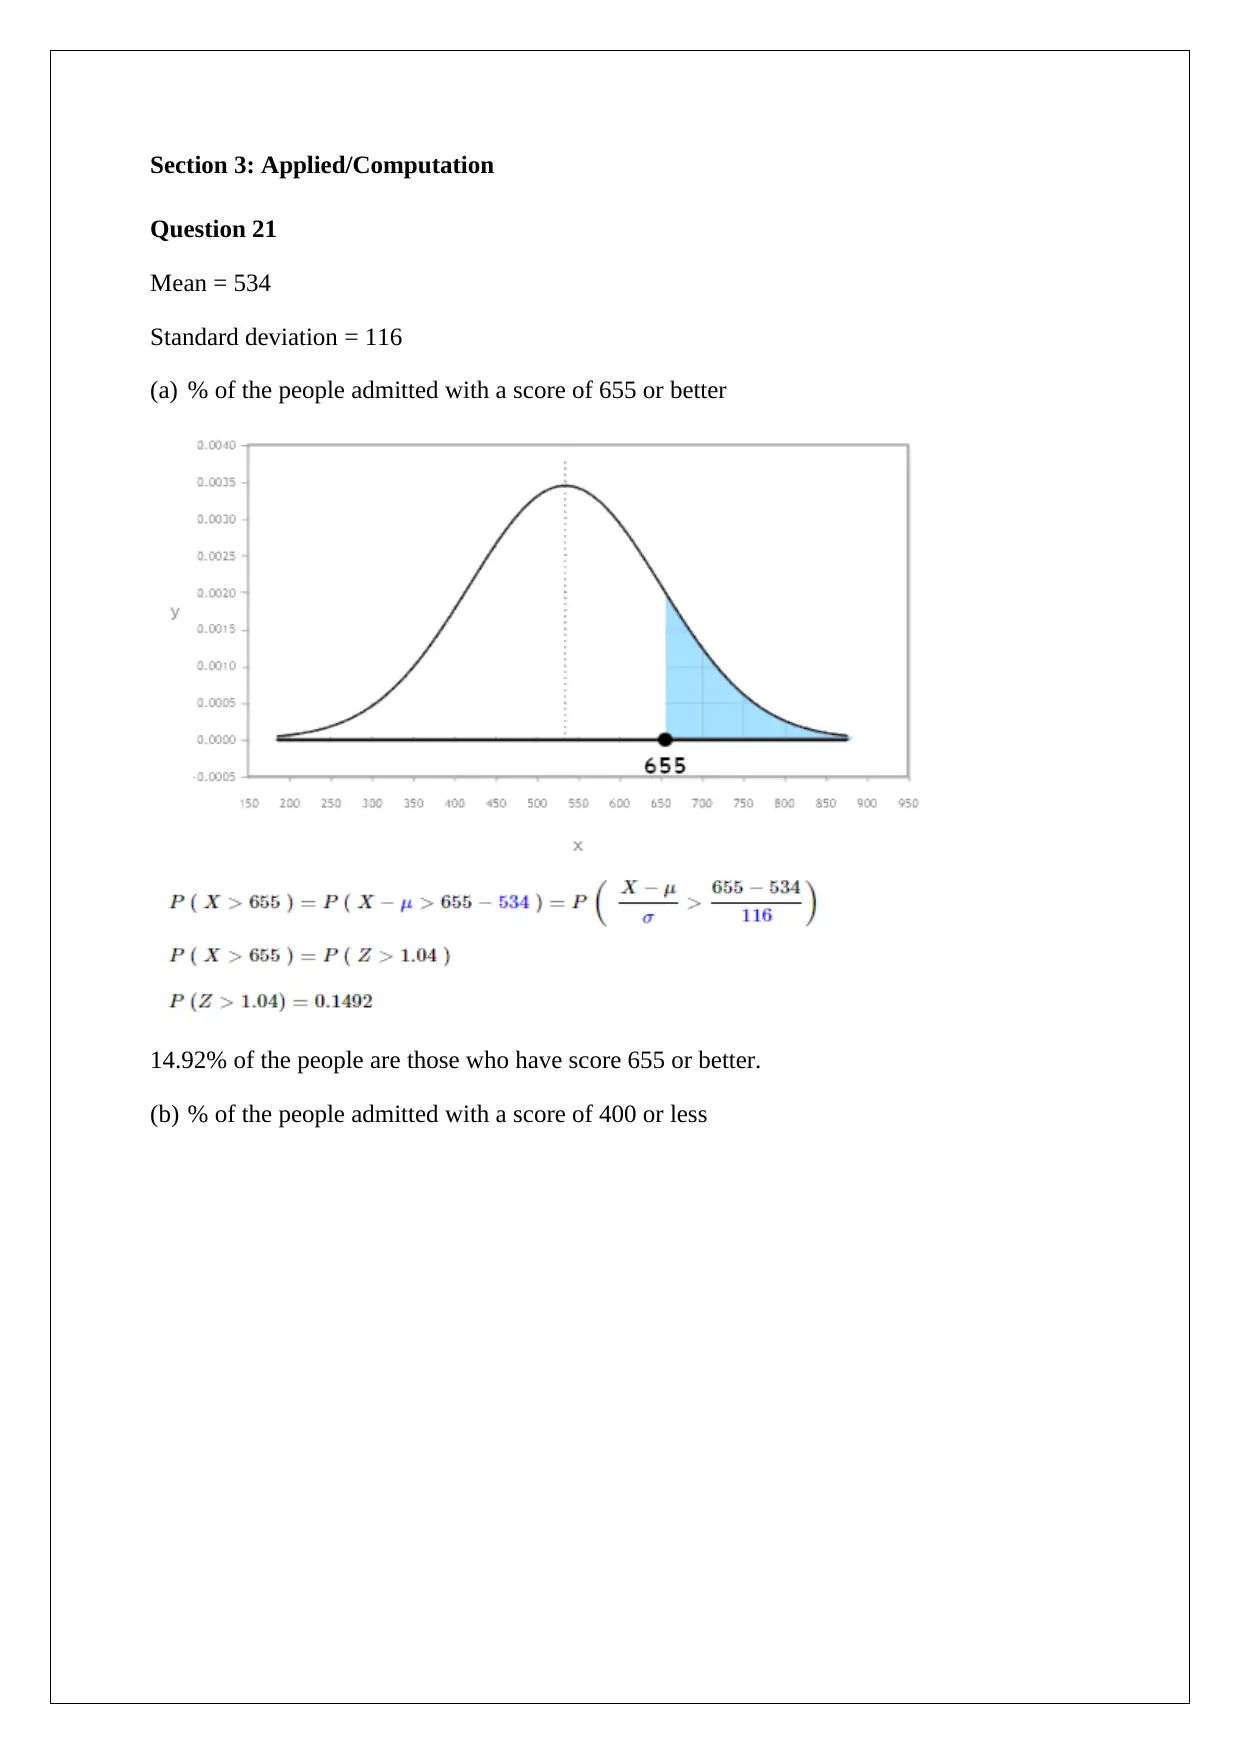
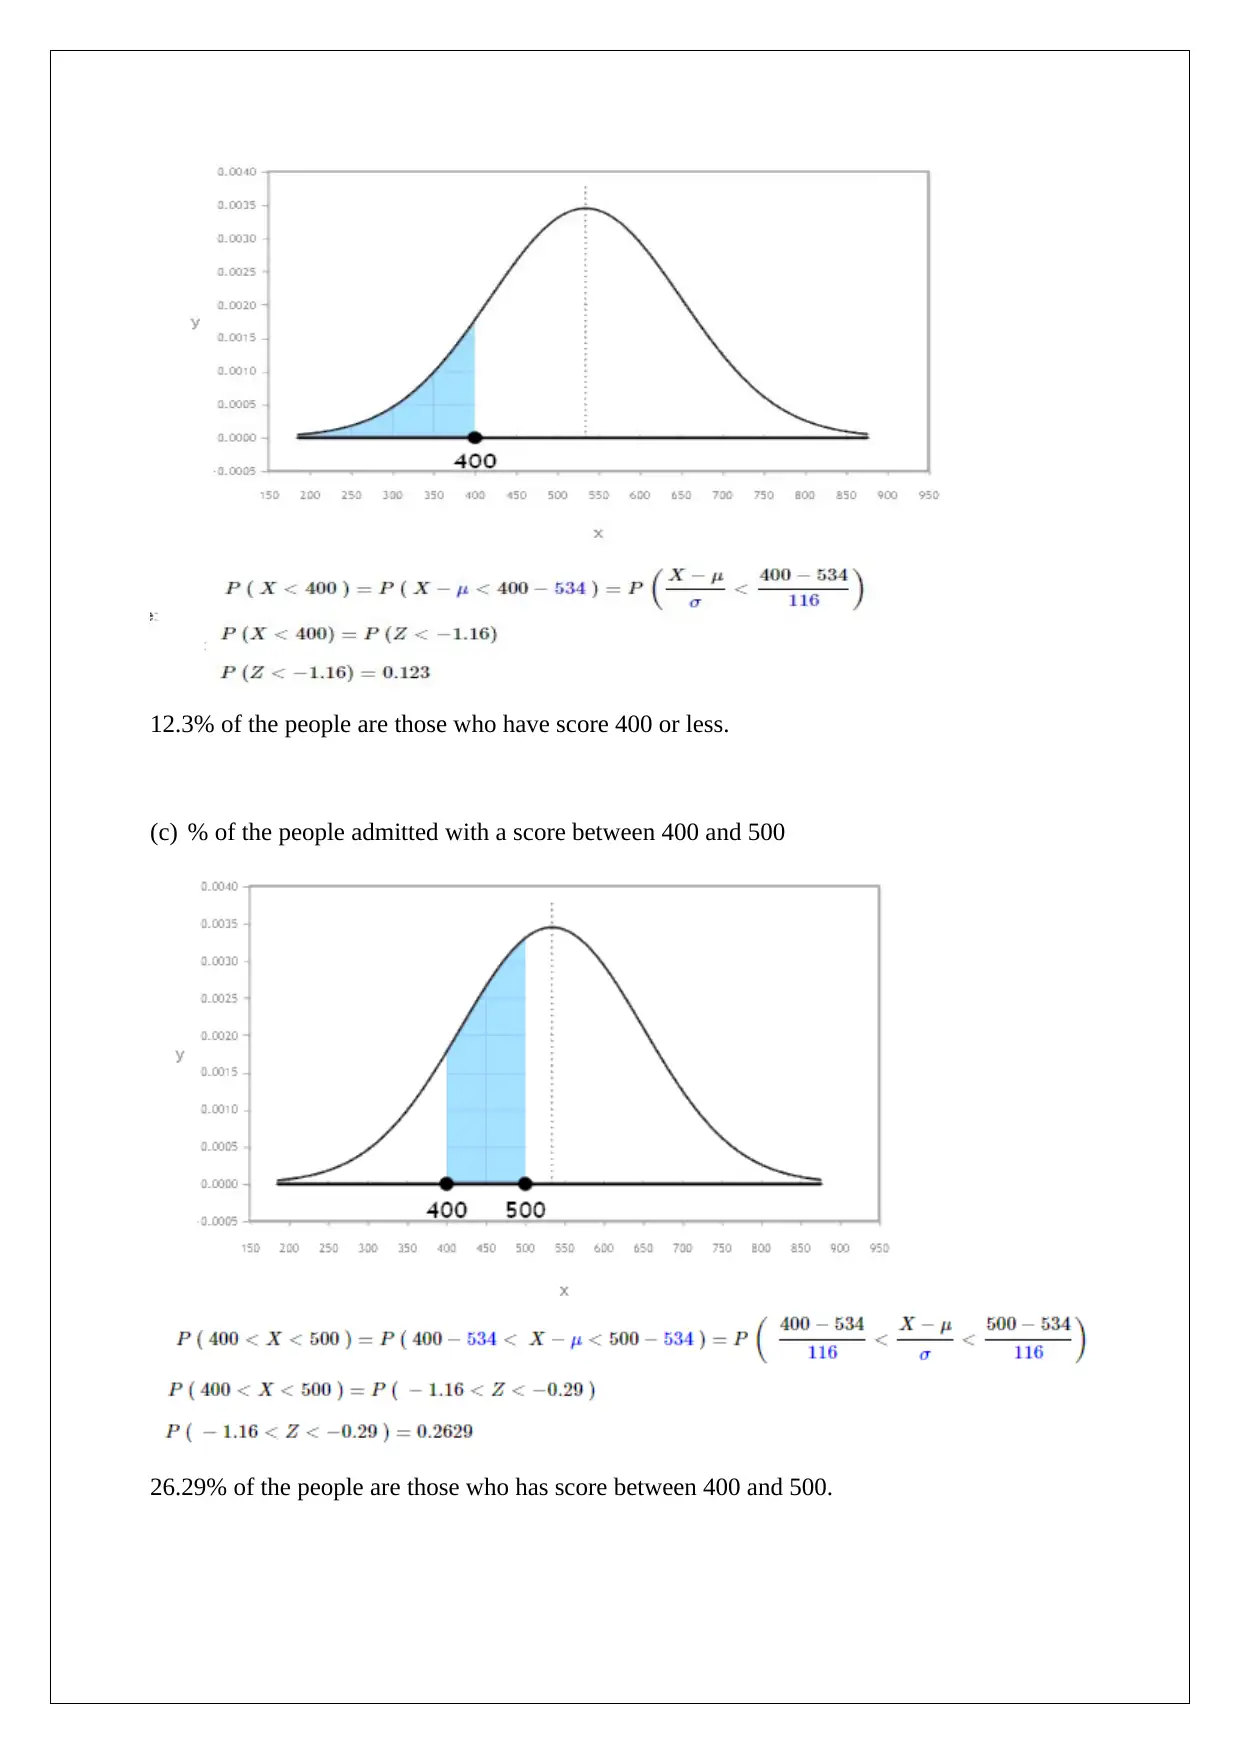
This document provides a comprehensive solution to a MATH 230 take-home final examination in Introduction to Statistical Reasoning and Analysis. The exam is divided into three sections: multiple-choice questions, true/false questions, and applied/computation questions. The solution includes answers to multiple-choice questions, true/false statements, and detailed solutions to applied problems involving mean, standard deviation, hypothesis testing, confidence intervals, and the central limit theorem. The applied questions cover topics such as calculating probabilities, determining z-values, and interpreting statistical results. The document also addresses the student's key takeaways from the course, emphasizing the importance of inferential statistical techniques and the central limit theorem in real-life applications. The solution demonstrates the application of statistical concepts to real-world scenarios, providing a valuable resource for students studying statistics.
tabler-icon-diamond-filled.svg

Contribute Materials

Your contribution can guide someone’s learning journey. Share your documents today.
Document Page
INTRO TO STATS
STUDENT ID:
[Pick the date]
tabler-icon-diamond-filled.svg

Secure Best Marks with AI Grader

Need help grading? Try our AI Grader for instant feedback on your assignments.
Document Page
Section 1: MultipleChoice
1) B
2) A
3) B
4) C
5) C
6) B
7) D
8) C
9) D
10)C
Section 2: True/False
11) False
12) True
13) False
14) True
15) True
16) False
17) False
18) True
19) False
20) True
Document Page
Section 3: Applied/Computation
Question 21
Mean = 534
Standard deviation = 116
(a) % of the people admitted with a score of 655 or better
14.92% of the people are those who have score 655 or better.
(b) % of the people admitted with a score of 400 or less
Document Page
12.3% of the people are those who have score 400 or less.
(c) % of the people admitted with a score between 400 and 500
26.29% of the people are those who has score between 400 and 500.
tabler-icon-diamond-filled.svg

Secure Best Marks with AI Grader

Need help grading? Try our AI Grader for instant feedback on your assignments.
Document Page
(d) Score of MATH when the score in upper 2.5% of people taking maths
The upper 2.5% = Bottom 97.5% or let say 0.9750
The z value corresponding to 0.9750 (From normal table) = 1.960
Hence,
1.960 = (X- 534)/116
X = 761.36
(e) Score corresponding to 75th percentile
Proportion = 0.7500
The z value corresponding to 0.7500 (From normal table) = 0.6745
Hence,
0.6745 = (X- 534)/116
X = 612.24
Question 22
(a) Mean and standard error
Proportion of M& M being blue = 0.24
Mean p = 0.24
Sample size n= 55
Standard error of distribution(s . e .)= pq
n = 0.24( 10.24 )
55 =0.0576
(b) Null and alternative hypotheses
H0: p = 0.24 There are 24% of M&M chocolate are blue.
Ha: p 0.24 24% There are not 24% of M&M chocolate are blue.
(c) Hypothesis testing
Sample proportion P = 8 / 55 = 0.1455
The test statistics ( z )= P p
s . e . =0.14550.24
0.0576 =1.6418
Document Page
The p value for z value and (two tailed hypothesis) = 0.1006
Assuming a significance level = 0.05
As clearly, the p value is higher than the significance level which indicates that null
hypothesis will not be rejected. Therefore, it can be concluded that the 24% of M&M are not
blue.
(d) 95% confidence interval
The z value for 95% confidence interval = 1.96
Sample proportion P = 8 / 55 = 0.1455
Standard error of proportion =
pq
n = 0.1455 ( 10.1455 )
55 =0.0475
Margin of error = z value * Standard error = 1.96*0.0475 = 0.0932
Lower limit of 95% confidence interval = Proportion – Margin of error = 0.1455 – 0.0932 =
0.0523
Upper limit of 95% confidence interval = Proportion + Margin of error = 0.1455 + 0.0932 =
0.2386
It can be said with 95% confidence that the true proportion of M& Ms chocolate being blue
would fall within 0.0523 and 0.2386 range.
Question 23
Sample size = 82
Sample mean = 228 mg
Hypothesised mean = 226 mg
(a) Null and alternative hypotheses
H0: μ=260 Mean amount of cholesterol in eggs for non-genetically altered chicken is
260mg.
Ha : μ< 260 Mean amount of cholesterol in eggs for non-genetically altered chicken is less
than 260mg.
(b) Hypothesis testing
Document Page
Population standard deviation = 19 mg
The test statistics ( z )= 228260
19
82
=15.25
The p value for z value and (left tailed hypothesis) = 0.00
Significance level = 0.05
The p value is lesser than the significance level which highlights that null hypothesis will be
rejected and alternative hypothesis will be rejected. Therefore, it can be concluded that
“average amount of cholesterol in eggs for non-genetically altered chicken is less than 260
mg.”
(c) 95% confidence interval
The z value for 95% confidence interval = 1.96
Standard error = 19
82=2.0608
Margin of error = z value * Standard error = 1.96*2.0608 = 4.0392
Lower limit of 95% confidence interval = Mean – Margin of error = 228-4.0392= 223.96
Upper limit of 95% confidence interval = Mean + Margin of error = 228+4.0392 =232.04
It can be said with 95% confidence that the mean amount of cholesterol in altered chicken
egg would fall within 223.96 mg and 232.04 mg.
(d) Yes, there is evidence to support the claim made by FDA that genetically altered eggs are
superior in comparison to normal eggs on account of their low cholesterol content. This is
validated from the fact that as per the result of part(c) the mean cholesterol level for
genetically altered eggs is expected to lie between 223.96 mg and 232.04mg. This is
significantly lower than the 260mg cholesterol for a normal egg.
Question 25
One of the most important things that I have learned about statistics this semester is the use of
inferential statistical techniques. I can think of a host of real life practical situations where
techniques such as hypothesis testing along with confidence interval could be useful in
determining key characteristic about the underlying population from which sample has been
drawn. Without the use of sampling along with inferential statistical techniques, it would
tabler-icon-diamond-filled.svg

Paraphrase This Document

Need a fresh take? Get an instant paraphrase of this document with our AI Paraphraser
Document Page
require the whole population to be analysed which would be extremely cumbersome and
would lead to wastage of scarce resources. Another important thing learned in this semester is
the pivotal role of Central Limit Theorem particularly in determining the underlying
distribution of the variable. This is pivotal since the suitable test in the inferential statistics is
dependent on the appropriate classification of the distribution of the underlyingvariable.
chevron_up_icon
1 out of 8
circle_padding
hide_on_mobile
zoom_out_icon
logo.png

Your All-in-One AI-Powered Toolkit for Academic Success.

Available 24*7 on WhatsApp / Email

[object Object]