Math 453/553/653: Coursework 3 - Exponential Distribution and Bayes
VerifiedAdded on 2022/08/30
|8
|745
|17
Homework Assignment
AI Summary
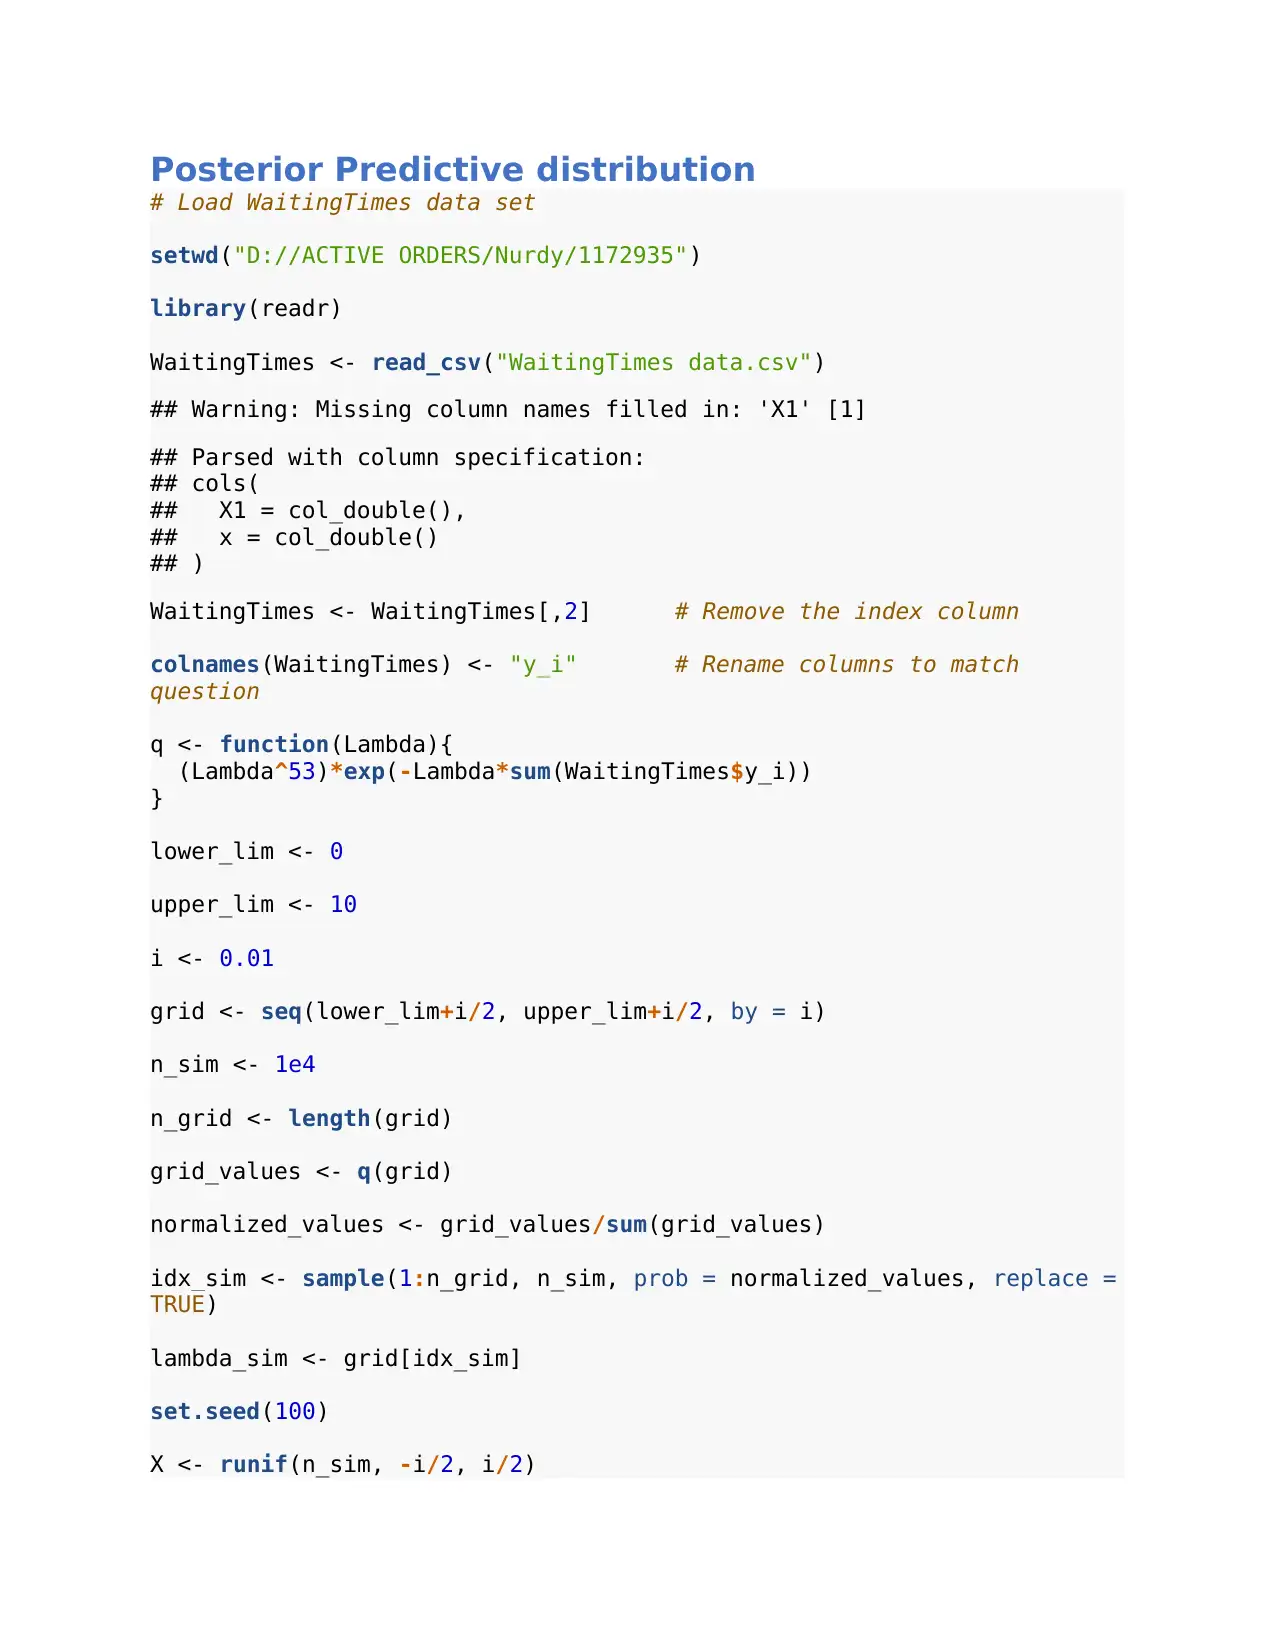
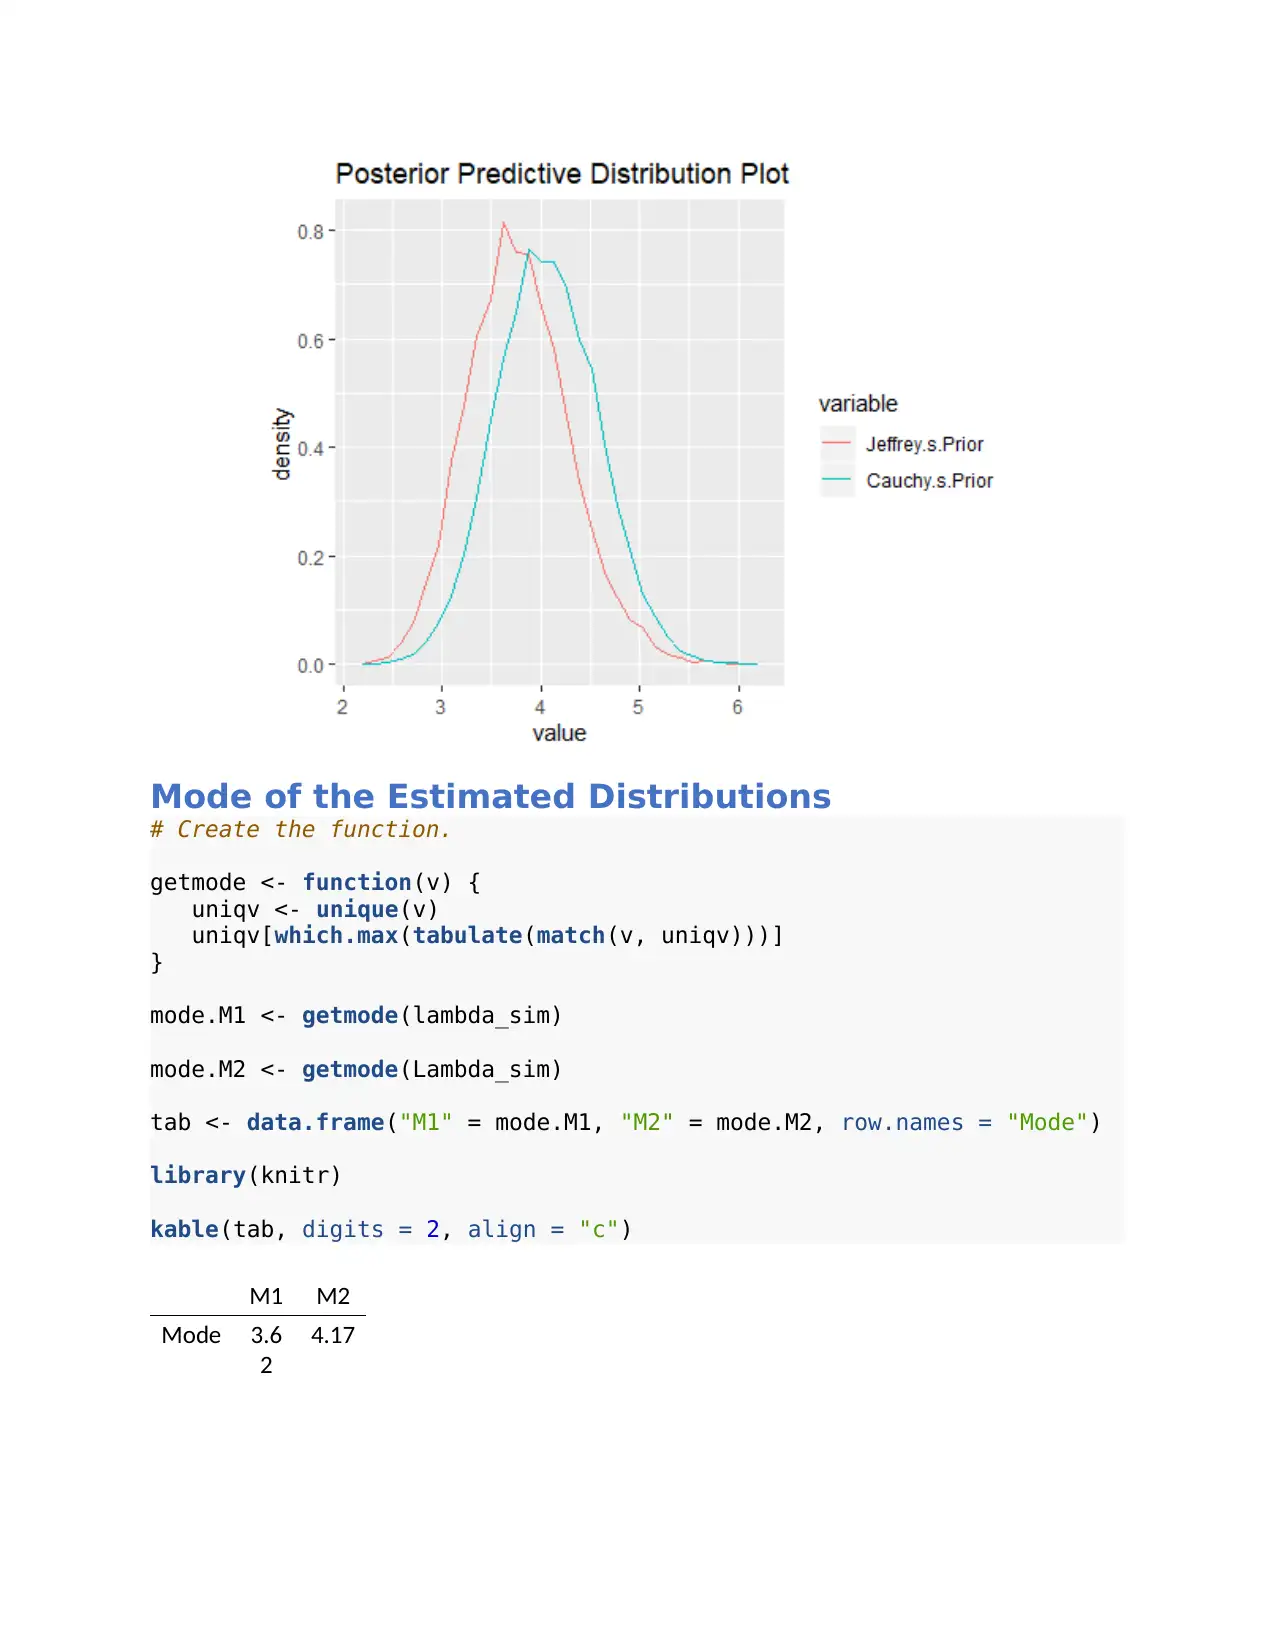
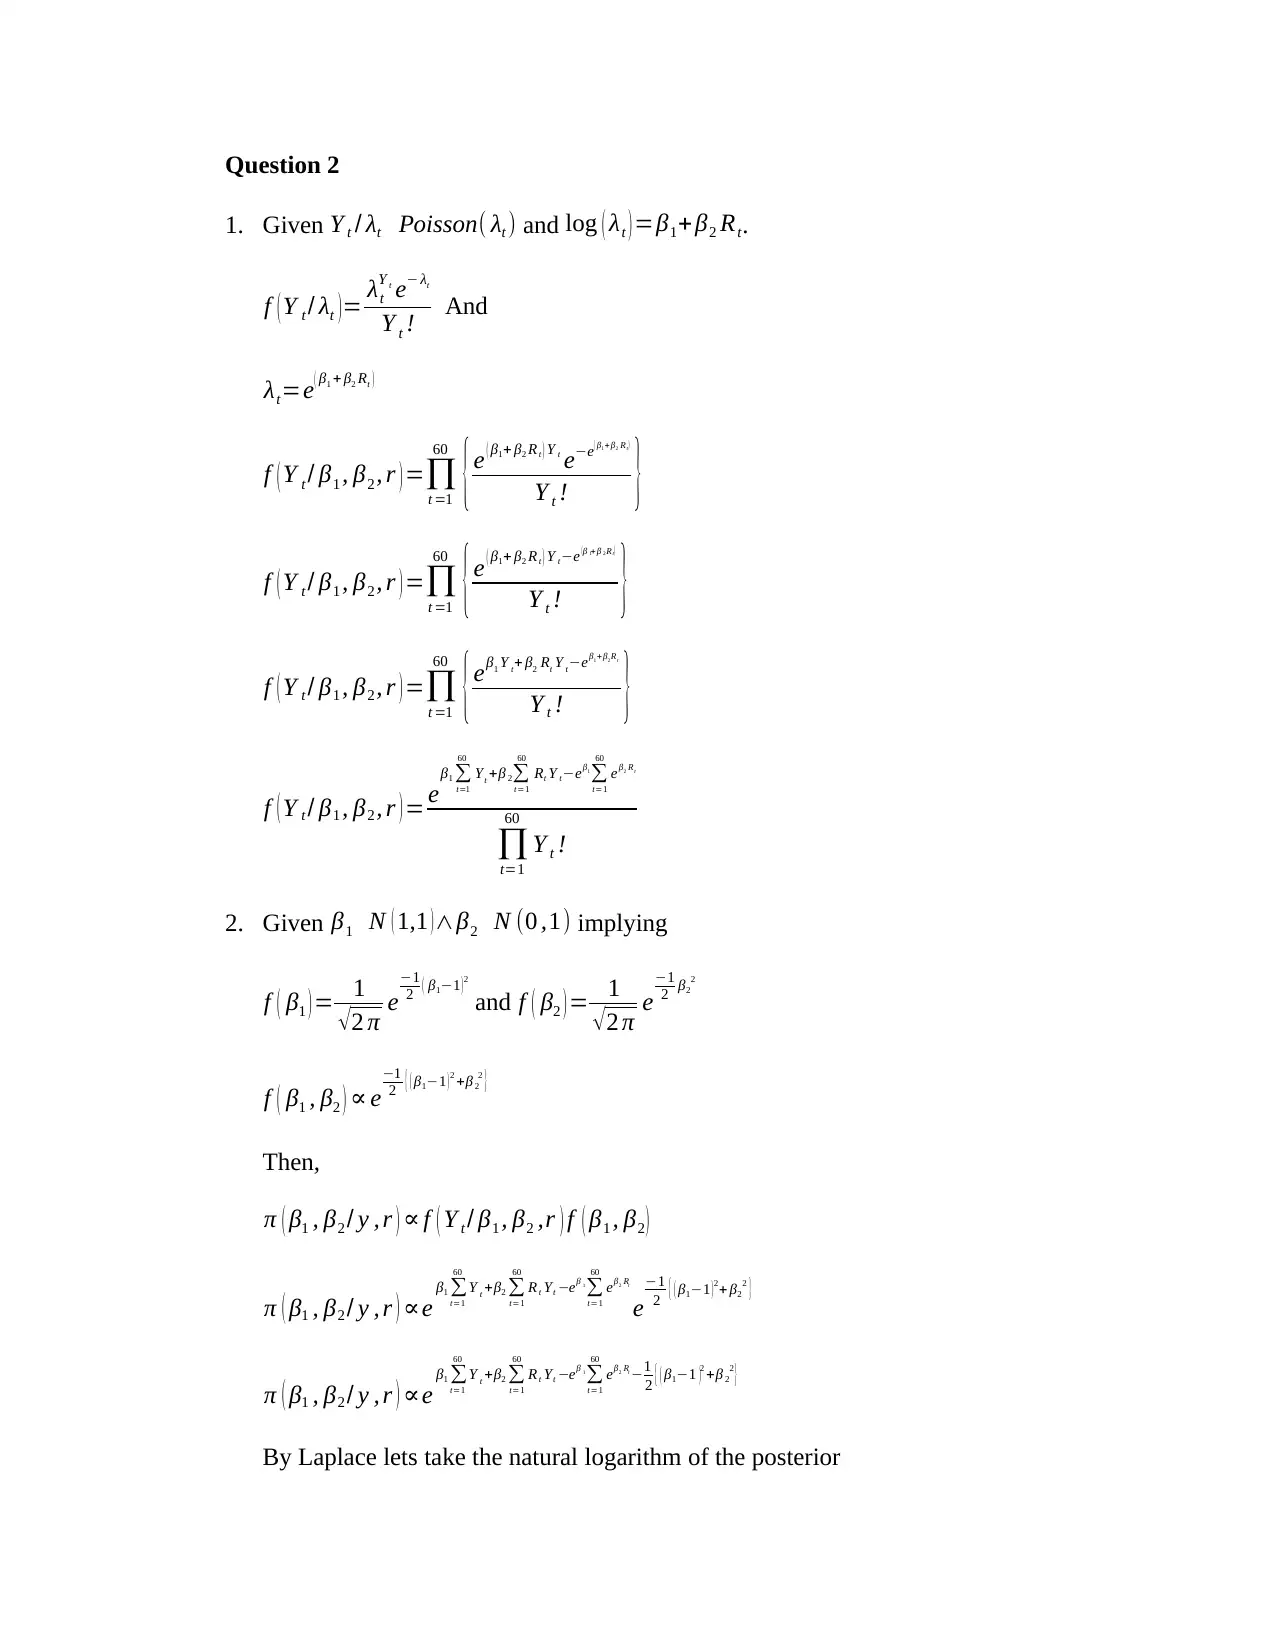
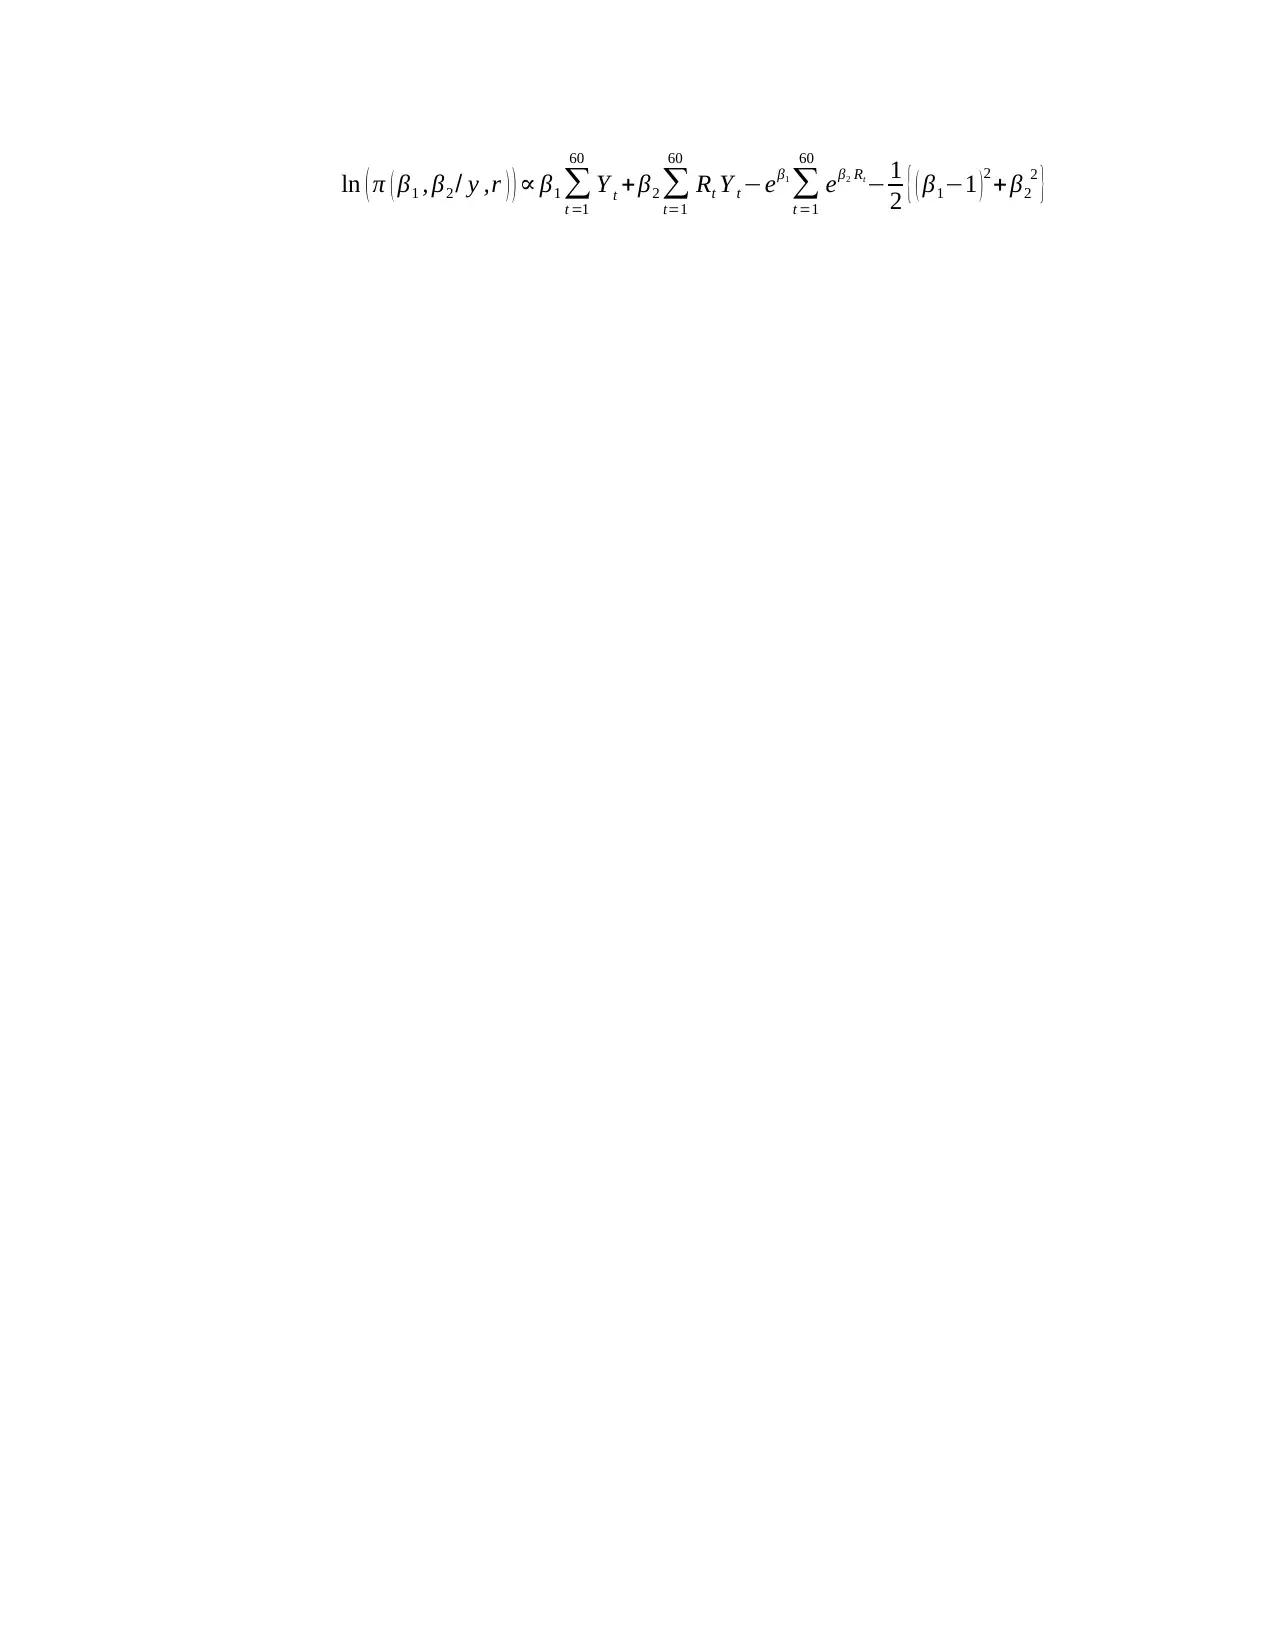
This document presents the complete solution to Math 453 Coursework 3, which involves analyzing customer waiting times for a food delivery service. The assignment focuses on modeling the waiting times using an exponential distribution and calculating the Jeffrey's prior. The solution demonstrates the calculation of the Bayes factor for different priors, including the use of a Cauchy prior, and provides R code to estimate posterior distributions using the grid approximation method. The analysis includes posterior predictive distribution plots and mode estimation for the estimated distributions. The second question uses Laplace's method to estimate the posterior.

Question 1
1. Show that the Jeffrey’s prior for λ is
π1 ( λ ) ∝ 1
λ , λ> 0
By definition the Jeffrey’s prior P(θ) is given by the formula:
P ( λ ) =
( Eλ [ −∂2 ln ( f ( yi / λ ) )
∂ λ2 ] ) 1
2
Given, f ( yi /λ )= λ e−λ yi
, yi ≥ 0
ln ( f ( yi / λ ) ) =ln ( λ e−λx )
ln ( f ( yi / λ ) ) =ln ( λ ) −λ yi
Then,
∂ ln ( f ( yi / λ ) )
∂ λ = 1
λ − yi
Implying,
∂2 ln ( f ( yi / λ ) )
∂ λ2 =−1
λ2
And
P ( λ ) =( 1
λ2 ) 1
2 = 1
λ
Therefore, P ( λ ) =π1 ( λ ) ∝ 1
λ
2. The prior density π2 ( λ ) ∝ 1
1+ ( λ−5 ) 2 , suggest that the average waiting time follows a
Cauchy’s distribution defined as f ( yi ; 5 , 1 ). That is a Cauchy distribution with location
parameter = 5 and scale parameter = 1. The prior is a density function which integrates to
Paraphrase This Document
Need a fresh take? Get an instant paraphrase of this document with our AI Paraphraser

1 hence the experts prior π2 ( λ ) ∝ 1
1+ ( λ−5 ) 2 is a proper prior by definition of density
function.
3. The formula for calculation of Bayes factor for non-informative priors is given as
Bayes Factor= Posterior odd
Prior odds
The posterior odd is the posterior probability of M 1 given the data, divided by the
posterior probability of M 2 given the data. The prior odd is the prior probability of M 1
divided by the prior probability of M 2.
In this case:
Posterior odd= f ( λ / yi , M1 )
f ( λ / yi , M2 )
But,
f ( λ/ yi , M 1 ) ∝ P ( yi / λ ) π1 ( λ )
Also,
P ( yi / λ ) =∏i=1
54
{ λ e−λ yi }=λ54 e− λ∑
i=1
54
yi
f ( λ/ yi , M 1 ) ∝ λ54 e− λ∑
i=1
54
yi
( 1
λ )
f ( λ/ yi , M 1 ) ∝ λ53 e− λ∑
i=1
54
yi
Similarly,
f ( λ/ yi , M 2 ) ∝ P ( yi / λ ) π2 ( λ )
f ( λ/ yi , M 2 ) ∝ λ54 e− λ∑
i=1
54
yi
( 1
1+ ( λ−5 )2 )

f ( λ/ yi , M 2 ) ∝ λ54 e− λ∑
i=1
54
yi
1+ ( λ−5 )2
Thus,
Posterior odd= λ53 e−λ∑
i=1
54
yi
λ54 e−λ∑
i=1
54
yi
1+ ( λ−5 )2
Posterior odd= 1+ ( λ−5 ) 2
λ
Next, prior odd is given as
Prior odd= π1 ( λ )
π2 ( λ )
Prior odd=
1
λ
1
1+ ( λ−5 )2
Prior odd= 1+ ( λ−5 ) 2
λ
Therefore,
Bayes Factor=
1+ ( λ−5 )2
λ
1+ ( λ−5 )
2
λ
=1.
The Bayes factor is 1 thus does not provide any useful information on which model is
better.
4. The posterior distributions are estimated using the grid approximation method in R. The
code used and output for the posterior predictive distributions are as shown below:
i=1
54
yi
1+ ( λ−5 )2
Thus,
Posterior odd= λ53 e−λ∑
i=1
54
yi
λ54 e−λ∑
i=1
54
yi
1+ ( λ−5 )2
Posterior odd= 1+ ( λ−5 ) 2
λ
Next, prior odd is given as
Prior odd= π1 ( λ )
π2 ( λ )
Prior odd=
1
λ
1
1+ ( λ−5 )2
Prior odd= 1+ ( λ−5 ) 2
λ
Therefore,
Bayes Factor=
1+ ( λ−5 )2
λ
1+ ( λ−5 )
2
λ
=1.
The Bayes factor is 1 thus does not provide any useful information on which model is
better.
4. The posterior distributions are estimated using the grid approximation method in R. The
code used and output for the posterior predictive distributions are as shown below:
⊘ This is a preview!⊘
Do you want full access?
Subscribe today to unlock all pages.

Trusted by 1+ million students worldwide

Posterior Predictive distribution
# Load WaitingTimes data set
setwd("D://ACTIVE ORDERS/Nurdy/1172935")
library(readr)
WaitingTimes <- read_csv("WaitingTimes data.csv")
## Warning: Missing column names filled in: 'X1' [1]
## Parsed with column specification:
## cols(
## X1 = col_double(),
## x = col_double()
## )
WaitingTimes <- WaitingTimes[,2] # Remove the index column
colnames(WaitingTimes) <- "y_i" # Rename columns to match
question
q <- function(Lambda){
(Lambda^53)*exp(-Lambda*sum(WaitingTimes$y_i))
}
lower_lim <- 0
upper_lim <- 10
i <- 0.01
grid <- seq(lower_lim+i/2, upper_lim+i/2, by = i)
n_sim <- 1e4
n_grid <- length(grid)
grid_values <- q(grid)
normalized_values <- grid_values/sum(grid_values)
idx_sim <- sample(1:n_grid, n_sim, prob = normalized_values, replace =
TRUE)
lambda_sim <- grid[idx_sim]
set.seed(100)
X <- runif(n_sim, -i/2, i/2)
Paraphrase This Document
Need a fresh take? Get an instant paraphrase of this document with our AI Paraphraser

lambda_sim <- lambda_sim + X
Posterior prediction plot for model 2
q1 <- function(Lambda){
((Lambda^54)*exp(-Lambda*sum(WaitingTimes$y_i)))/(1+(Lambda-5)^2)
}
Grid_values <- q1(grid)
Normalized_values <- Grid_values/sum(Grid_values)
Idx_sim <- sample(1:n_grid, n_sim, prob = Normalized_values, replace =
TRUE)
Lambda_sim <- grid[Idx_sim]
Lambda_sim <- Lambda_sim + X
library(ggplot2)
library(reshape2)
df <- data.frame("Jeffrey's Prior" = lambda_sim, "Cauchy's Prior" =
Lambda_sim)
df.m <- melt(df)
## No id variables; using all as measure variables
ggplot(df.m) + geom_freqpoly(aes(x = value,
y = ..density.., colour = variable)) +
labs(title = "Posterior Predictive Distribution Plot")
## `stat_bin()` using `bins = 30`. Pick better value with `binwidth`.

Mode of the Estimated Distributions
# Create the function.
getmode <- function(v) {
uniqv <- unique(v)
uniqv[which.max(tabulate(match(v, uniqv)))]
}
mode.M1 <- getmode(lambda_sim)
mode.M2 <- getmode(Lambda_sim)
tab <- data.frame("M1" = mode.M1, "M2" = mode.M2, row.names = "Mode")
library(knitr)
kable(tab, digits = 2, align = "c")
M1 M2
Mode 3.6
2
4.17
⊘ This is a preview!⊘
Do you want full access?
Subscribe today to unlock all pages.

Trusted by 1+ million students worldwide

Question 2
1. Given Y t / λt Poisson( λt ) and log ( λt ) =β1+ β2 Rt.
f ( Y t / λt )= λt
Y t
e− λt
Y t ! And
λt=e
( β1 + β2 Rt )
f ( Y t / β1 , β2 , r ) =∏
t =1
60
{e ( β1+ β2 R t ) Y t
e−e
( β1+ β2 Rt)
Y t ! }
f ( Y t / β1 , β2 , r ) =∏
t =1
60
{e ( β1+ β2 R t ) Y t−e (β 1+ β 2Rt)
Y t ! }
f ( Y t / β1 , β2 , r ) =∏
t =1
60
{eβ1 Y t+ β2 Rt Y t−eβ1+ β2Rt
Y t ! }
f ( Y t / β1 , β2 , r ) = eβ1 ∑
t=1
60
Yt +β 2∑
t=1
60
Rt Y t−eβ1
∑
t=1
60
eβ2 Rt
∏t=1
60
Y t !
2. Given β1 N ( 1,1 ) ∧β2 N (0 ,1) implying
f ( β1 ) = 1
√2 π e
−1
2 ( β1−1 )2
and f ( β2 ) = 1
√ 2 π e
−1
2 β2
2
f ( β1 , β2 ) ∝ e
−1
2 { ( β1−1 ) 2 +β 2
2
}
Then,
π ( β1 , β2 / y , r ) ∝ f ( Y t / β1 , β2 ,r ) f ( β1 , β2 )
π ( β1 , β2 / y , r ) ∝e β1 ∑
t=1
60
Y t +β2 ∑
t=1
60
R t Yt −eβ 1
∑
t=1
60
eβ2 Rt
e
−1
2 { ( β1−1 ) 2+ β2
2
}
π ( β1 , β2 / y , r ) ∝e β1 ∑
t=1
60
Y t +β2 ∑
t=1
60
R t Yt −eβ 1
∑
t=1
60
eβ2 Rt −1
2 { ( β1−1 )2 +β 2
2
}
By Laplace lets take the natural logarithm of the posterior
Paraphrase This Document
Need a fresh take? Get an instant paraphrase of this document with our AI Paraphraser

ln ( π ( β1 , β2 / y ,r ) ) ∝ β1 ∑
t =1
60
Y t + β2 ∑
t=1
60
Rt Y t −eβ1
∑
t =1
60
eβ2 Rt
− 1
2 { ( β1−1 )2 + β2
2
}
t =1
60
Y t + β2 ∑
t=1
60
Rt Y t −eβ1
∑
t =1
60
eβ2 Rt
− 1
2 { ( β1−1 )2 + β2
2
}
1 out of 8

Your All-in-One AI-Powered Toolkit for Academic Success.
+13062052269
info@desklib.com
Available 24*7 on WhatsApp / Email
Unlock your academic potential
Copyright © 2020–2025 A2Z Services. All Rights Reserved. Developed and managed by ZUCOL.