Math Assignment Solution: CPI, Profit Functions and Economic Analysis

Verified

Added on  2023/06/06

|6
|609
|67
Homework Assignment
AI Summary
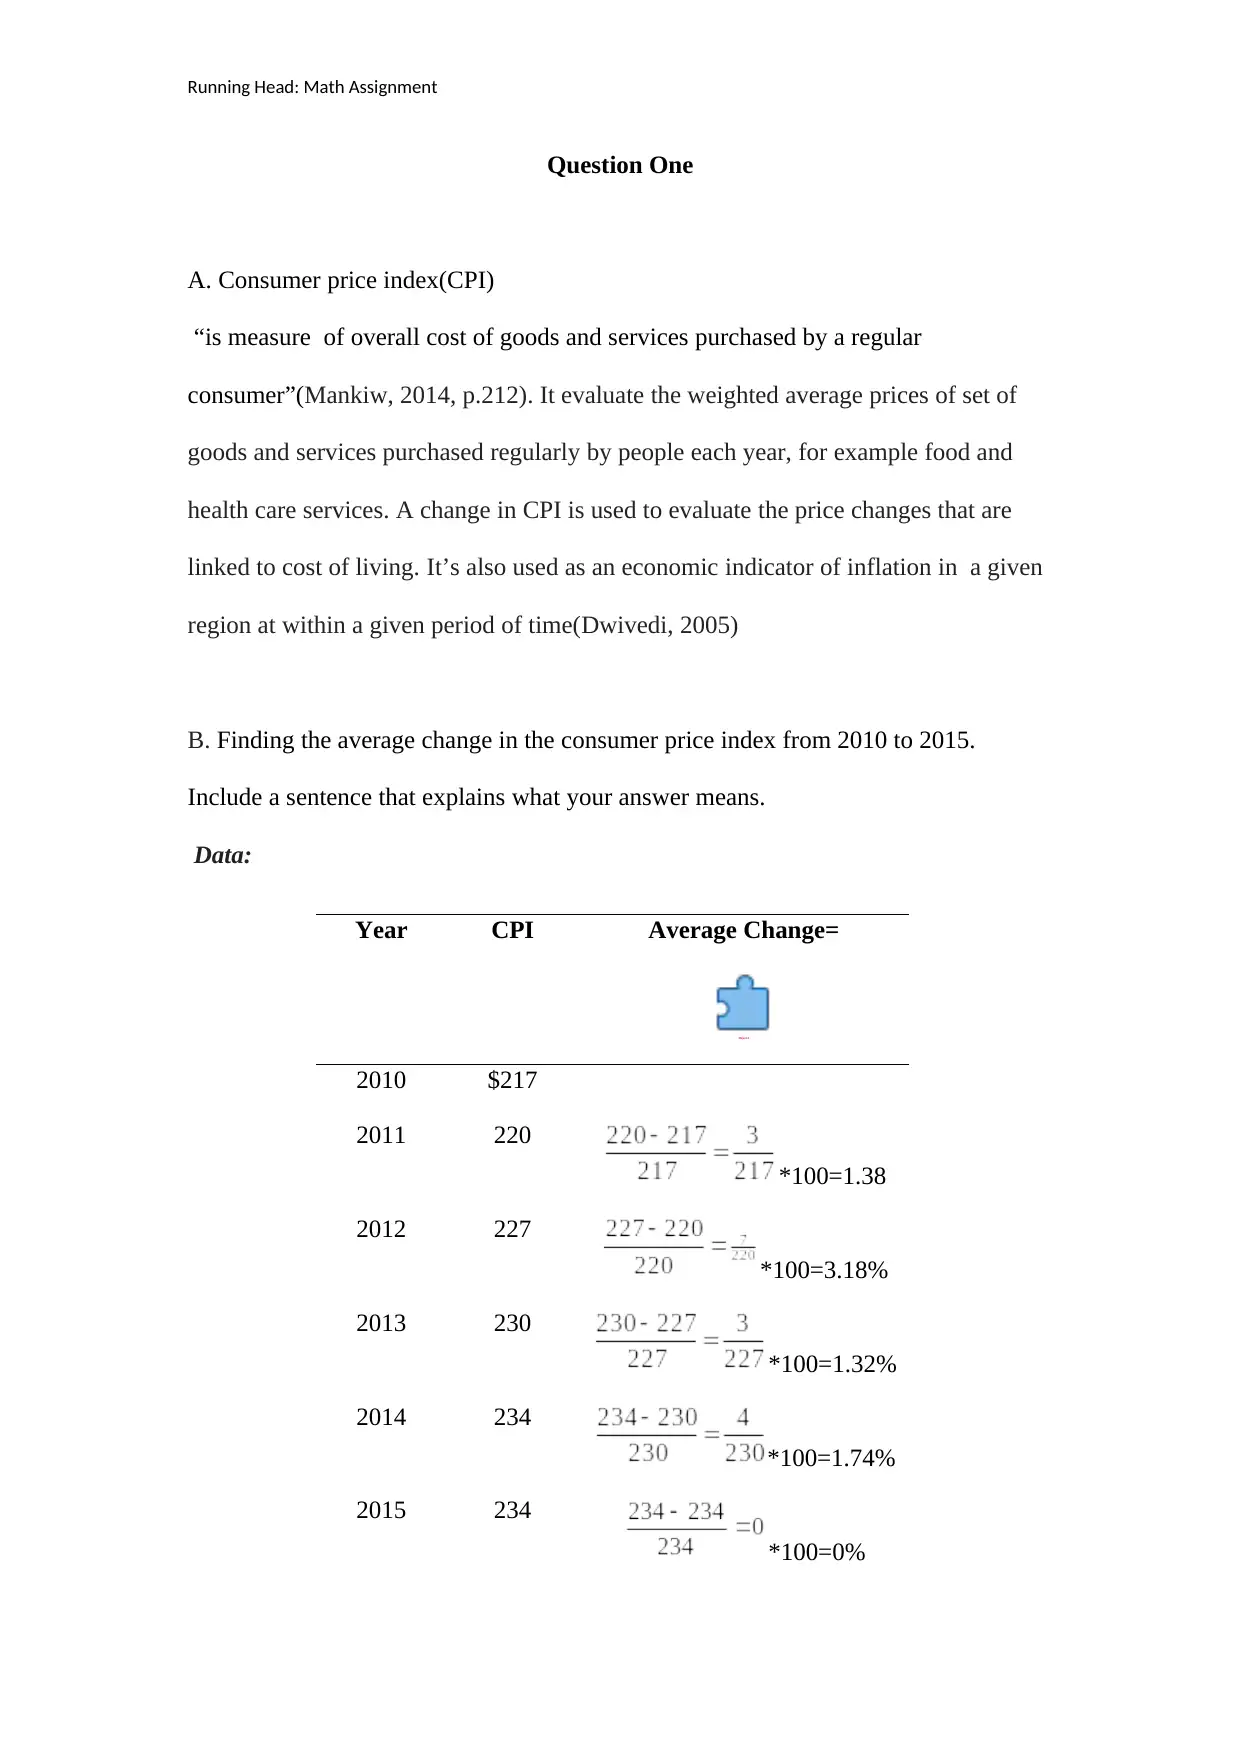
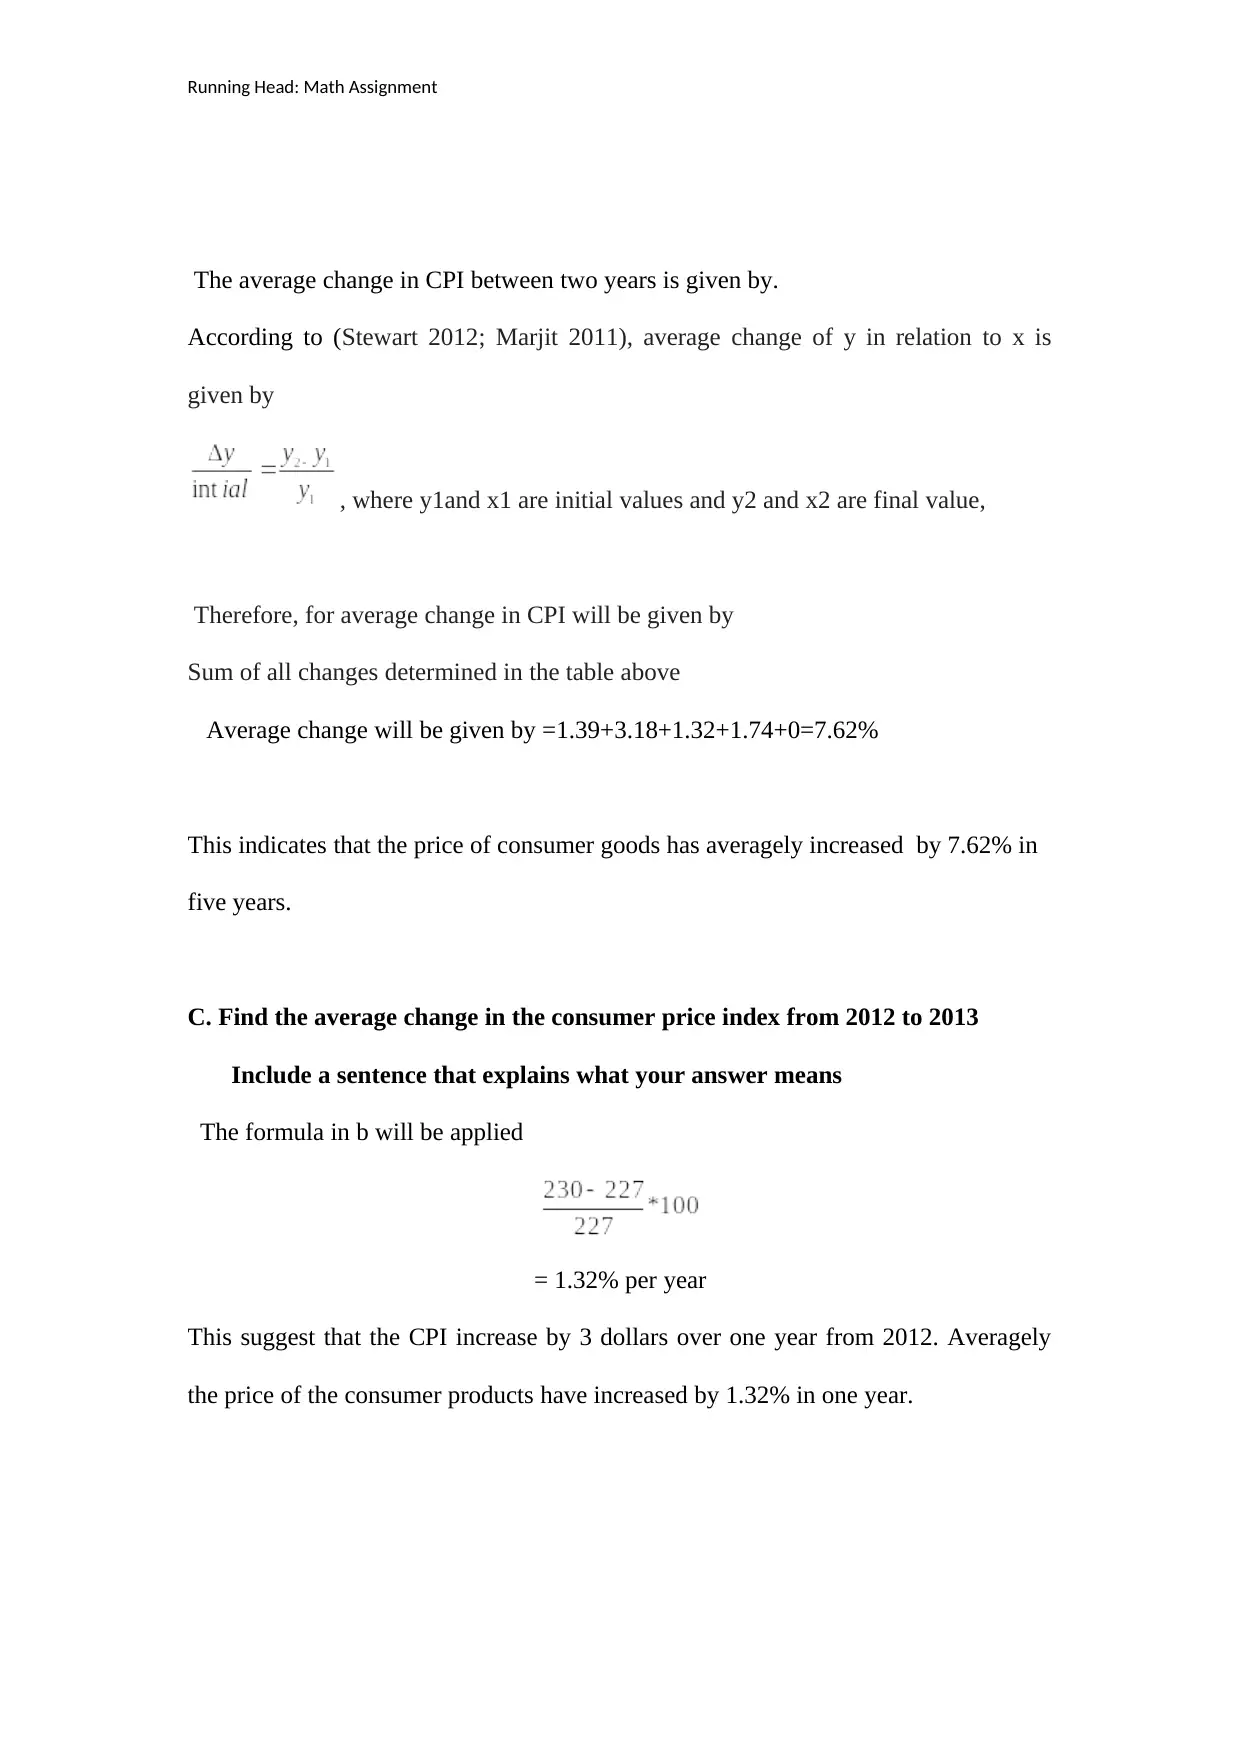
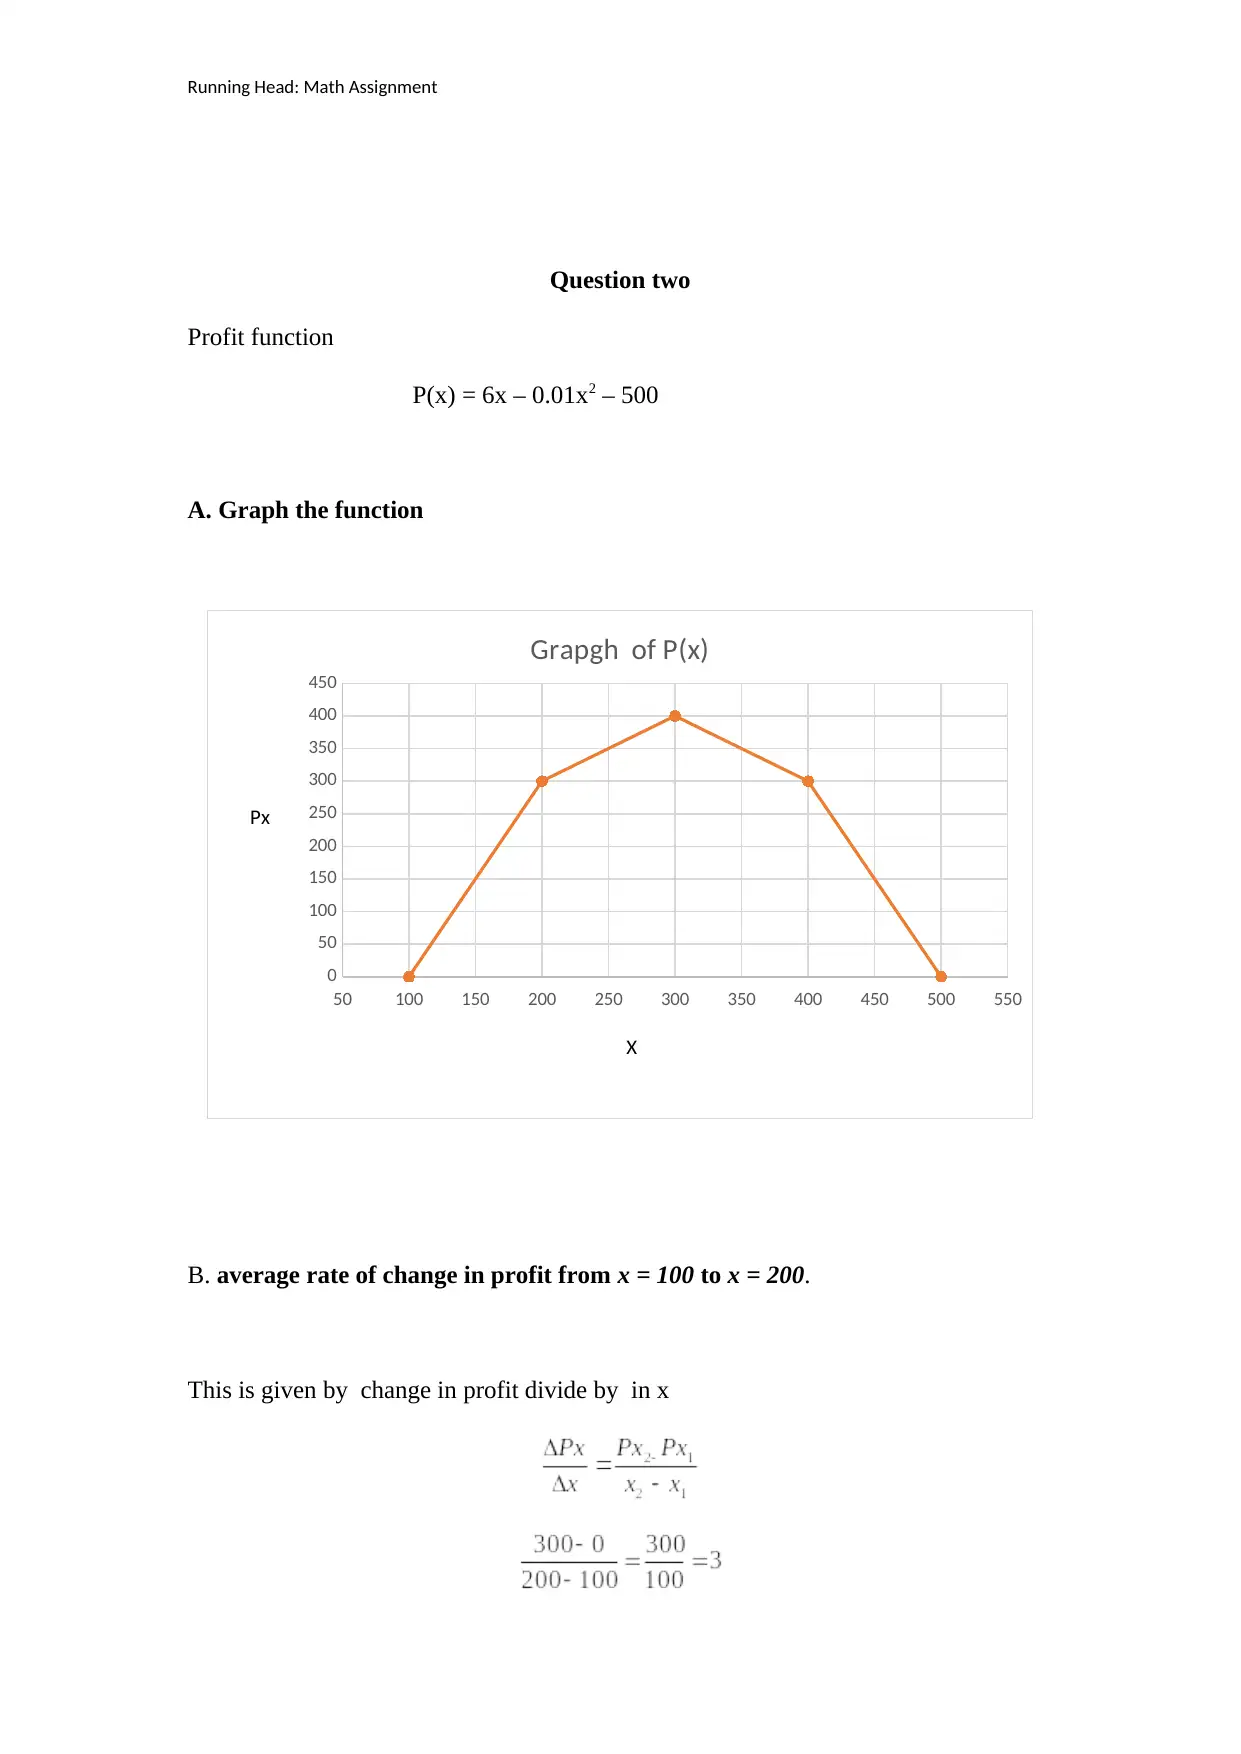
This math assignment solution covers two main questions: analysis of the Consumer Price Index (CPI) and analysis of a profit function. The CPI section involves calculating average changes in CPI between different years (2010-2015 and 2012-2013) and interpreting the results in terms of price changes and cost of living. The profit function section involves graphing a given profit function, calculating the average rate of change in profit between specified x-values (x=100 to x=200), interpreting this rate of change, and relating it to the graph of the function. The assignment uses formulas to calculate average changes and rate of change, and provides interpretations of the calculated values in the context of economics and business.
tabler-icon-diamond-filled.svg

Contribute Materials

Your contribution can guide someone’s learning journey. Share your documents today.
Document Page
Running Head: Math Assignment
Mathematics Assignment
Student’s Name
Institution Affiliation
tabler-icon-diamond-filled.svg

Secure Best Marks with AI Grader

Need help grading? Try our AI Grader for instant feedback on your assignments.
Document Page
Running Head: Math Assignment
Question One
A. Consumer price index(CPI)
“is measure of overall cost of goods and services purchased by a regular
consumer”(Mankiw, 2014, p.212). It evaluate the weighted average prices of set of
goods and services purchased regularly by people each year, for example food and
health care services. A change in CPI is used to evaluate the price changes that are
linked to cost of living. It’s also used as an economic indicator of inflation in a given
region at within a given period of time(Dwivedi, 2005)
B. Finding the average change in the consumer price index from 2010 to 2015.
Include a sentence that explains what your answer means.
Data:
Year CPI Average Change=
Object 2
2010 $217
2011 220
*100=1.38
2012 227
*100=3.18%
2013 230
*100=1.32%
2014 234
*100=1.74%
2015 234
*100=0%
Document Page
Running Head: Math Assignment
The average change in CPI between two years is given by.
According to (Stewart 2012; Marjit 2011), average change of y in relation to x is
given by
, where y1and x1 are initial values and y2 and x2 are final value,
Therefore, for average change in CPI will be given by
Sum of all changes determined in the table above
Average change will be given by =1.39+3.18+1.32+1.74+0=7.62%
This indicates that the price of consumer goods has averagely increased by 7.62% in
five years.
C. Find the average change in the consumer price index from 2012 to 2013
Include a sentence that explains what your answer means
The formula in b will be applied
= 1.32% per year
This suggest that the CPI increase by 3 dollars over one year from 2012. Averagely
the price of the consumer products have increased by 1.32% in one year.
Document Page
Running Head: Math Assignment
Question two
Profit function
P(x) = 6x – 0.01x2 – 500
A. Graph the function
50 100 150 200 250 300 350 400 450 500 550
0
50
100
150
200
250
300
350
400
450
Grapgh of P(x)
B. average rate of change in profit from x = 100 to x = 200.
This is given by change in profit divide by in x
X
Px
tabler-icon-diamond-filled.svg

Secure Best Marks with AI Grader

Need help grading? Try our AI Grader for instant feedback on your assignments.
Document Page
Running Head: Math Assignment
C. Write a sentence interpreting 2b.
This rate of change of profit is 3 dollar per 1 unit of product x. This means that when
x increases with 1 unit, the profit of the of the company will increase by 3.
D. Interpret part b on the graph in part a
From the chart in a it’s clear, when the x increase by 100 unit the profit increased
from 0 to 300 dollars. This means that the profit is three times the change in x
units( 200-100=100)
Document Page
Running Head: Math Assignment
References
Mankiw, N. G. (2014). Principles of macroeconomics. Cengage Learning.
Stewart, J. (2012). Essential calculus: Early transcendentals. Cengage Learning.
Dwivedi, D. N. (2005). Macroeconomics: theory and policy. Tata McGraw-Hill
Education.
Marjit, S. (Ed.). (2011). India Macroeconomics Annual 2010. SAGE Publications
India.
chevron_up_icon
1 out of 6
circle_padding
hide_on_mobile
zoom_out_icon
logo.png

Your All-in-One AI-Powered Toolkit for Academic Success.

Available 24*7 on WhatsApp / Email

[object Object]