Analysis of Probability Distributions and Statistics - MATH 243
VerifiedAdded on 2023/05/28
|6
|604
|89
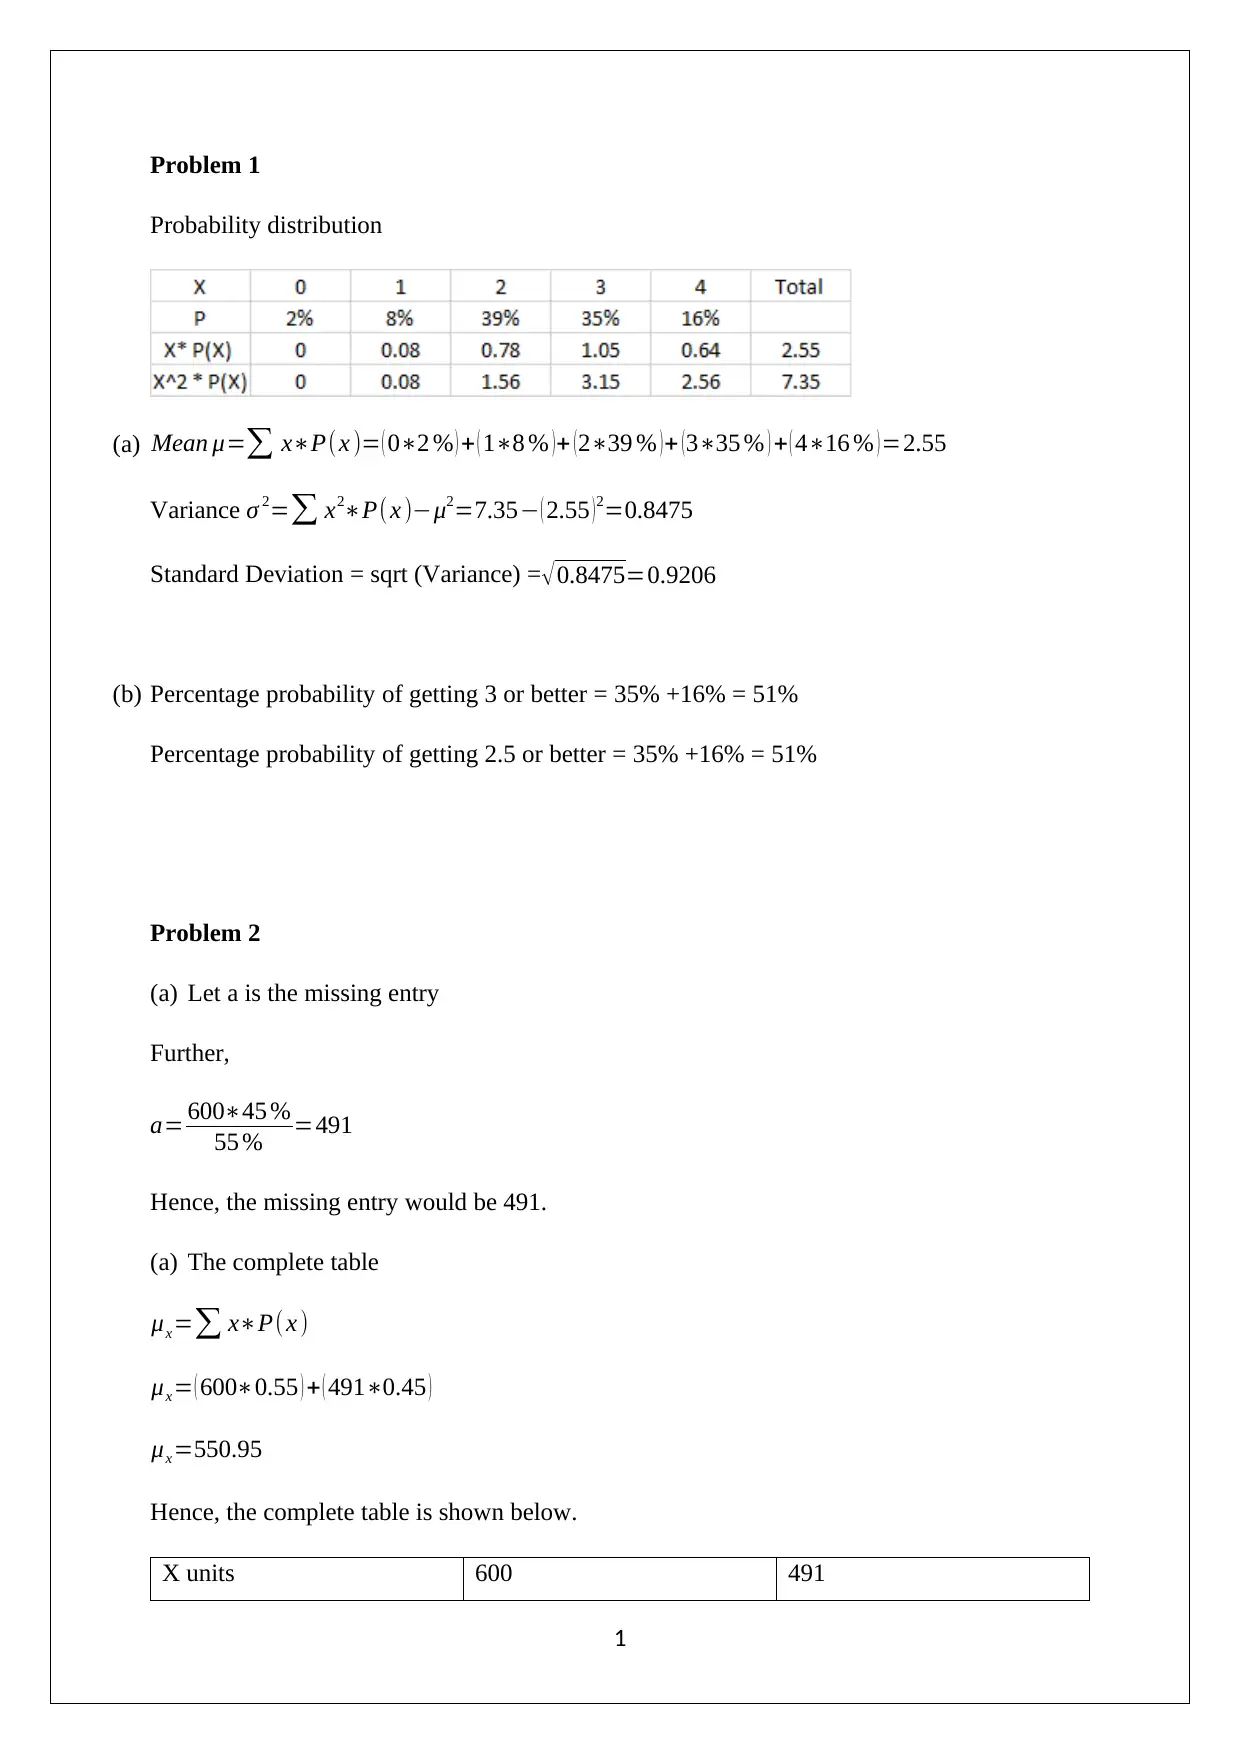
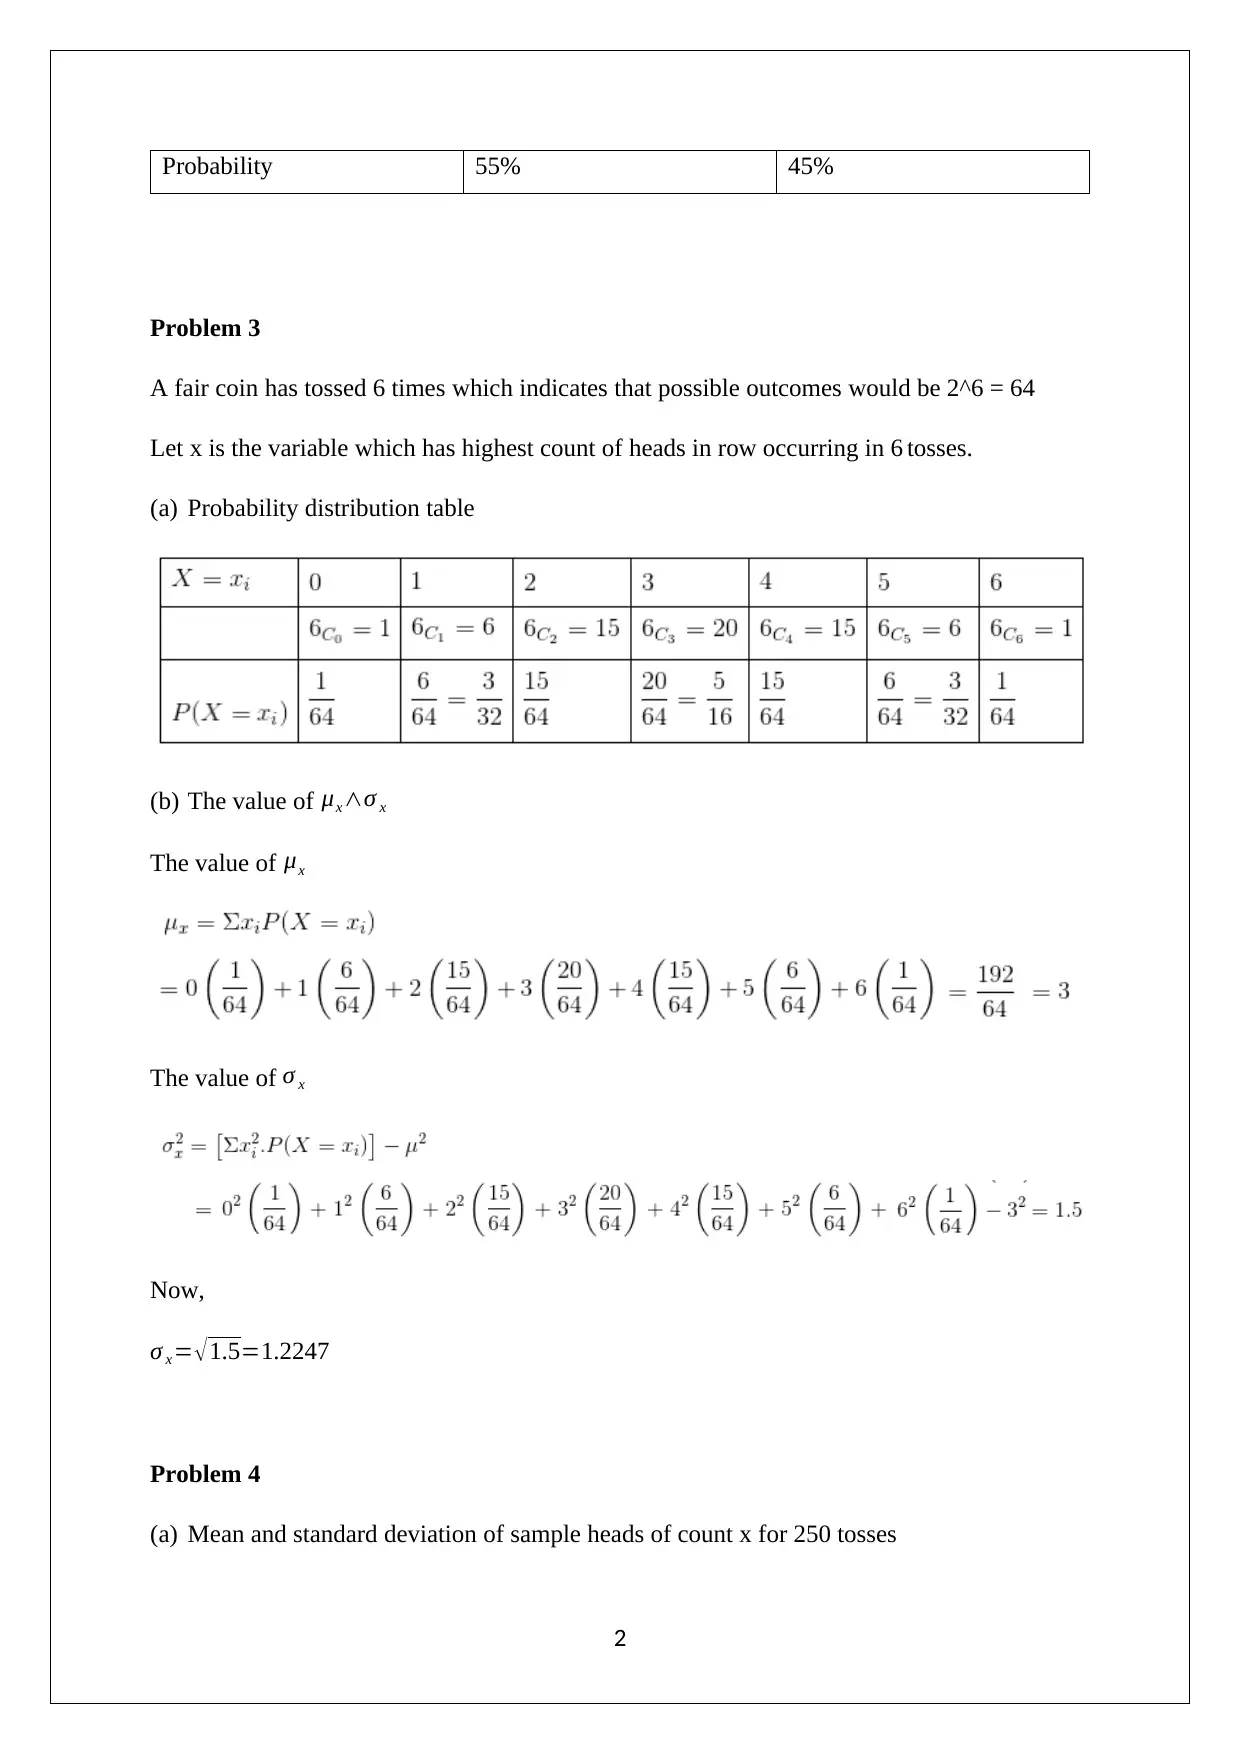
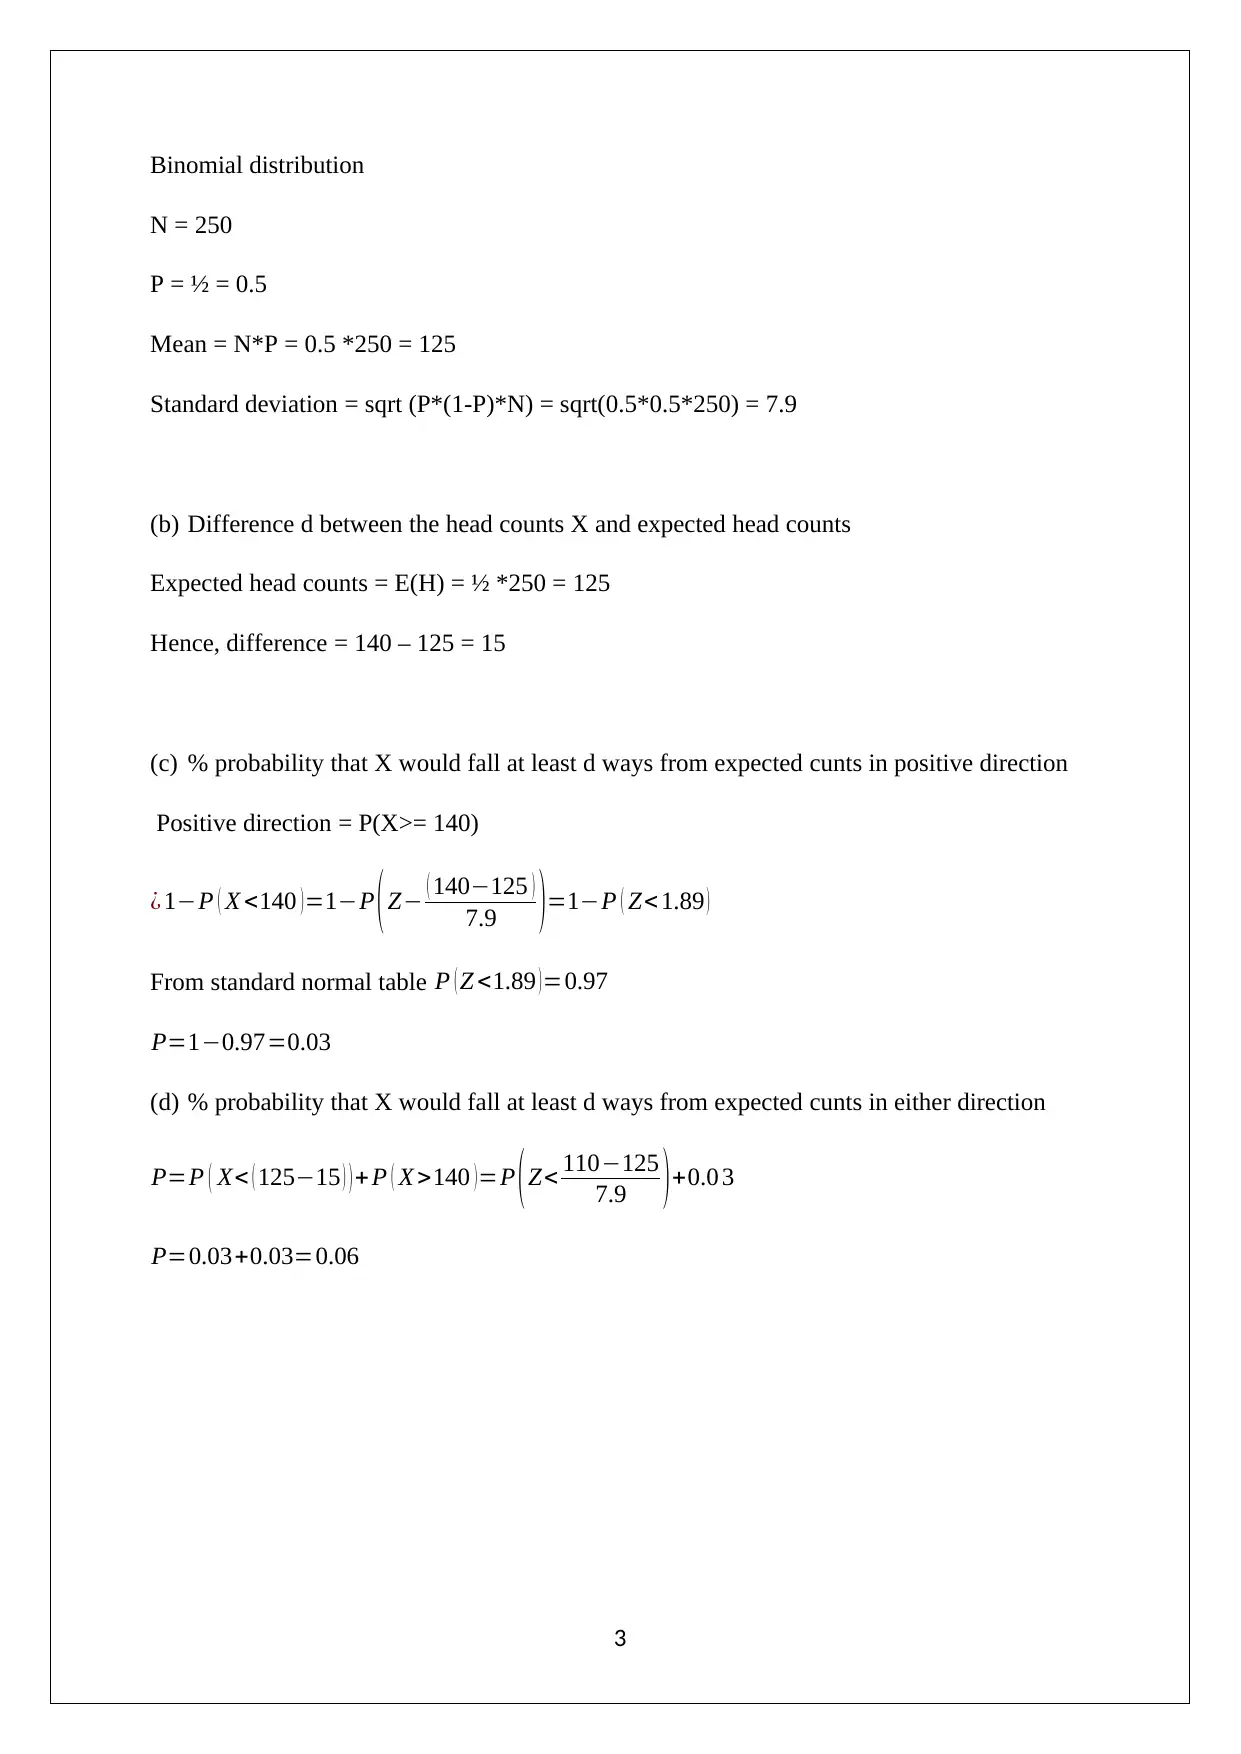
Homework Assignment
AI Summary
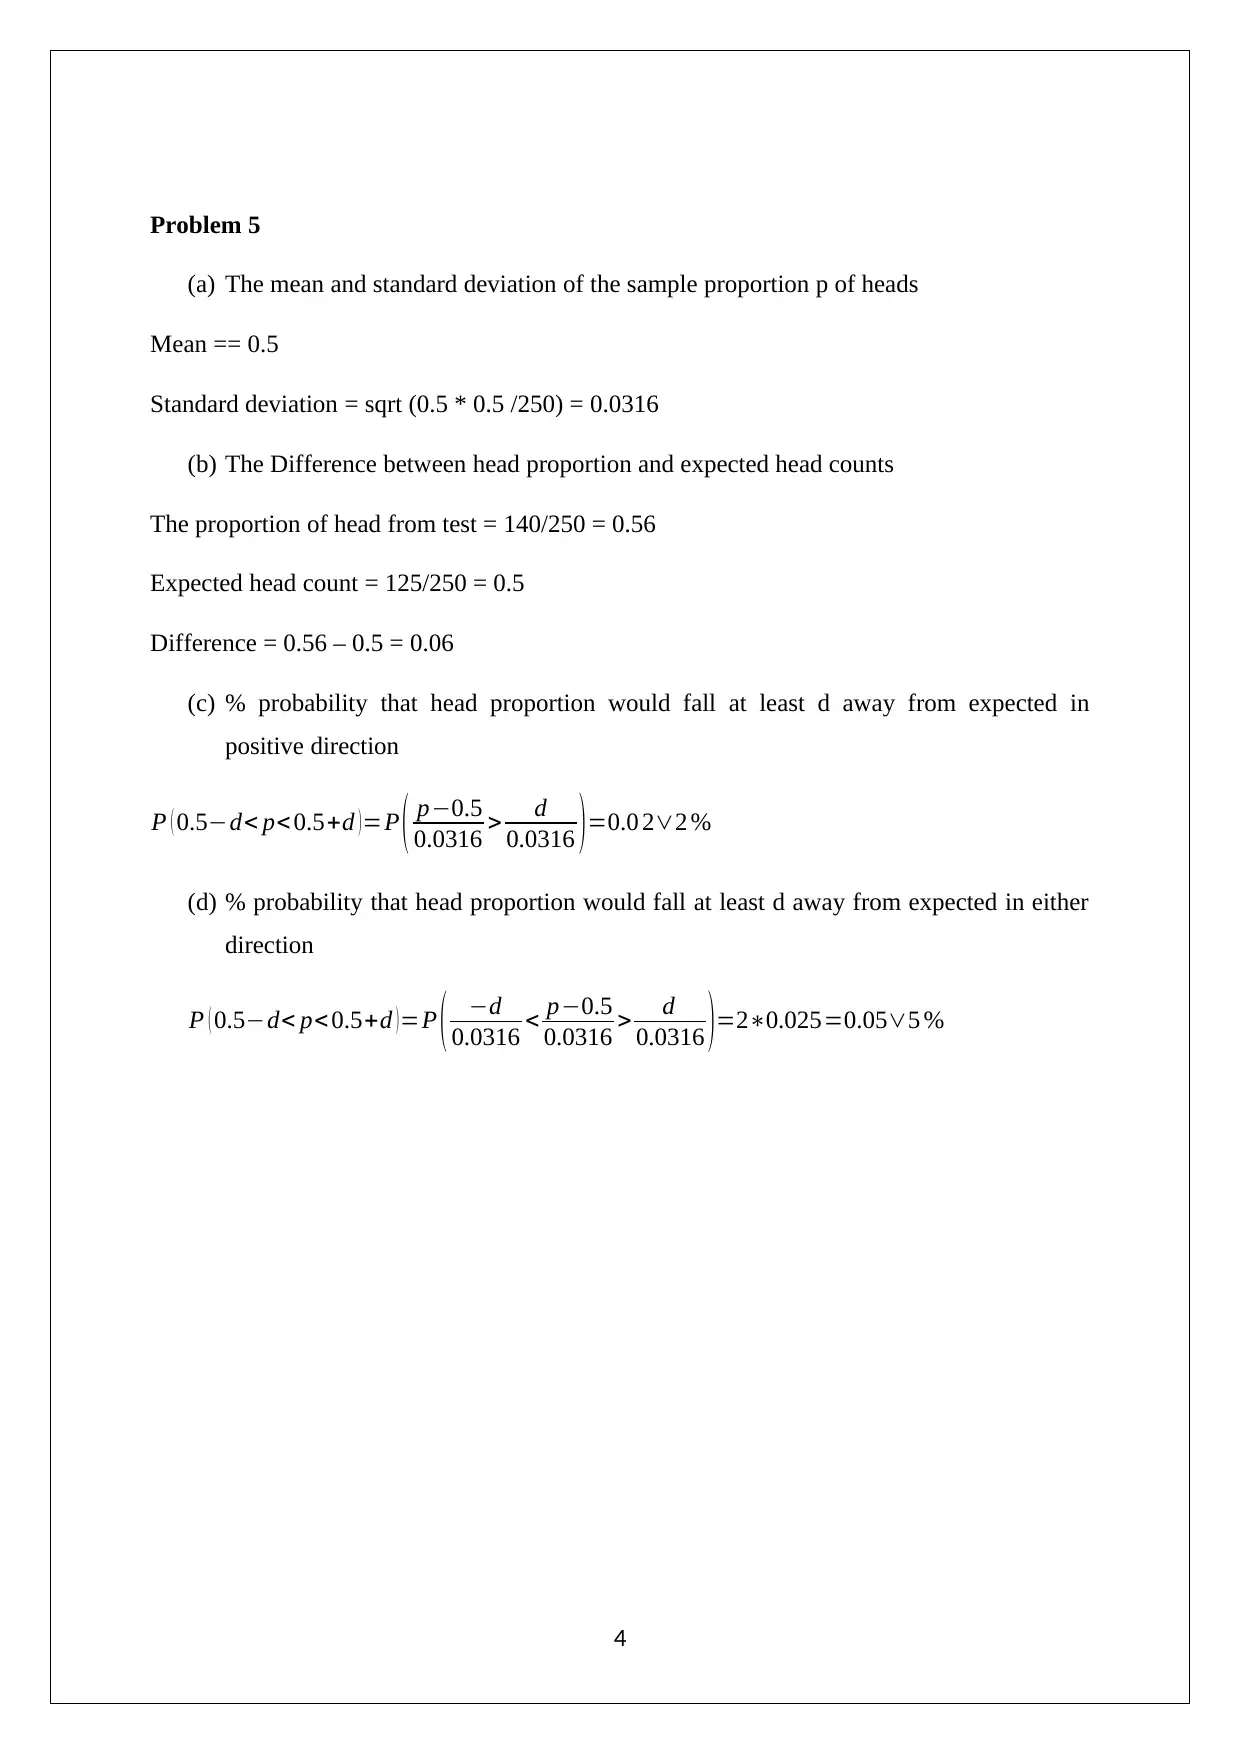
This MATH 243 assignment solution covers probability distributions, mean, variance, and standard deviation calculations. It includes problems related to finding missing entries in probability tables, analyzing coin toss experiments using binomial distribution, and calculating probabilities related to head counts. The solution also addresses sample proportions and their deviations from expected values, providing a comprehensive overview of statistical analysis concepts. Desklib offers this document, among others, to aid students in their studies.

1 out of 6


Your All-in-One AI-Powered Toolkit for Academic Success.
+13062052269
info@desklib.com
Available 24*7 on WhatsApp / Email
![[object Object]](/_next/static/media/star-bottom.7253800d.svg)
Copyright © 2020–2026 A2Z Services. All Rights Reserved. Developed and managed by ZUCOL.