MATH 2565 - Winter 2019 Assignment 4: Statistical Hypothesis Tests

Verified

Added on  2023/04/10

|2
|355
|341
Homework Assignment
AI Summary
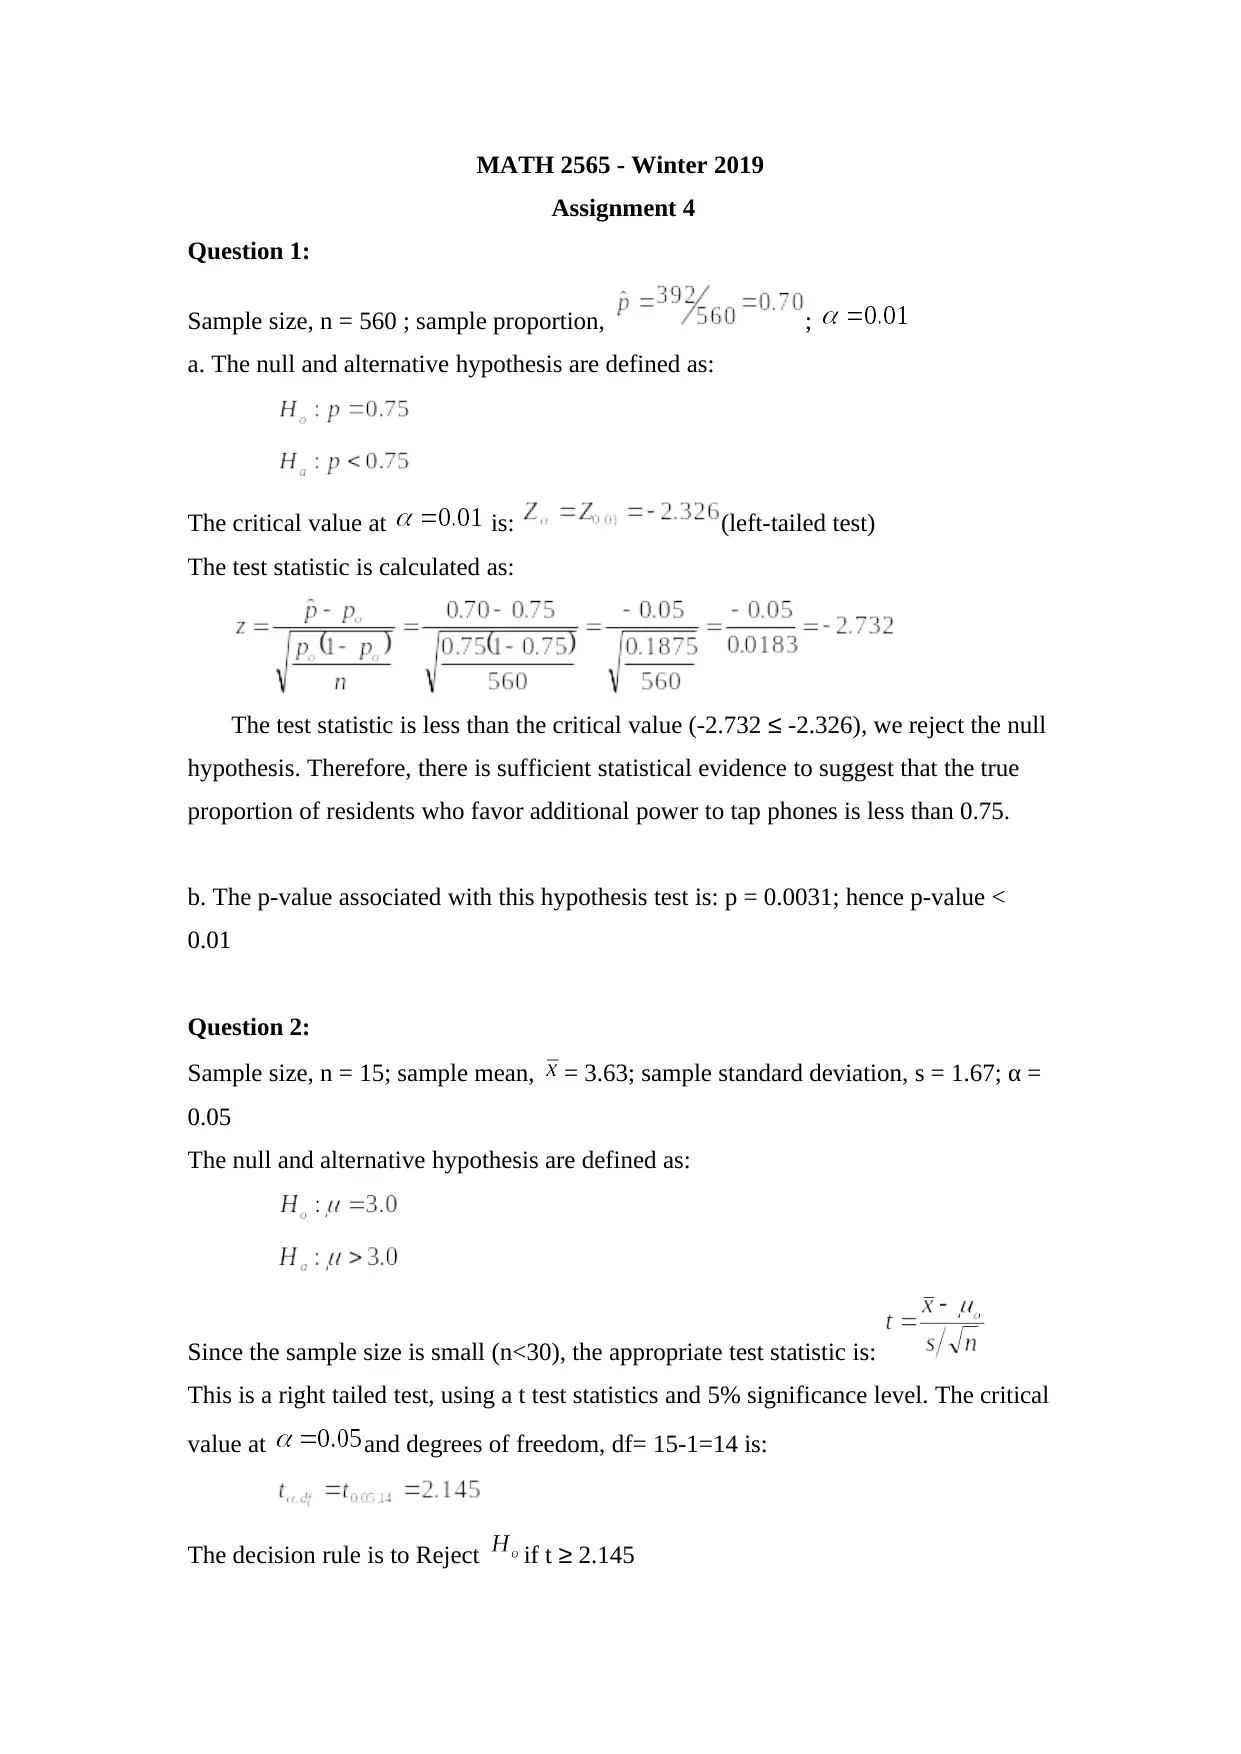
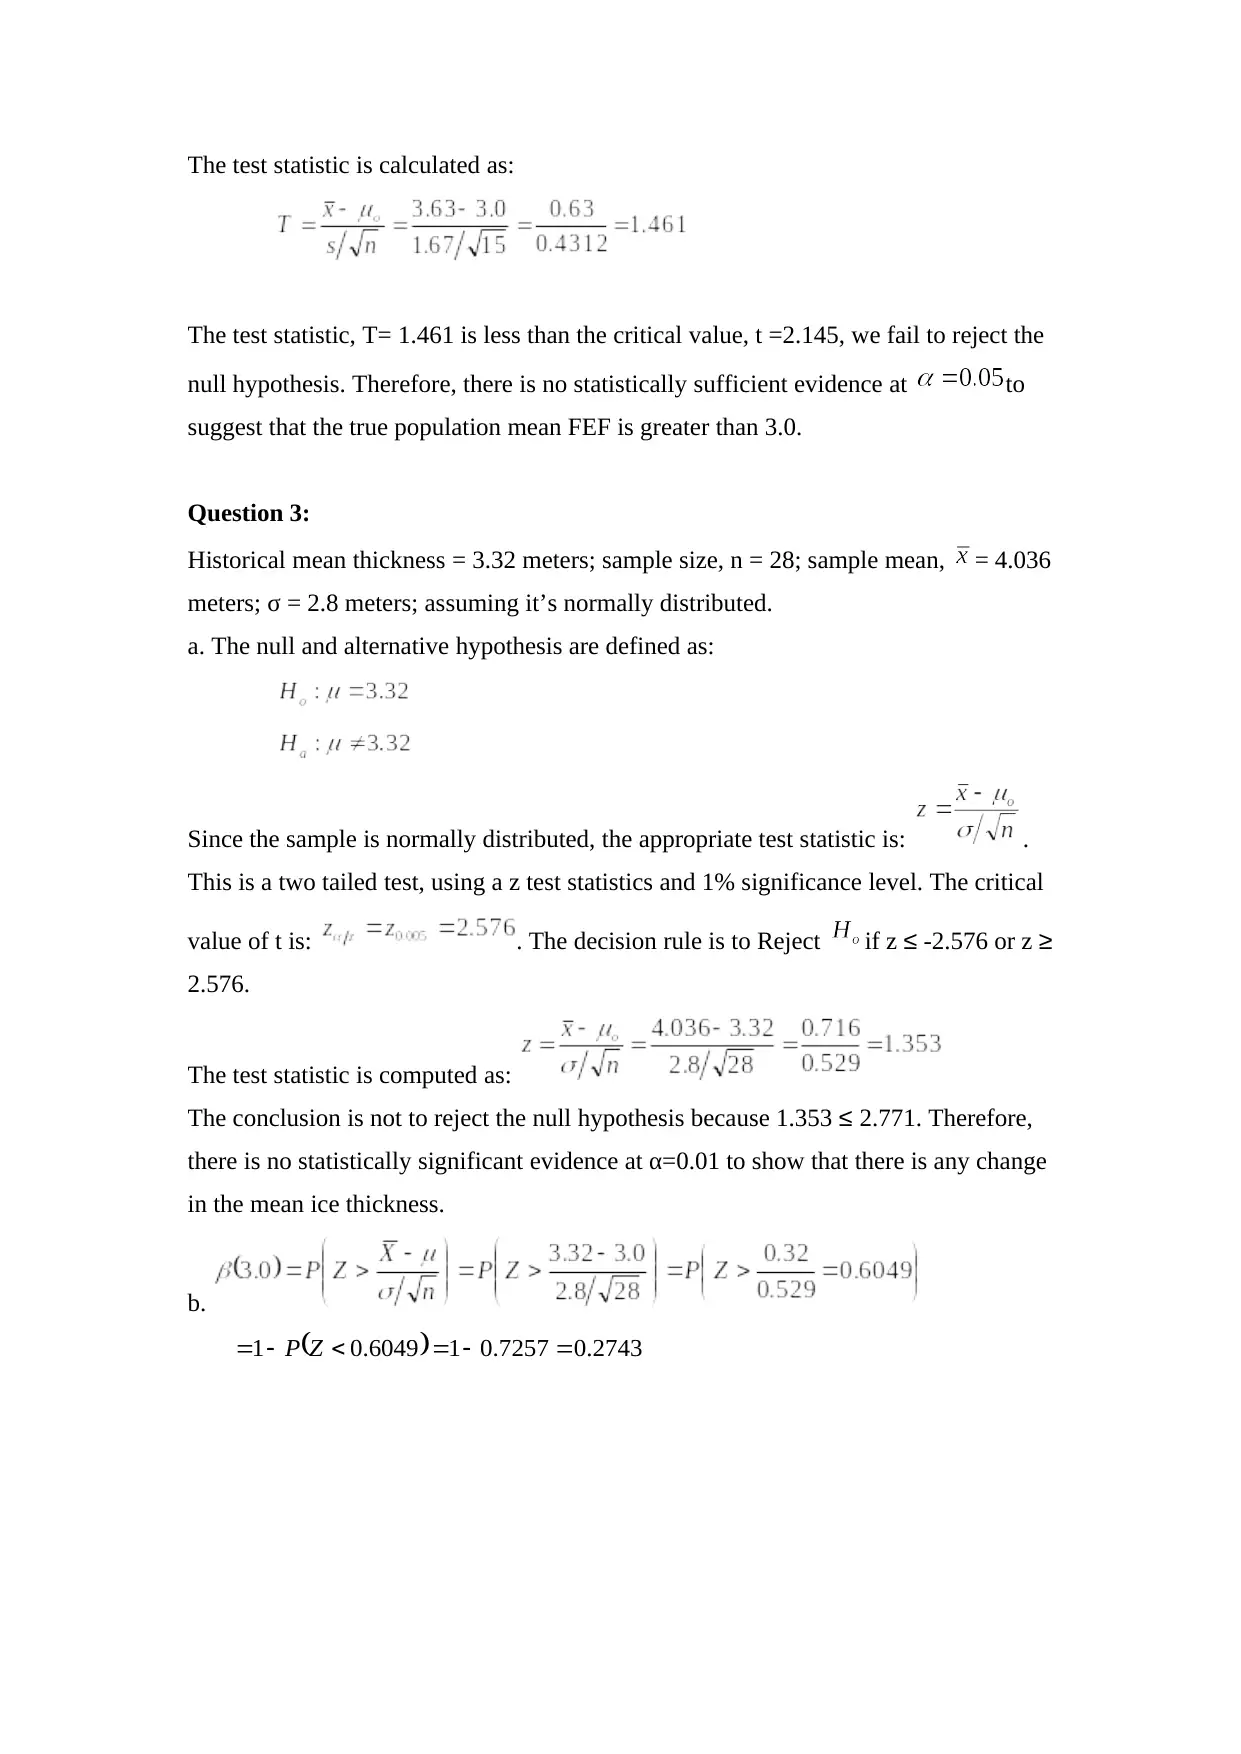
This assignment solution for MATH 2565 Winter 2019 Assignment 4 includes detailed answers to three questions related to hypothesis testing. Question 1 involves testing a claim about the proportion of residents favoring additional phone tapping powers, using a left-tailed z-test and calculating the p-value. Question 2 examines whether the true population mean Florida Energy Factor (FEF) is greater than 3.0, employing a right-tailed t-test due to the small sample size. Question 3 explores whether there's a change in mean ice thickness compared to historical data, using a two-tailed z-test. The solutions provide the null and alternative hypotheses, critical values, test statistics, decision rules, and conclusions for each question, determining whether to reject or fail to reject the null hypothesis based on the given significance levels. Desklib offers more solved assignments and study resources for students.
Document Page
MATH 2565 - Winter 2019
Assignment 4
Question 1:
Sample size, n = 560 ; sample proportion, ;
a. The null and alternative hypothesis are defined as:
The critical value at is: (left-tailed test)
The test statistic is calculated as:
The test statistic is less than the critical value (-2.732 -2.326), we reject the null
hypothesis. Therefore, there is sufficient statistical evidence to suggest that the true
proportion of residents who favor additional power to tap phones is less than 0.75.
b. The p-value associated with this hypothesis test is: p = 0.0031; hence p-value <
0.01
Question 2:
Sample size, n = 15; sample mean, = 3.63; sample standard deviation, s = 1.67; α =
0.05
The null and alternative hypothesis are defined as:
Since the sample size is small (n<30), the appropriate test statistic is:
This is a right tailed test, using a t test statistics and 5% significance level. The critical
value at and degrees of freedom, df= 15-1=14 is:
The decision rule is to Reject if t 2.145
tabler-icon-diamond-filled.svg

Paraphrase This Document

Need a fresh take? Get an instant paraphrase of this document with our AI Paraphraser
Document Page
The test statistic is calculated as:
The test statistic, T= 1.461 is less than the critical value, t =2.145, we fail to reject the
null hypothesis. Therefore, there is no statistically sufficient evidence at to
suggest that the true population mean FEF is greater than 3.0.
Question 3:
Historical mean thickness = 3.32 meters; sample size, n = 28; sample mean, = 4.036
meters; σ = 2.8 meters; assuming it’s normally distributed.
a. The null and alternative hypothesis are defined as:
Since the sample is normally distributed, the appropriate test statistic is: .
This is a two tailed test, using a z test statistics and 1% significance level. The critical
value of t is: . The decision rule is to Reject if z -2.576 or z
2.576.
The test statistic is computed as:
The conclusion is not to reject the null hypothesis because 1.353 2.771. Therefore,
there is no statistically significant evidence at α=0.01 to show that there is any change
in the mean ice thickness.
b.
2743.07257.016049.01 ZP
chevron_up_icon
1 out of 2
circle_padding
hide_on_mobile
zoom_out_icon
[object Object]