Mathematics for Construction: Task 2 and 3 Assignment Solution Details

Verified

Added on  2023/01/18

|29
|3606
|76
Homework Assignment
AI Summary
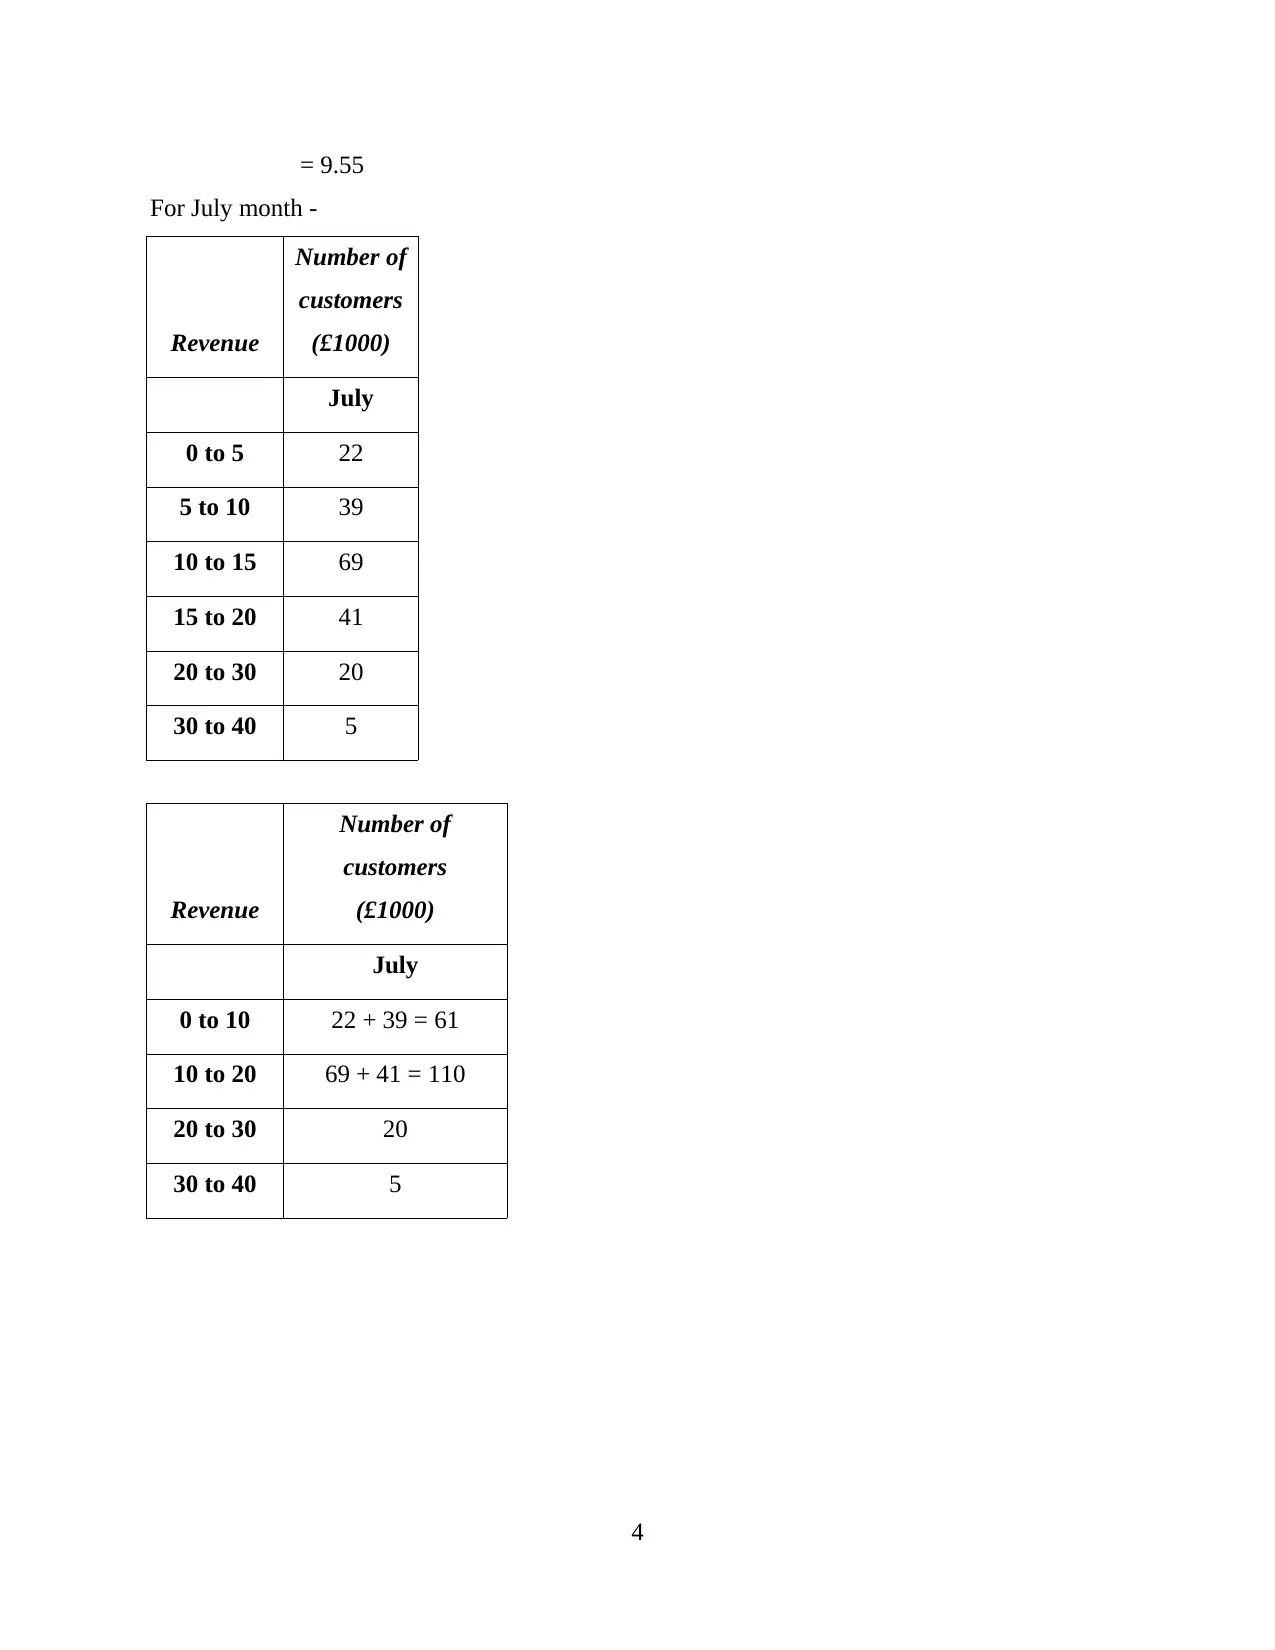
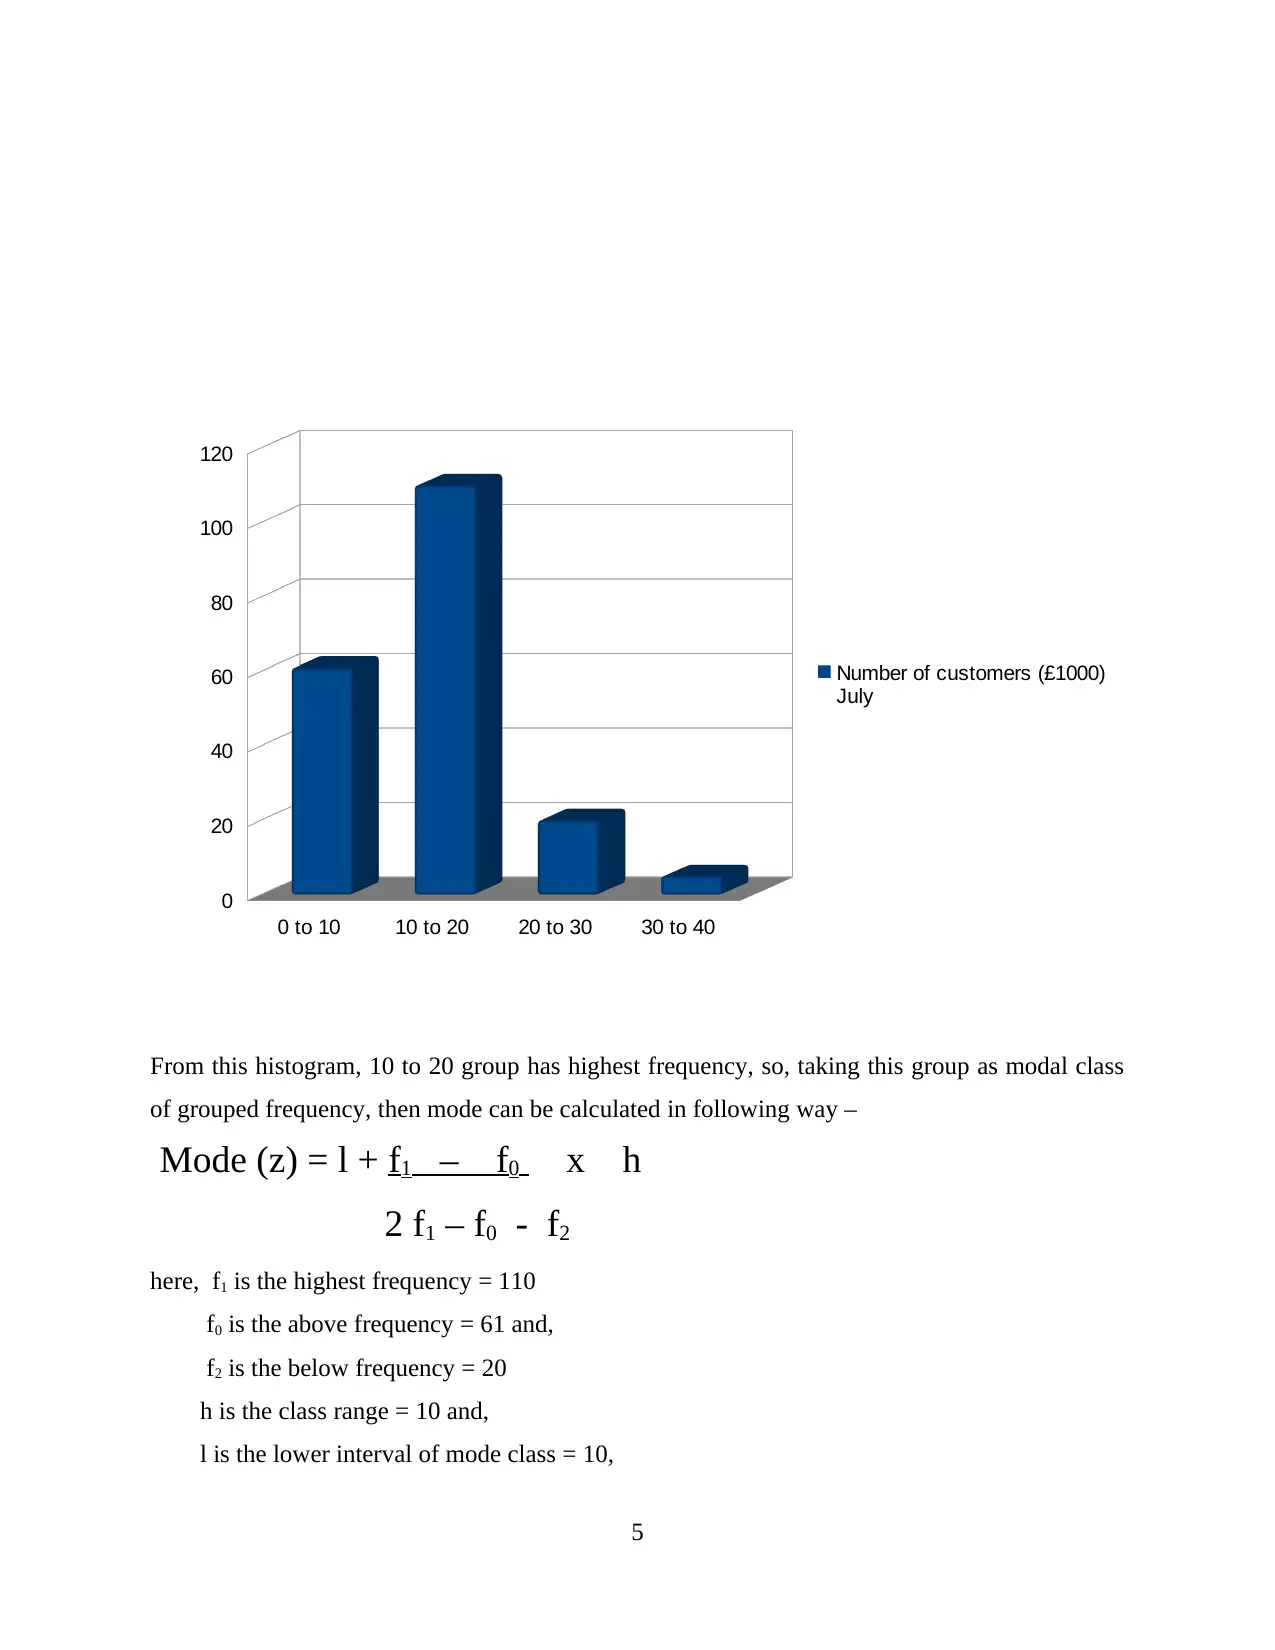
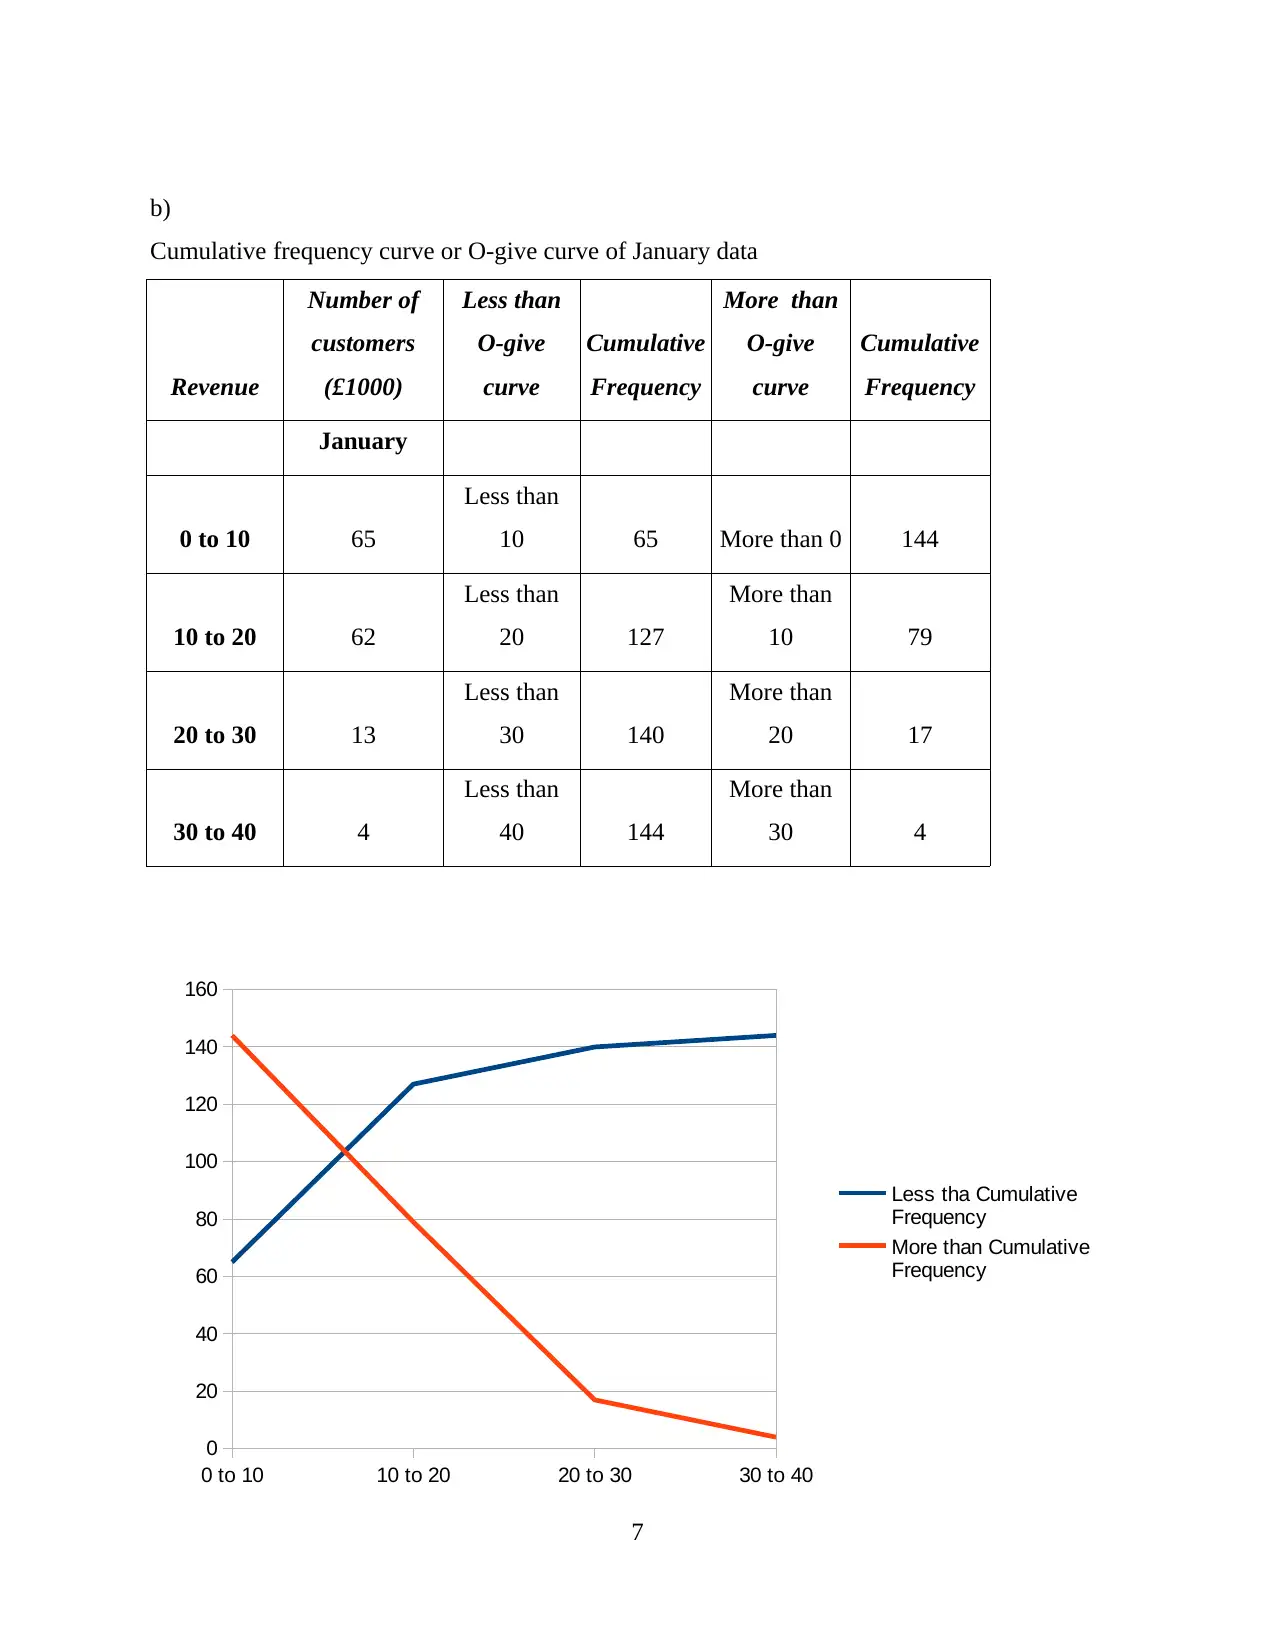
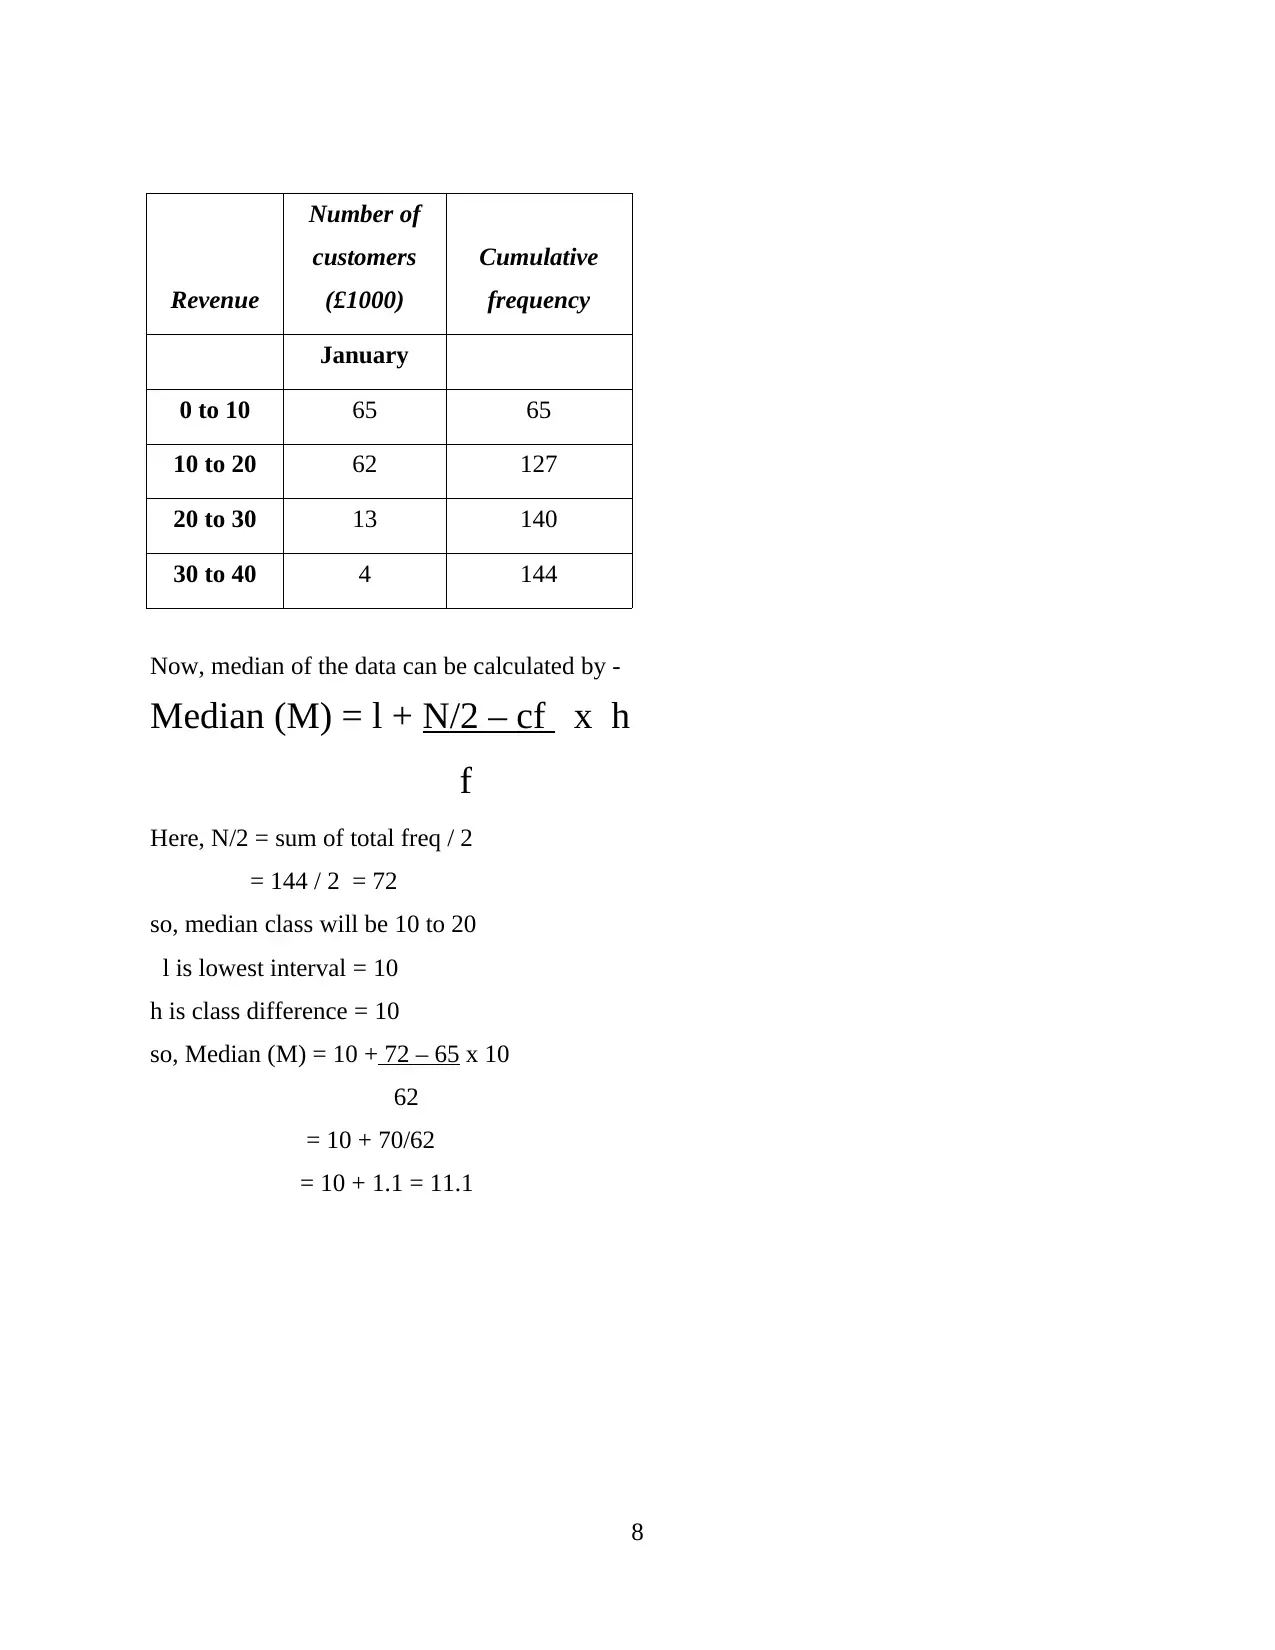
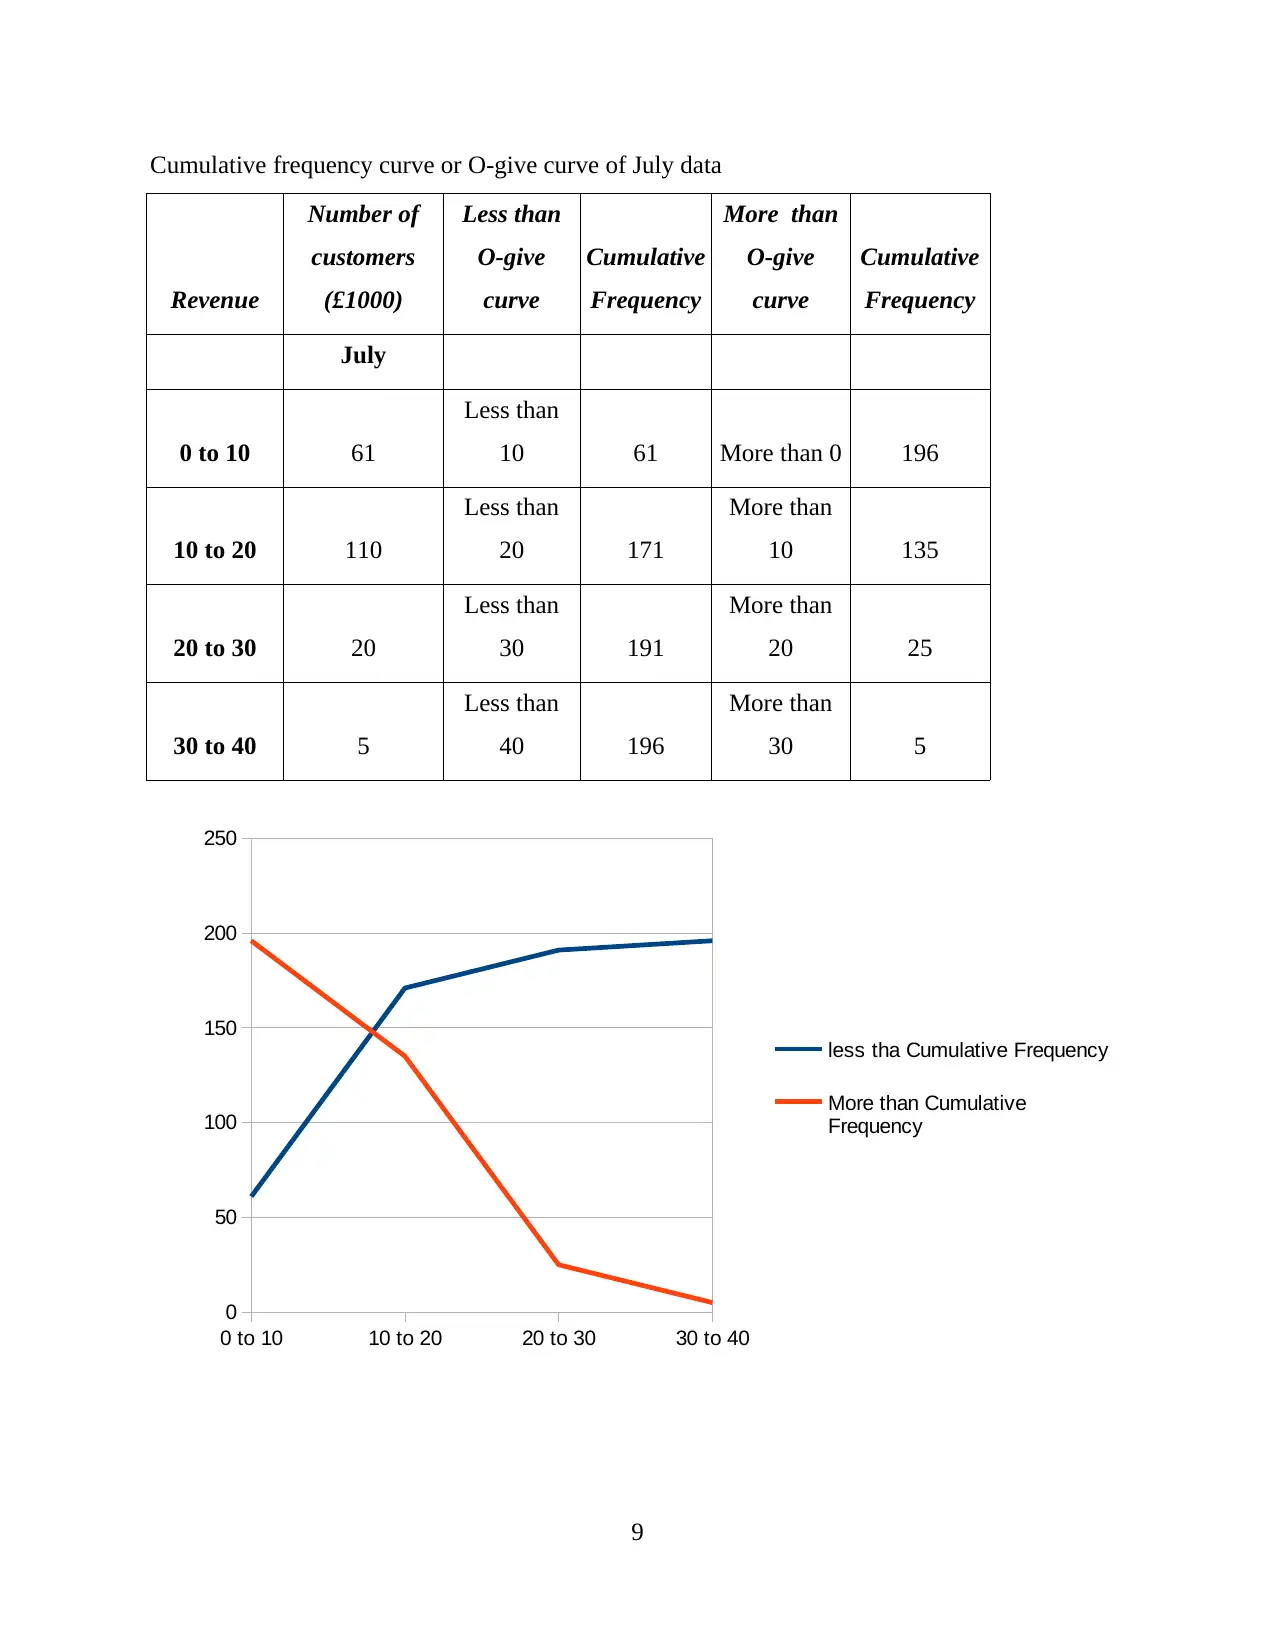
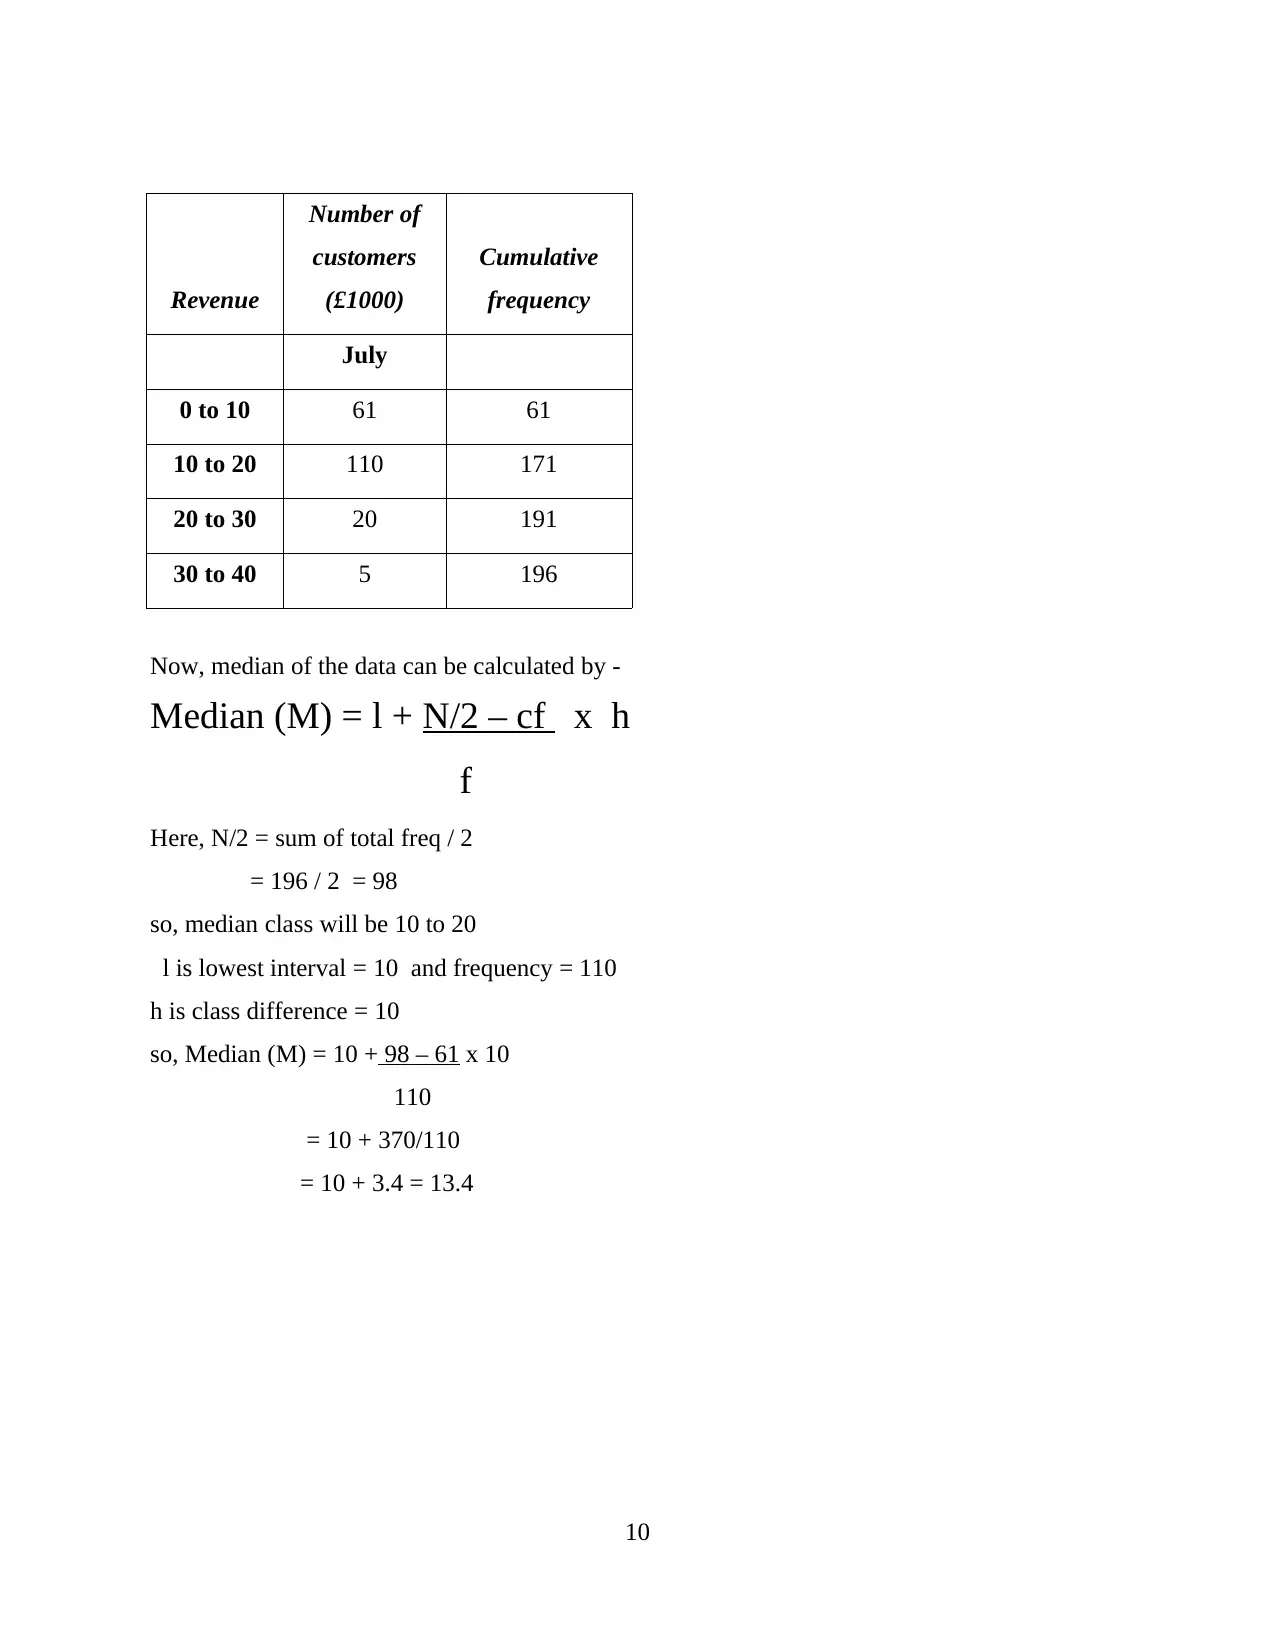
This document presents comprehensive solutions for a Mathematics for Construction assignment, specifically addressing Tasks 2 and 3. Task 2 involves analyzing revenue data, calculating mode, median, mean, and standard deviation for both January and July, utilizing histograms and cumulative frequency curves. It also includes a hypothesis test to determine if the mean bulb life is normally distributed and a hypothesis test to determine if the mean age of a population is 30 years. Task 3 focuses on wave equations, calculating amplitude, phase, periodic times, and frequency. It further determines the time taken by machines for displacement and uses compound angle formulas to expand the equations. The solutions are detailed, providing step-by-step calculations and explanations for each problem.
Document Page
8 Mathematics for Construction
tabler-icon-diamond-filled.svg

Paraphrase This Document

Need a fresh take? Get an instant paraphrase of this document with our AI Paraphraser
Document Page
Document Page
TASK 2
Scenario 1
Revenue Number of customers
(£1000)
January July
Less than 5 27 22
5 and less than 10 38 39
10 and less than 15 40 69
15 and less than 20 22 41
20 and less than 30 13 20
30 and less than 40 4 5
Solution
a) The given table can be organised in following manner -
Revenue Number of customers
(£1000)
January July
0 to 5 27 22
5 to 10 38 39
10 to 15 40 69
15 to 20 22 41
20 to 30 13 20
30 to 40 4 5
1
Document Page
Histogram of each distribution can be calculated after converting the unequal class interval
into equal class interval –
Revenue
Number of
customers
(£1000)
January
0 to 5 27
5 to 10 38
10 to 15 40
15 to 20 22
20 to 30 13
30 to 40 4
Equal class interval -
Revenue
Number of
customers
(£1000)
January
0 to 10 27 + 38 = 65
10 to 20 40 + 22 = 62
20 to 30 13
2
tabler-icon-diamond-filled.svg

Paraphrase This Document

Need a fresh take? Get an instant paraphrase of this document with our AI Paraphraser
Document Page
30 to 40 4
From this histogram, it has been analysed that group 0 to 10 has highest frequency, so, taking
this class to find mode of data of grouped frequency in following way –
Mode (z) = l + f1 f0 x h
2 f1 – f0 - f2
here, f1 is the highest frequency = 65
f0 is the above frequency = 0 and,
f2 is the below frequency = 62
h is the class range = 10 and,
l is the lower interval of mode class = 0,
so, mode can be calculated as -
Mode (z) = 0 + 65 – 0 x 10
2x65 – 0 – 62
= 0 + 65 x 10
130 – 62
= 0 + 650 / 68
3
0 to 10 10 to 20 20 to 30 30 to 40
0
10
20
30
40
50
60
70 65 62
13
4
Number of customers (£1000)
January
Document Page
= 9.55
For July month -
Revenue
Number of
customers
(£1000)
July
0 to 5 22
5 to 10 39
10 to 15 69
15 to 20 41
20 to 30 20
30 to 40 5
Revenue
Number of
customers
(£1000)
July
0 to 10 22 + 39 = 61
10 to 20 69 + 41 = 110
20 to 30 20
30 to 40 5
4
Document Page
From this histogram, 10 to 20 group has highest frequency, so, taking this group as modal class
of grouped frequency, then mode can be calculated in following way –
Mode (z) = l + f1 f0 x h
2 f1 – f0 - f2
here, f1 is the highest frequency = 110
f0 is the above frequency = 61 and,
f2 is the below frequency = 20
h is the class range = 10 and,
l is the lower interval of mode class = 10,
5
0 to 10 10 to 20 20 to 30 30 to 40
0
20
40
60
80
100
120
Number of customers (£1000)
July
tabler-icon-diamond-filled.svg

Paraphrase This Document

Need a fresh take? Get an instant paraphrase of this document with our AI Paraphraser
Document Page
so, mode can be calculated as -
Mode (z) = 10 + 110 – 61 x 10
2x110 – 61 – 20
= 10 + 49 x 10
220 – 81
= 10 + 490 / 139
= 13.5
6
Document Page
b)
Cumulative frequency curve or O-give curve of January data
Revenue
Number of
customers
(£1000)
Less than
O-give
curve
Cumulative
Frequency
More than
O-give
curve
Cumulative
Frequency
January
0 to 10 65
Less than
10 65 More than 0 144
10 to 20 62
Less than
20 127
More than
10 79
20 to 30 13
Less than
30 140
More than
20 17
30 to 40 4
Less than
40 144
More than
30 4
7
0 to 10 10 to 20 20 to 30 30 to 40
0
20
40
60
80
100
120
140
160
Less tha Cumulative
Frequency
More than Cumulative
Frequency
Document Page
Revenue
Number of
customers
(£1000)
Cumulative
frequency
January
0 to 10 65 65
10 to 20 62 127
20 to 30 13 140
30 to 40 4 144
Now, median of the data can be calculated by -
Median (M) = l + N/2 – cf x h
f
Here, N/2 = sum of total freq / 2
= 144 / 2 = 72
so, median class will be 10 to 20
l is lowest interval = 10
h is class difference = 10
so, Median (M) = 10 + 72 – 65 x 10
62
= 10 + 70/62
= 10 + 1.1 = 11.1
8
tabler-icon-diamond-filled.svg

Paraphrase This Document

Need a fresh take? Get an instant paraphrase of this document with our AI Paraphraser
Document Page
Cumulative frequency curve or O-give curve of July data
Revenue
Number of
customers
(£1000)
Less than
O-give
curve
Cumulative
Frequency
More than
O-give
curve
Cumulative
Frequency
July
0 to 10 61
Less than
10 61 More than 0 196
10 to 20 110
Less than
20 171
More than
10 135
20 to 30 20
Less than
30 191
More than
20 25
30 to 40 5
Less than
40 196
More than
30 5
9
0 to 10 10 to 20 20 to 30 30 to 40
0
50
100
150
200
250
less tha Cumulative Frequency
More than Cumulative
Frequency
Document Page
Revenue
Number of
customers
(£1000)
Cumulative
frequency
July
0 to 10 61 61
10 to 20 110 171
20 to 30 20 191
30 to 40 5 196
Now, median of the data can be calculated by -
Median (M) = l + N/2 – cf x h
f
Here, N/2 = sum of total freq / 2
= 196 / 2 = 98
so, median class will be 10 to 20
l is lowest interval = 10 and frequency = 110
h is class difference = 10
so, Median (M) = 10 + 98 – 61 x 10
110
= 10 + 370/110
= 10 + 3.4 = 13.4
10
chevron_up_icon
1 out of 29
circle_padding
hide_on_mobile
zoom_out_icon
[object Object]