Mathematics for Construction: Tasks 2 and 3 - Detailed Solutions

Verified

Added on  2023/01/18

|27
|3501
|40
Homework Assignment
AI Summary
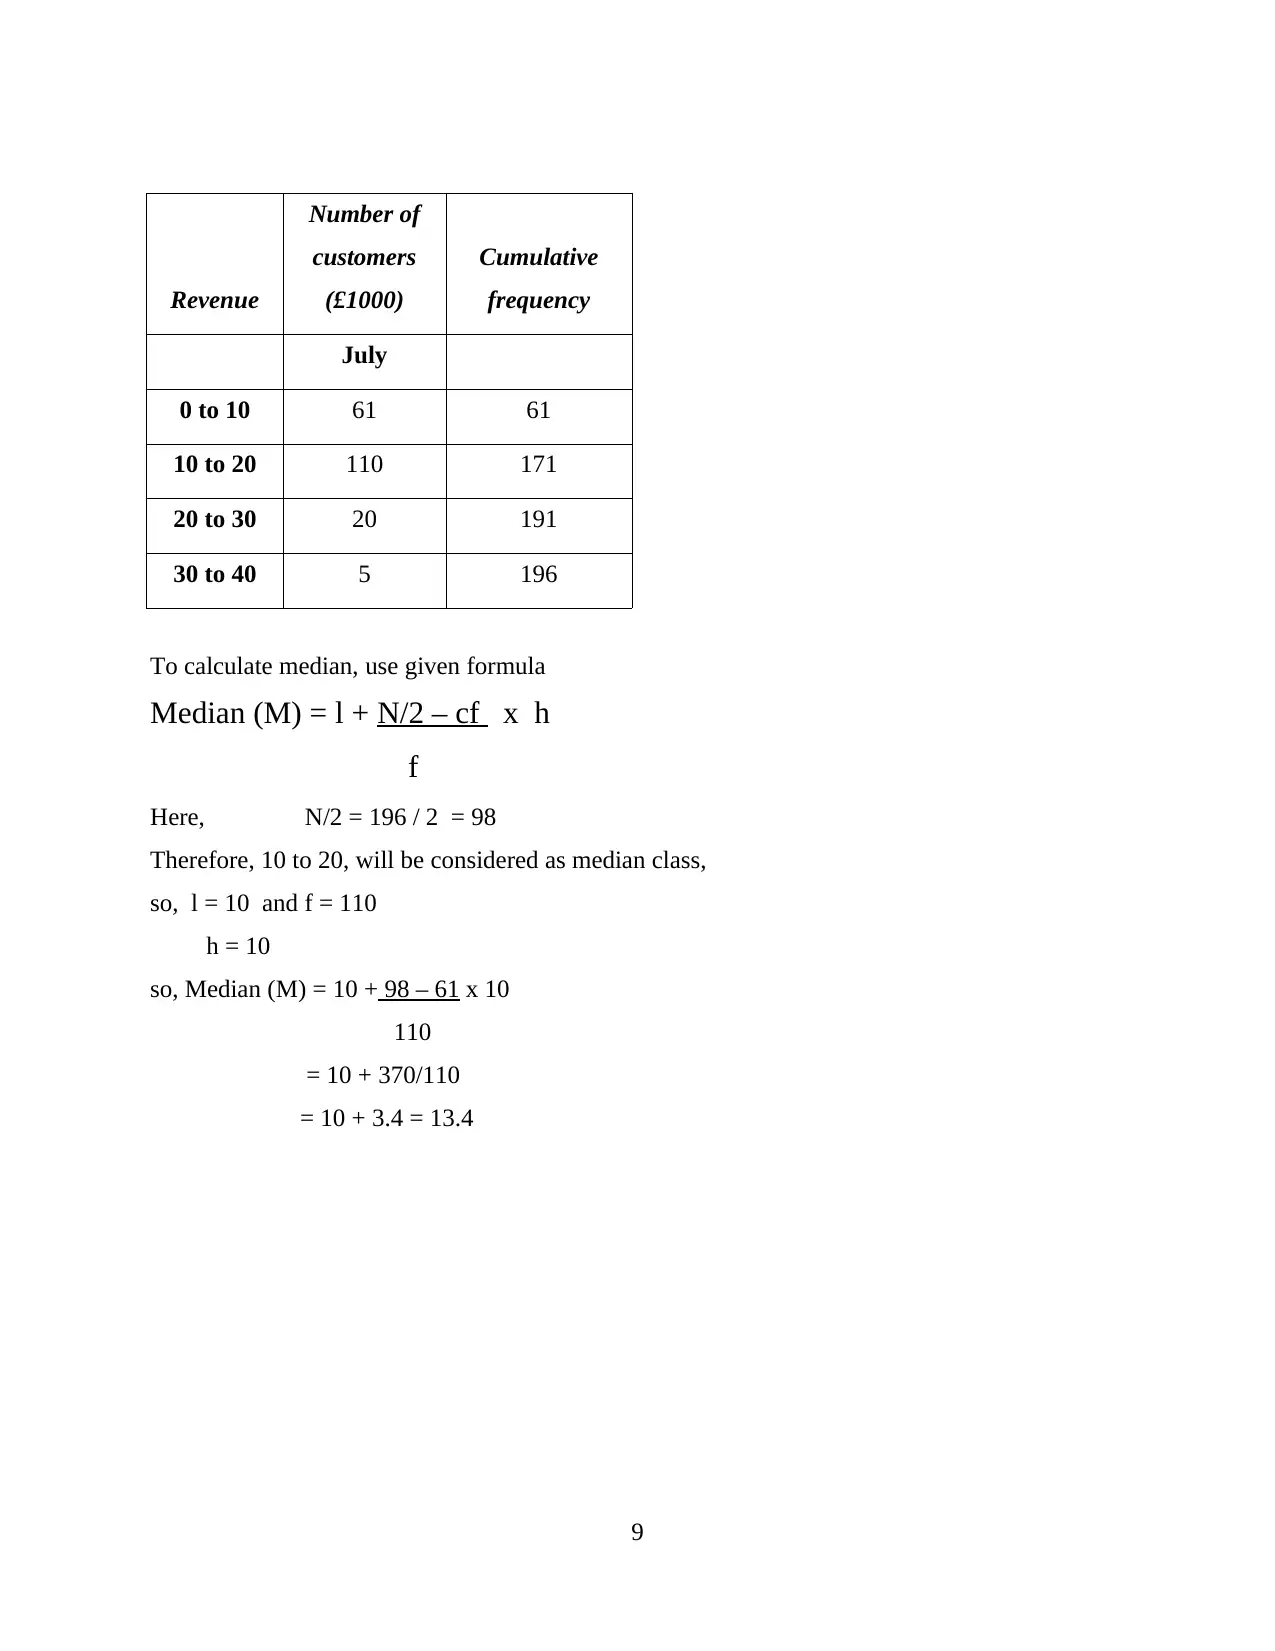
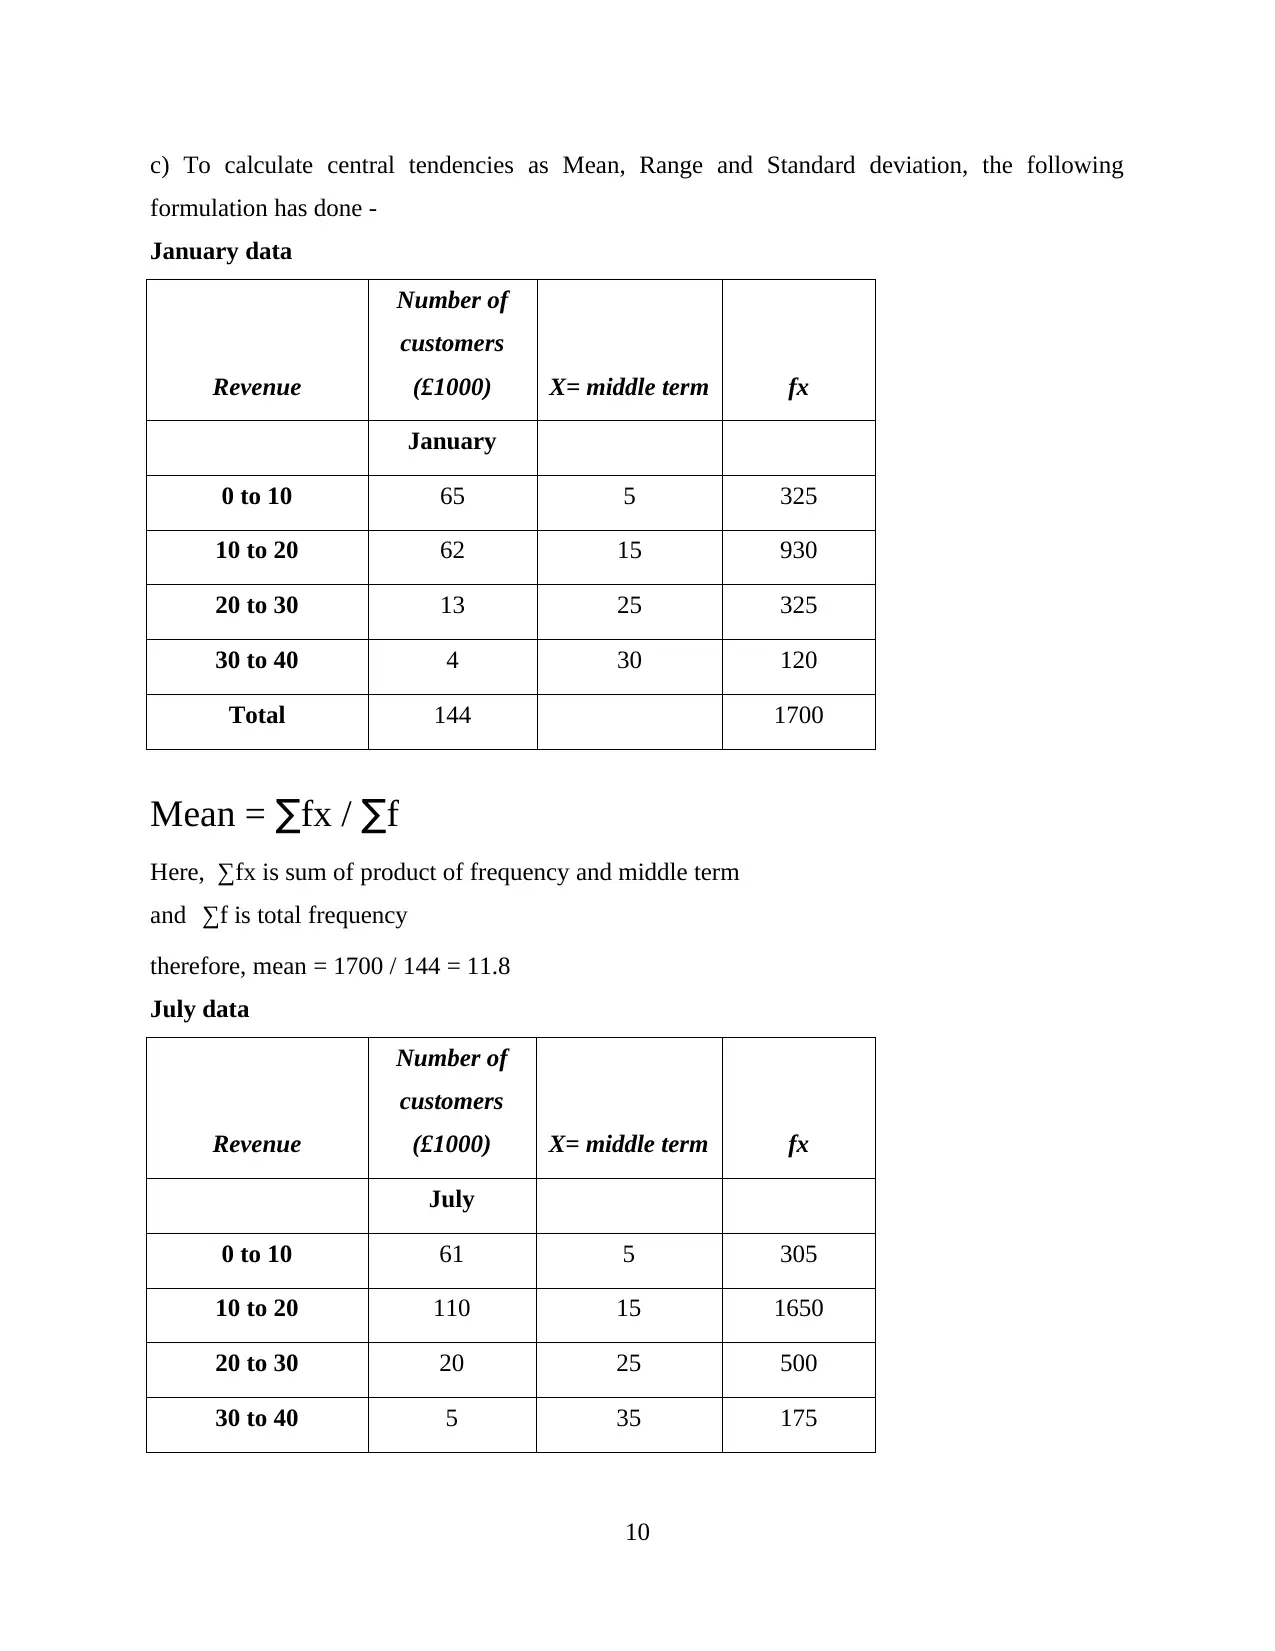
This document presents solutions for a mathematics assignment focused on construction applications. It begins with an analysis of revenue data, organizing it into grouped frequency distributions and constructing histograms to determine the mode for both January and July. Cumulative frequency curves (Ogive curves) are then created, and the median is calculated for both months. Central tendencies, including mean, range, and standard deviation, are also calculated. The assignment then moves on to hypothesis testing, using the normal distribution to analyze bulb life and a simple random sample to test population mean age. Finally, the solution explores wave equations, analyzing the displacement, amplitude, phase, periodic time, and frequency of two machines, and calculating the time taken for specific displacements using trigonometric functions and compound angle formulas. The document provides a comprehensive breakdown of each task, offering detailed calculations and explanations.
Document Page
8 Mathematics for Construction
tabler-icon-diamond-filled.svg

Paraphrase This Document

Need a fresh take? Get an instant paraphrase of this document with our AI Paraphraser
Document Page
Document Page
TASK 2
Scenario 1
Revenue Number of customers
(£1000)
January July
Less than 5 27 22
5 and less than 10 38 39
10 and less than 15 40 69
15 and less than 20 22 41
20 and less than 30 13 20
30 and less than 40 4 5
Firstly, organised the above table into grouped frequency in following manner -
Revenue Number of customers
(£1000)
January July
0 to 5 27 22
5 to 10 38 39
10 to 15 40 69
15 to 20 22 41
20 to 30 13 20
30 to 40 4 5
1
Document Page
Since, this table is not in regular interval of group, so convert it into equal grouped intervals by
combining first two rows then, second two rows as 0 – 10 and 10 – 20, so that all group ranges
from 10 in following way -
Equal class interval -
Revenue
Number of customers
(£1000)
January July
0 to 10 65 61
10 to 20 62 110
20 to 30 13 20
30 to 40 4 5
Now, to construct histogram of each and find other central tendencies, separate above table into
two categories, firstly for January and secondly to July -
Revenue
Number of customers
(£1000)
January
0 to 10 65
10 to 20 62
20 to 30 13
30 to 40 4
Revenue Number of customers
2
tabler-icon-diamond-filled.svg

Paraphrase This Document

Need a fresh take? Get an instant paraphrase of this document with our AI Paraphraser
Document Page
(£1000)
July
0 to 10 61
10 to 20 110
20 to 30 20
30 to 40 5
a) Histogram of January month -
Now, mode can be calculated by using following formula -
Mode (z) = l + f1 f0 x h
2 f1 – f0 - f2
here, f1 refers highest frequency, which is 65 as per above table
f0 refers to previous frequency from maximum, which is 0 and,
f2 is the next frequency, i.e. 62
3
0 to 10
10 to 20
20 to 30
30 to 40
0 10 20 30 40 50 60 70
Number of customers (£1000)
January
Document Page
h is the class difference = 10 and,
l is the lower-bound interval of mode class = 0,
so, mode can be calculated as -
Mode (z) = 0 + 65 – 0 x 10
2 x 65 – 0 – 62
= 0 + 65 x 10
130 – 62
= 0 + 650 / 68
= 9.55
a) Histogram of July month -
From this histogram, 10 to 20 group has highest frequency, so, taking this group as modal
class of grouped frequency, then mode can be calculated in following way –
Mode (z) = l + f1 f0 x h
2 f1 – f0 - f2
here, f1 = 110
4
0 to 10
10 to 20
20 to 30
30 to 40
0 20 40 60 80 100 120
Number of customers (£1000)
July
Document Page
f0 = 61 and,
f2 = 20
h = 10 and,
l = 10,
so, mode can be calculated as -
Mode (z) = 10 + 110 – 61 x 10
2x110 – 61 – 20
= 10 + 49 x 10
220 – 81
= 10 + 490 / 139
= 13.5
5
tabler-icon-diamond-filled.svg

Paraphrase This Document

Need a fresh take? Get an instant paraphrase of this document with our AI Paraphraser
Document Page
b)
Cumulative frequency curve of January data
Revenue
Number of
customers
(£1000)
Less than O-
give curve
Cumulati
ve
Frequenc
y
More than
O-give curve
Cumulative
Frequency
0 to 10 65 10 65 0 144
10 to 20 62 20 127 10 79
20 to 30 13 30 140 20 17
30 to 40 4 40 144 30 4
6
0 to 10 10 to 20 20 to 30 30 to 40
0
20
40
60
80
100
120
140
160
65
127
140 144144
79
17
4
Less tha Cumulative
Frequency
More than Cumulative
Frequency
Document Page
Revenue
Number of
customers
(£1000)
Cumulative
frequency
January
0 to 10 65 65
10 to 20 62 127
20 to 30 13 140
30 to 40 4 144
Now, median of the data can be calculated by -
Median (M) = l + N/2 – cf x h
f
Here, N/2 = sum of total freq / 2
= 144 / 2 = 72
so, median class will be 10 to 20
l is lowest interval = 10
h is class difference = 10
so, Median (M) = 10 + 72 – 65 x 10
62
= 10 + 70/62
= 10 + 1.1 = 11.1
7
Document Page
Cumulative frequency curve or O-give curve of July data
Revenue
Number of
customers
(£1000)
Less than
O-give
curve
Cumulative
Frequency
More than
O-give
curve
Cumulative
Frequency
0 to 10 61 10 61 0 196
10 to 20 110 20 171 10 135
20 to 30 20 30 191 20 25
30 to 40 5 40 196 30 5
8
0 to 10 10 to 20 20 to 30 30 to 40
0
50
100
150
200
250
61
171
191 196196
135
25
5
less tha Cumulative Frequency
More than Cumulative
Frequency
tabler-icon-diamond-filled.svg

Paraphrase This Document

Need a fresh take? Get an instant paraphrase of this document with our AI Paraphraser
Document Page
Revenue
Number of
customers
(£1000)
Cumulative
frequency
July
0 to 10 61 61
10 to 20 110 171
20 to 30 20 191
30 to 40 5 196
To calculate median, use given formula
Median (M) = l + N/2 – cf x h
f
Here, N/2 = 196 / 2 = 98
Therefore, 10 to 20, will be considered as median class,
so, l = 10 and f = 110
h = 10
so, Median (M) = 10 + 98 – 61 x 10
110
= 10 + 370/110
= 10 + 3.4 = 13.4
9
Document Page
c) To calculate central tendencies as Mean, Range and Standard deviation, the following
formulation has done -
January data
Revenue
Number of
customers
(£1000) X= middle term fx
January
0 to 10 65 5 325
10 to 20 62 15 930
20 to 30 13 25 325
30 to 40 4 30 120
Total 144 1700
Mean = fx / f
Here, ∑fx is sum of product of frequency and middle term
and ∑f is total frequency
therefore, mean = 1700 / 144 = 11.8
July data
Revenue
Number of
customers
(£1000) X= middle term fx
July
0 to 10 61 5 305
10 to 20 110 15 1650
20 to 30 20 25 500
30 to 40 5 35 175
10
chevron_up_icon
1 out of 27
circle_padding
hide_on_mobile
zoom_out_icon
[object Object]