Mathematics Application in COVID-19 Pandemic Reporting Analysis Report
VerifiedAdded on 2022/09/26
|16
|3085
|20
Report
AI Summary
This report critically examines the application of mathematics, specifically rates and percentages, in the reporting of the COVID-19 pandemic. It discusses how these mathematical concepts can both inform and potentially obscure facts, illustrated through hypothetical scenarios and contextualized cases for Australia and China. The analysis highlights how the presentation of rates and percentages can influence the perception of fatalities. Furthermore, the report includes a detailed lesson plan designed for Grade 5 and 6 students. The lesson plan focuses on educating students about the COVID-19 pandemic, teaching them to apply the concepts of rates and percentages, and understand their role in the pandemic's reporting within the contexts of Australia and China. The lesson plan incorporates various activities and resources to facilitate student learning and critical thinking about current events and numeracy.
MATHEMATICS APPLICATION IN THE REPORTING OF THE COVID-19 PANDEMIC
Student Name
Student Number
Code + Name of Course
Professor’s Name
University
State
Date
Student Name
Student Number
Code + Name of Course
Professor’s Name
University
State
Date
Paraphrase This Document
Need a fresh take? Get an instant paraphrase of this document with our AI Paraphraser
Mathematics Application in the Reporting of the COVID-19 Pandemic
Executive Summary
The purpose of this paper is to conduct a critical discussion on the application of
mathematics in the reporting of a current issue, for this case the COVID-19 Pandemic, and
develop a lesson plan on the same. The paper considers the application of rates and percentages
concepts in the informing and/or obscuring of facts relating to the COVID-19 Pandemic in a
hypothetical case followed by a contextualized case for Australia and China. The analyses in the
paper reveal the possibility of the use of rates and percentages to obscure the extent of fatalities
due to the COVID-19 Pandemic in instances where proper contextualization of the figures is not
provided. The lesson plan is then designed around activities that will present the learners with
general information on the COVID-A9 Pandemic and the application of the mathematical
concepts of rates and percentages in its reporting in Australia and China.
2
Mathematics Application in the Reporting of the COVID-19 Pandemic
Contents
Introduction.................................................................................................................................................4
Application of Mathematics in the COVID-19 Pandemic Reporting...........................................................4
Contextualization for the case of COVID-19 Pandemic in Australia...........................................................8
Lesson Plan.................................................................................................................................................9
References.................................................................................................................................................16
3
⊘ This is a preview!⊘
Do you want full access?
Subscribe today to unlock all pages.
Trusted by 1+ million students worldwide
Mathematics Application in the Reporting of the COVID-19 Pandemic
Introduction
The Corona Virus 2019 (COVID-19) is a virus that attacks the respiratory system and is
caused by SARS COV-2 (Severe Acute Respiratory Syndrome Corona Virus 2) (Cennimo,
2020). The origin of the disease in the city of Wuhan in the Chinese province of Hubei. The
symptoms of the COVID-19 include high fever, dry through, sneezing, shortness of breath, chest
tightness, loss of sense of smell and loss of sense of taste (Cennimo, 2020). The disease is
transmittable from person-person through droplets from the cough or sneeze of an infected
person.
The COVID-19 disease was initially classified as an epidemic during its outbreak in the
city of Wuhan in the Chinese province of Hubei. An epidemic refers to an outbreak of a disease
in a given locality (geographic or otherwise), with the spread of the disease being limited to the
given area very minimal chances of its spread outside that locality (Ann & Patty, 2016).
However, the COVID-19 disease was later classified as a global pandemic with the spread
moving from the city of Wuhan, and China as a whole to other countries and continents around
the world. A pandemic refers to an outbreak of a disease in a wide region (geographical or
otherwise), with the spread of the disease being rampant and high chances of its spread outside
its area of origin (epicenter) (MacBride & Tietze, 2018).
Application of Mathematics in the COVID-19 Pandemic Reporting
The reporting of the COVID-19 Pandemic as is with other outbreaks of diseases is highly
reliant on mathematics to assist in the communication of the spread of the disease to the public.
The application of mathematics in the reporting of the COVID-19 Pandemic ranges from basic
4
Paraphrase This Document
Need a fresh take? Get an instant paraphrase of this document with our AI Paraphraser
Mathematics Application in the Reporting of the COVID-19 Pandemic
arithmetic (which include the count of the number of infected persons or fatalities resulting from
the COVID-19 disease) to complex mathematical modelling approaches (which include
predictive modelling to determine the projected number of cases and fatalities at given times in
the future).
In this instance, two mathematical concepts, which can be considered as mid-range, are
going to be considered for the critical discussion of the reporting of the COVID-19 pandemic.
These mathematical concepts are Rates and Percentages. Rates are mathematical measures that
represent the ratio between two values that are related, with different measurements (units)
(Howitt & Cramer, 2010; O'Neil & Schutt, 2013). A general example of the application of rates
is in the computation of speed. Speed is commonly given by either miles travelled per hour or
kilometers travelled per hour (Everitt & Skrondal, 2010; Keller, 2015). This is a ratio of two
values: Distance and Time, with the two values having different measurements (miles/
kilometers and hours respectively), hence making it a rate.
In the case of the COVID-19 Pandemic reporting, different rates are presented to
represent the state of the pandemic. These rates include deaths per million and deaths per cases
as the mostly used for the reporting. Deaths per million refers to the number of deaths attributed
to a disease for every million people in a population (say country) (Mayer-Davis, et al., 2010;
Farhat, Martins, & Swanson, 2013). For the COVID-19 Pandemic case, the deaths per million
rate would represent the number of people that have died due to the COVID-19 disease for every
one million people in a population. Deaths per cases can be defined as the number of deaths
attributed to a disease out of the population of individuals infected by the disease (Sven, Stephan,
& Boppel, 2011). For the case of the COVID-19 Pandemic case, the deaths per cases rate would
5
Mathematics Application in the Reporting of the COVID-19 Pandemic
represent the number of people that have died due to the COVID-19 disease out of the population
of individuals that have been infected by the COVID-19 Pandemic.
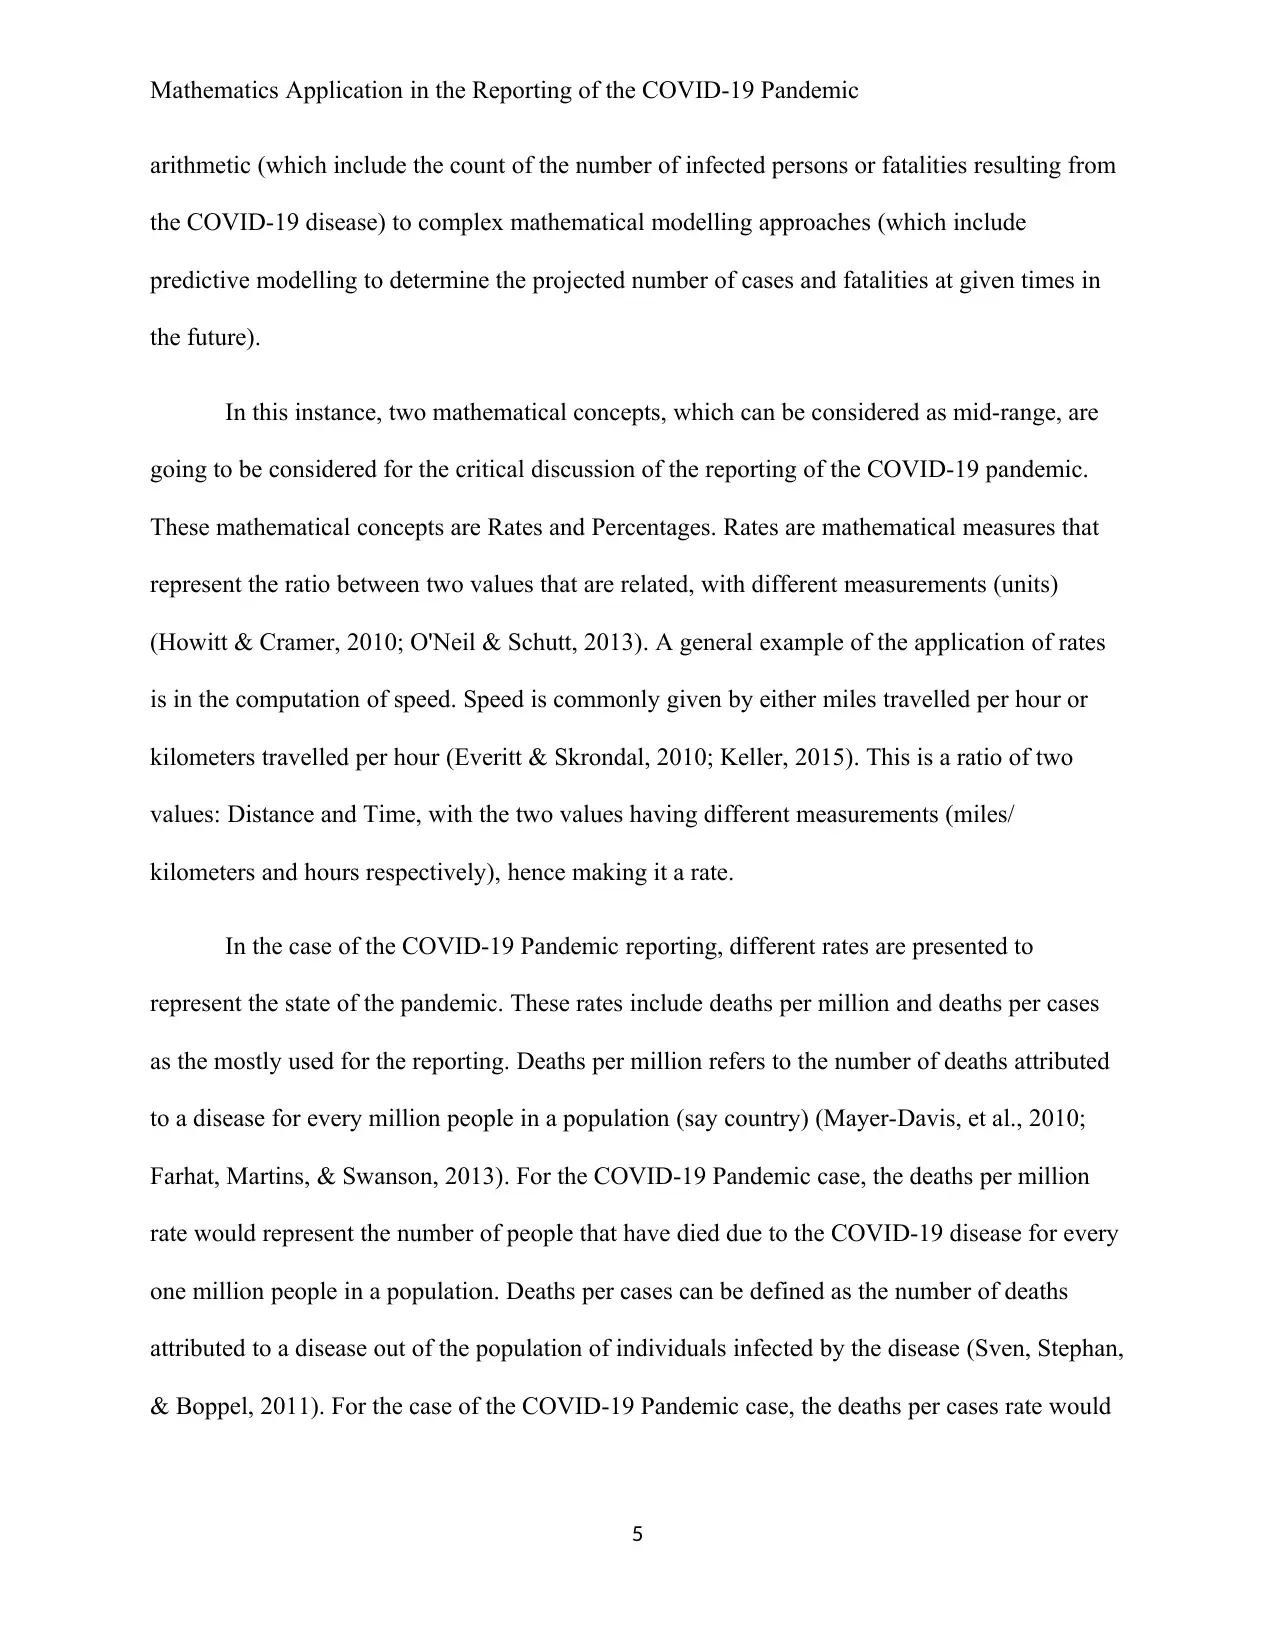
To illustrate the difference between the deaths per million rate and the deaths per cases
rate, consider a hypothetical city of 5 million residents that has reported 10 000 cases with 500
fatalities for the COVID-19 Pandemic. The table below, Table 1: Rates (Hypothetical Case)
gives the results of the deaths per million and deaths per cases rates. From the table, we note that
reporting the deaths per million would translate to fatalities due to the COVID-19 disease being
1 in every 10 000 people in the city. On the other hand, also from the table, we note that
reporting the deaths per cases would translate to fatalities due to the COVID-19 disease being 5
in every 100 people in the city. Without proper contextualization, the figures may serve to
obscure if interest is in exaggerating the pandemic by reporting the deaths per cases rates or
understating the pandemic by reporting the deaths per million rates.
Table 1: Rates (Hypothetical Case)
City's Population 5000000
COVID-19 Cases 10000
COVID-19
Fatalities
500
Deaths per million 0.0001
Deaths per cases 0.05
Percentages refer to a ratio or value expressed as a fraction of a hundred (Barbara &
Susan, 2014; Neil, 2016; Norman, 2010). A general example of the application of percentages is
in the student test scoring. The points scored by a student in a test, say 20, is divided by the total
available points for the test, say 40, then multiplied by 100. This would give the student a test
score of 50%, which is the test score as a fraction of 100.
6
represent the number of people that have died due to the COVID-19 disease out of the population
of individuals that have been infected by the COVID-19 Pandemic.
To illustrate the difference between the deaths per million rate and the deaths per cases
rate, consider a hypothetical city of 5 million residents that has reported 10 000 cases with 500
fatalities for the COVID-19 Pandemic. The table below, Table 1: Rates (Hypothetical Case)
gives the results of the deaths per million and deaths per cases rates. From the table, we note that
reporting the deaths per million would translate to fatalities due to the COVID-19 disease being
1 in every 10 000 people in the city. On the other hand, also from the table, we note that
reporting the deaths per cases would translate to fatalities due to the COVID-19 disease being 5
in every 100 people in the city. Without proper contextualization, the figures may serve to
obscure if interest is in exaggerating the pandemic by reporting the deaths per cases rates or
understating the pandemic by reporting the deaths per million rates.
Table 1: Rates (Hypothetical Case)
City's Population 5000000
COVID-19 Cases 10000
COVID-19
Fatalities
500
Deaths per million 0.0001
Deaths per cases 0.05
Percentages refer to a ratio or value expressed as a fraction of a hundred (Barbara &
Susan, 2014; Neil, 2016; Norman, 2010). A general example of the application of percentages is
in the student test scoring. The points scored by a student in a test, say 20, is divided by the total
available points for the test, say 40, then multiplied by 100. This would give the student a test
score of 50%, which is the test score as a fraction of 100.
6
⊘ This is a preview!⊘
Do you want full access?
Subscribe today to unlock all pages.
Trusted by 1+ million students worldwide
Mathematics Application in the Reporting of the COVID-19 Pandemic
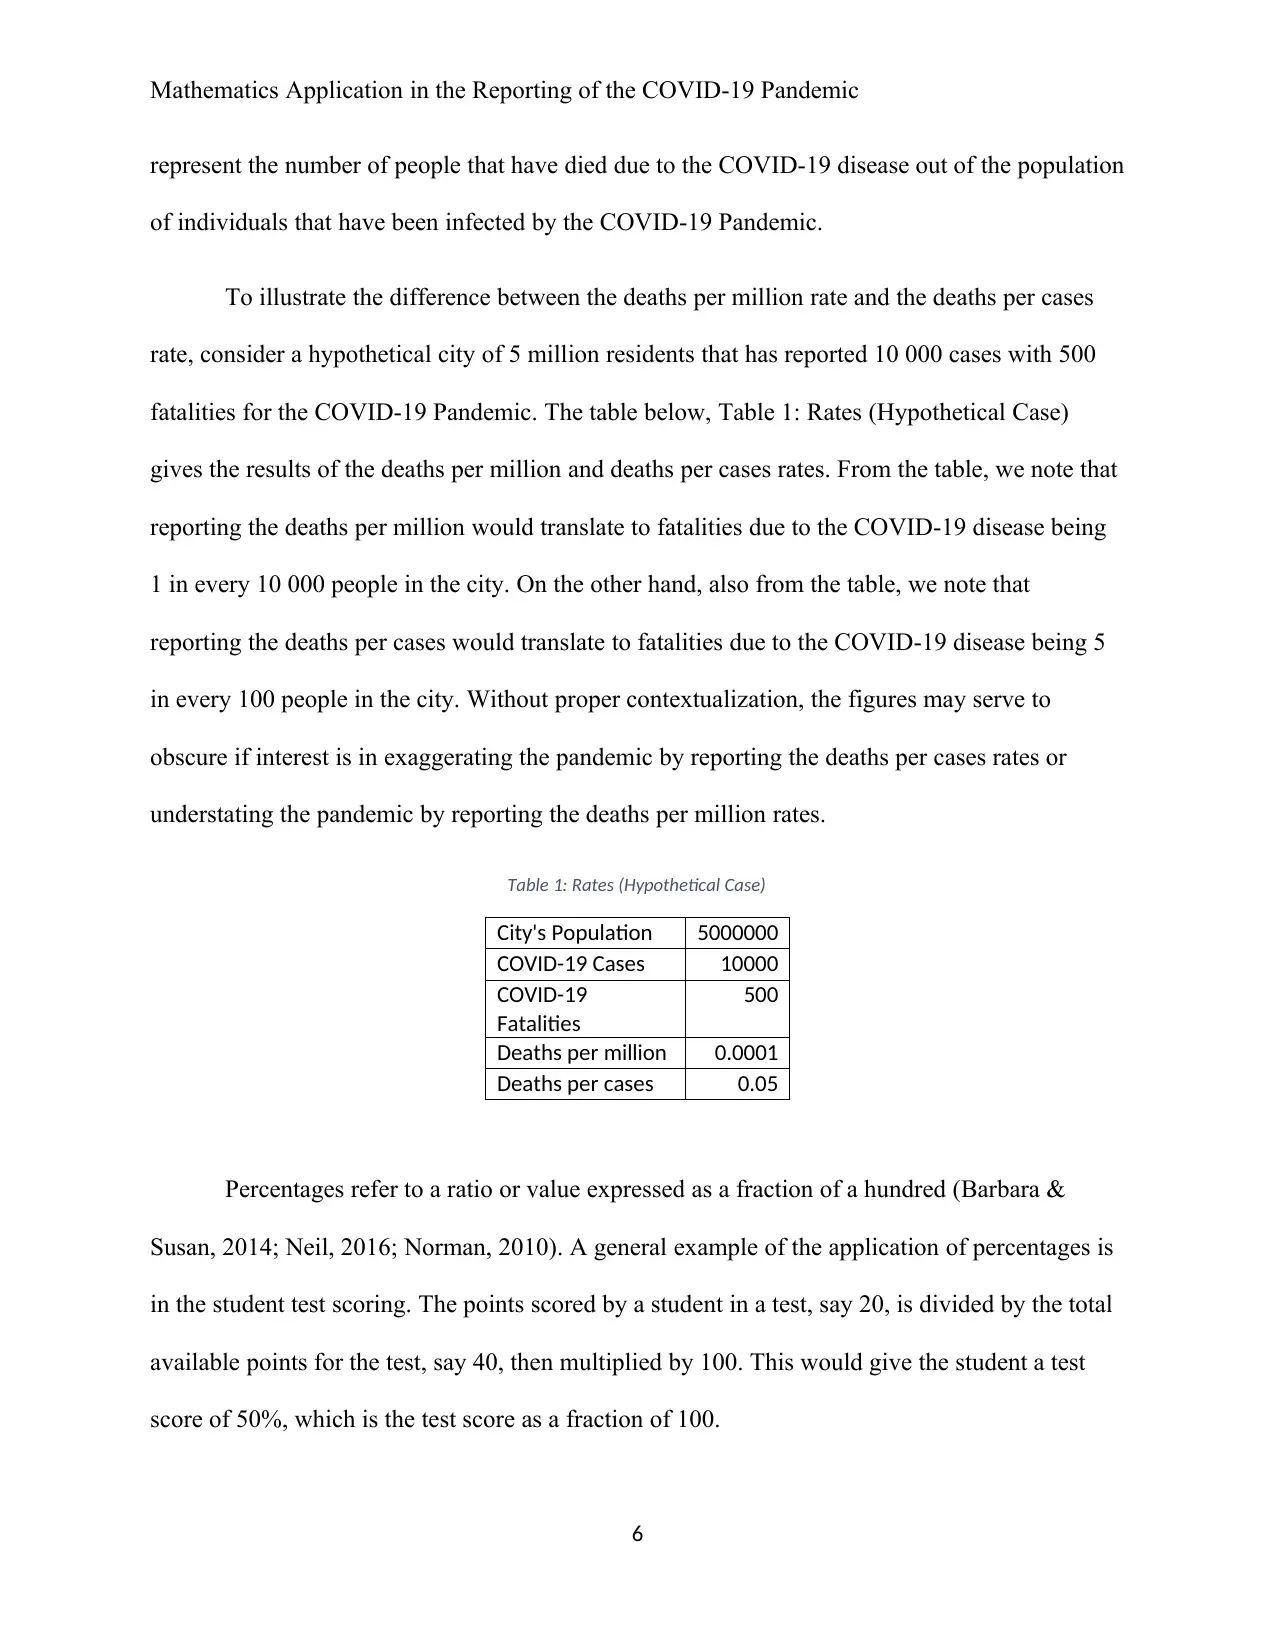
In the case of the COVID-19 Pandemic, we consider the two values for the rates above:
deaths per million and deaths per cases, and obtain there percentages to represent the percentage
deaths due to the COVID-19 disease. In order, to illustrate the differences that can be brought
about by the computations of the percentages, we retain the first city used in the hypothetical
example above, where city has 5 million residents that has reported 10 000 cases with 500
fatalities for the COVID-19 Pandemic. We then introduce a second city with a population of 10
million residents and has reported 10 000 cases with 600 fatalities for the COVID-19 Pandemic.
The table below, Table 2: Percentages (Hypothetical) gives the percentage comparison between
the deaths due to the COVID-19 disease in the two cities for both the deaths per million and
deaths per cases rates. From the table we note that although the percentage deaths per million is
higher in City 2 as compared to City 1, the percentage deaths per cases is higher in City 2 as
compared to City 1. Hence, reporting the percentage deaths per million can be used by City 2 to
obscure the fact that more of its infected residents are dying of the COVID-A9 disease as
compared to City 1.
Table 2: Percentages (Hypothetical)
City 1 City 2
City's Population 5000000 10000000
COVID-19 Cases 10000 10000
COVID-19
Fatalities
500 600
% Deaths per
million
0.010% 0.006%
% Deaths per
cases
5.000% 6.000%
7
Paraphrase This Document
Need a fresh take? Get an instant paraphrase of this document with our AI Paraphraser
Mathematics Application in the Reporting of the COVID-19 Pandemic
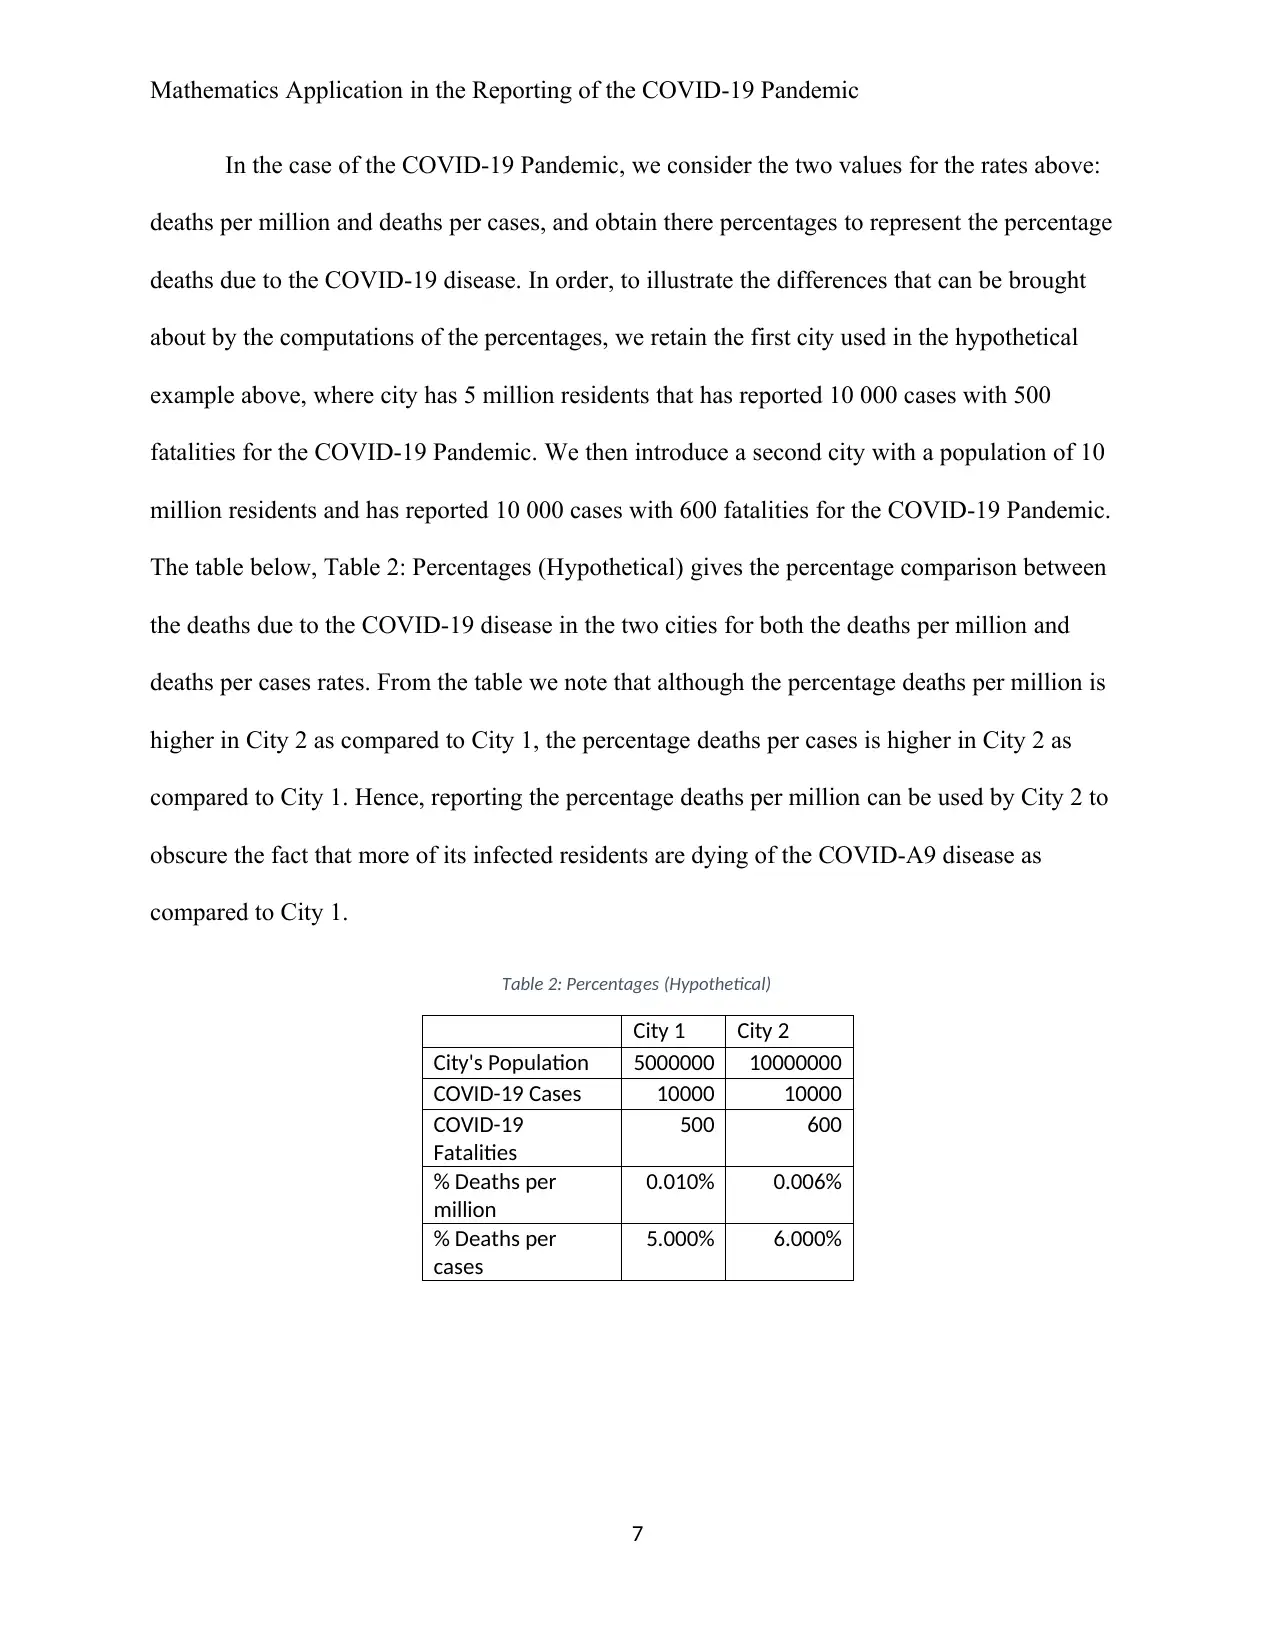
Contextualization for the case of COVID-19 Pandemic in Australia
Taking the comparison between the COVID-19 Pandemic in Australia and China, we
obtain the following figures in Table 3: Australia-China Rates and Percentages Comparisons, for
the Rates and Percentages. From the table, we make the same observation as that made with the
hypothesized examples above, where deaths per million and percentage deaths per million is
higher in Australia as compared to China, although Australia has fewer cases and deaths
resulting from the COVID-19 disease. However, observing the deaths per cases and percentage
deaths per cases, we observe that they are higher for China as compared to Australia.
Contextualizing these rates and percentages would be important in informing on the spread of the
virus, with lack of contextualizing obscuring the fatalities in China as compared to Australia.
Table 3: Australia-China Rates and Percentages Comparisons
Australia China
Country's
Population
25203000 1433783000
COVID-19 Cases 6458 83402
COVID-19 Fatalities 63 3346
Deaths per million 0.0000024997 0.0000023337
Deaths per cases 0.009755342 0.040118942
% Deaths per million 0.000250% 0.000233%
% Deaths per cases 0.98% 4.01%
(Data Source: (ECDC, 2020; Australian Bureau of Statistics, 2020; World Population Review,
2020))
8
Mathematics Application in the Reporting of the COVID-19 Pandemic
Lesson Plan
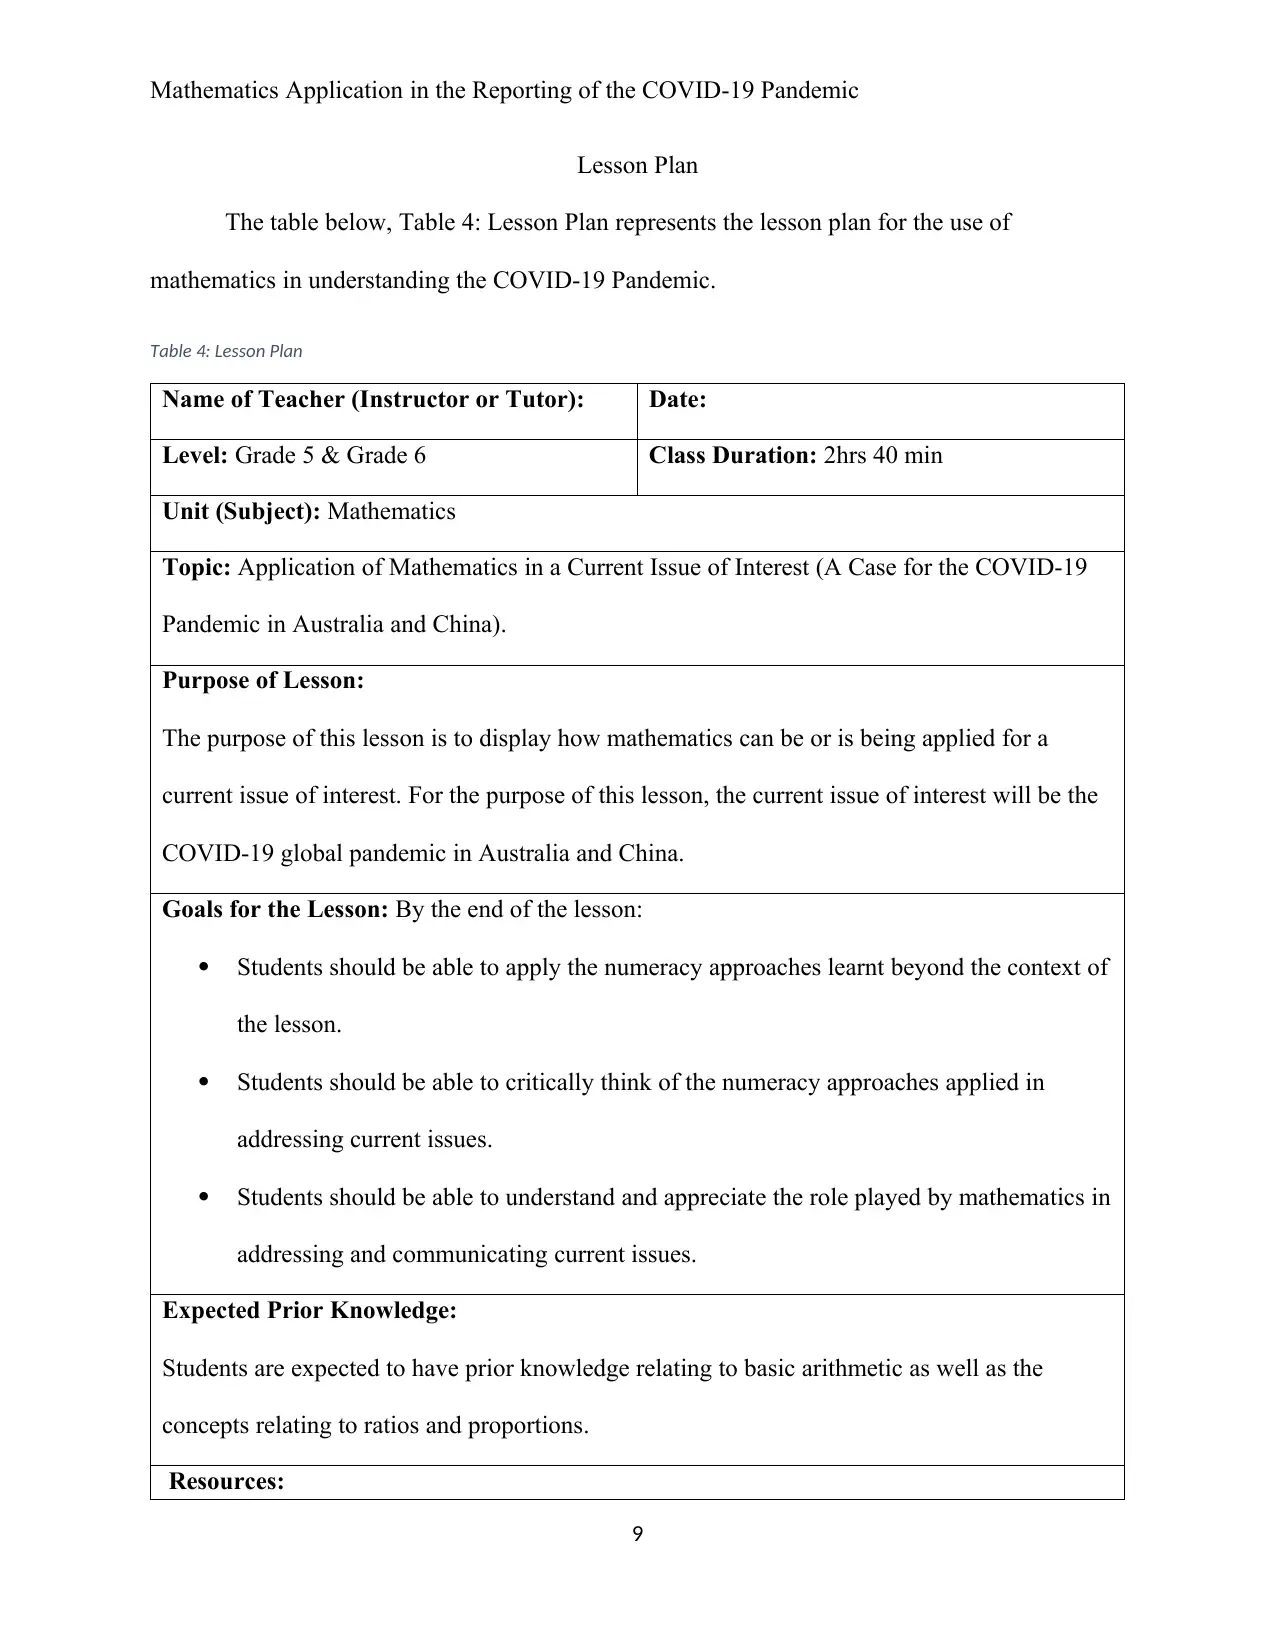
The table below, Table 4: Lesson Plan represents the lesson plan for the use of
mathematics in understanding the COVID-19 Pandemic.
Table 4: Lesson Plan
Name of Teacher (Instructor or Tutor): Date:
Level: Grade 5 & Grade 6 Class Duration: 2hrs 40 min
Unit (Subject): Mathematics
Topic: Application of Mathematics in a Current Issue of Interest (A Case for the COVID-19
Pandemic in Australia and China).
Purpose of Lesson:
The purpose of this lesson is to display how mathematics can be or is being applied for a
current issue of interest. For the purpose of this lesson, the current issue of interest will be the
COVID-19 global pandemic in Australia and China.
Goals for the Lesson: By the end of the lesson:
Students should be able to apply the numeracy approaches learnt beyond the context of
the lesson.
Students should be able to critically think of the numeracy approaches applied in
addressing current issues.
Students should be able to understand and appreciate the role played by mathematics in
addressing and communicating current issues.
Expected Prior Knowledge:
Students are expected to have prior knowledge relating to basic arithmetic as well as the
concepts relating to ratios and proportions.
Resources:
9
Lesson Plan
The table below, Table 4: Lesson Plan represents the lesson plan for the use of
mathematics in understanding the COVID-19 Pandemic.
Table 4: Lesson Plan
Name of Teacher (Instructor or Tutor): Date:
Level: Grade 5 & Grade 6 Class Duration: 2hrs 40 min
Unit (Subject): Mathematics
Topic: Application of Mathematics in a Current Issue of Interest (A Case for the COVID-19
Pandemic in Australia and China).
Purpose of Lesson:
The purpose of this lesson is to display how mathematics can be or is being applied for a
current issue of interest. For the purpose of this lesson, the current issue of interest will be the
COVID-19 global pandemic in Australia and China.
Goals for the Lesson: By the end of the lesson:
Students should be able to apply the numeracy approaches learnt beyond the context of
the lesson.
Students should be able to critically think of the numeracy approaches applied in
addressing current issues.
Students should be able to understand and appreciate the role played by mathematics in
addressing and communicating current issues.
Expected Prior Knowledge:
Students are expected to have prior knowledge relating to basic arithmetic as well as the
concepts relating to ratios and proportions.
Resources:
9
⊘ This is a preview!⊘
Do you want full access?
Subscribe today to unlock all pages.
Trusted by 1+ million students worldwide
Mathematics Application in the Reporting of the COVID-19 Pandemic
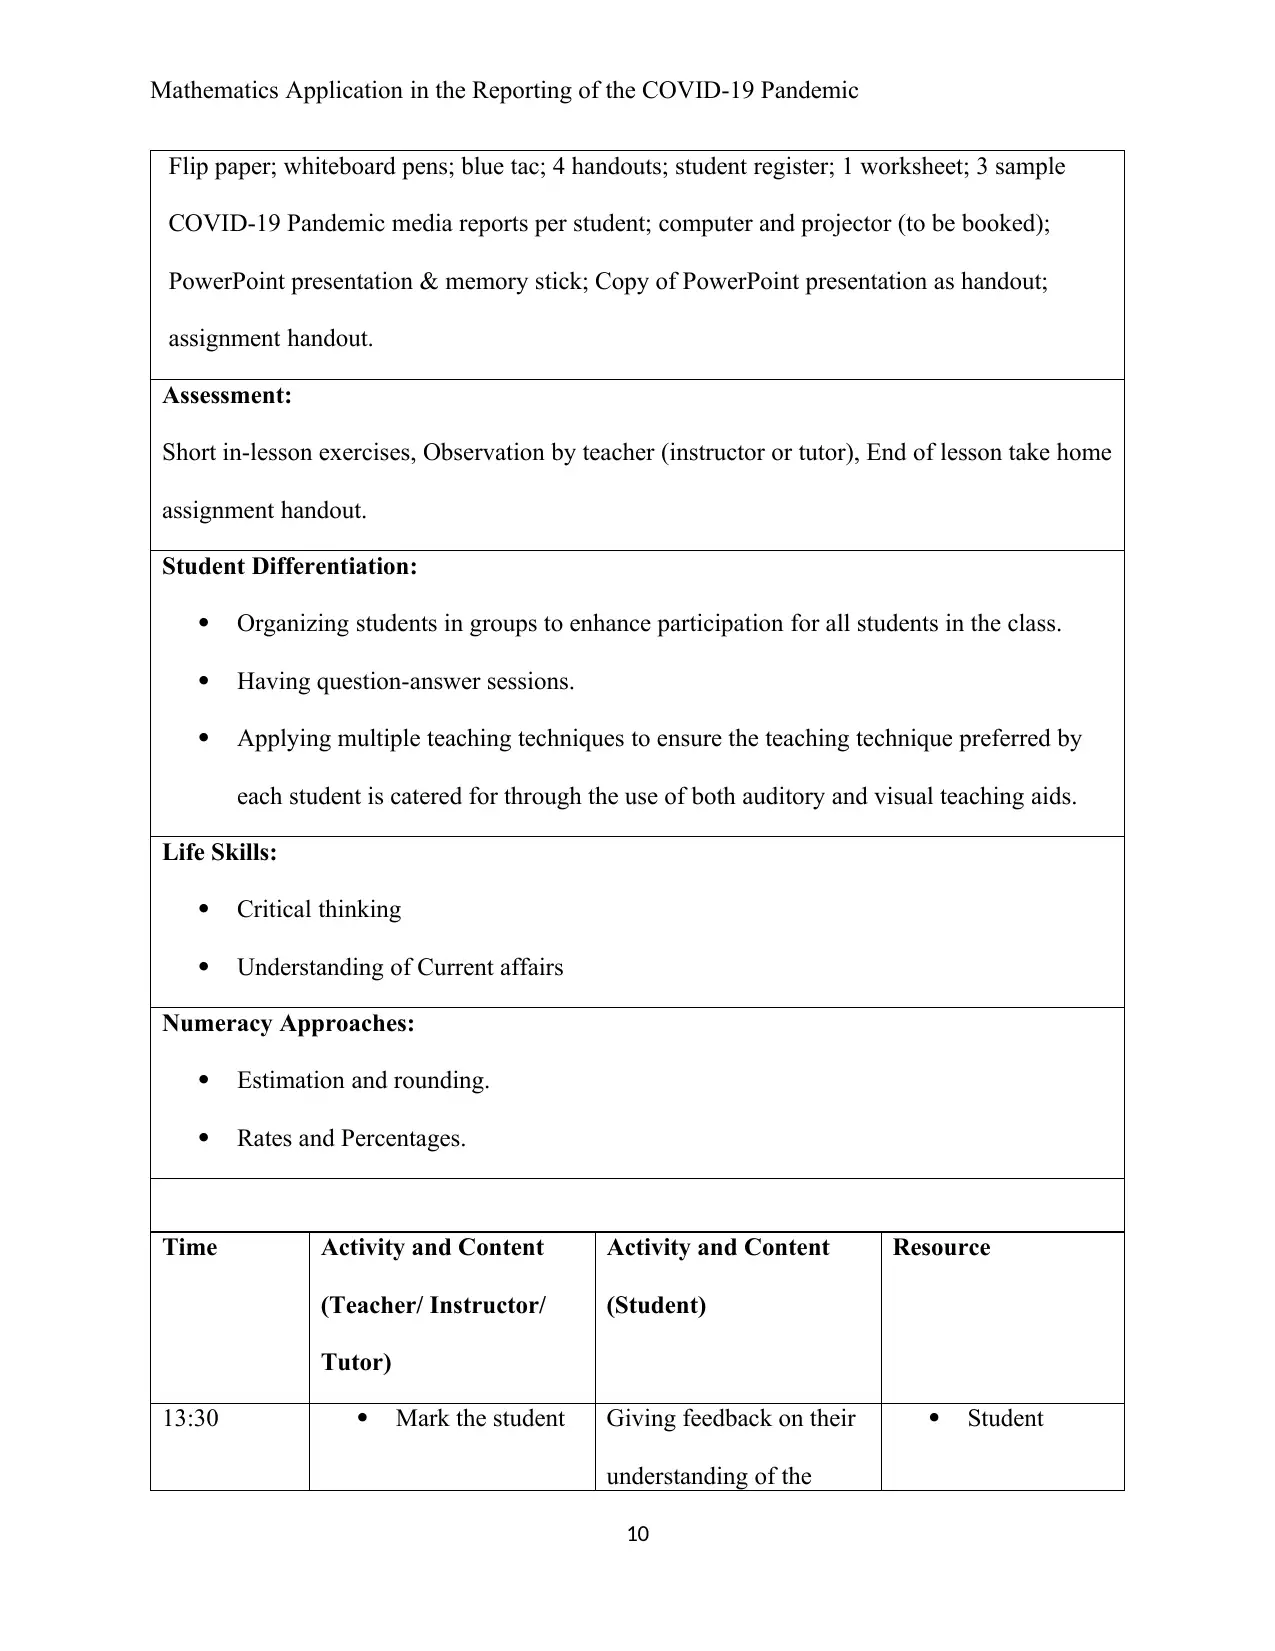
Flip paper; whiteboard pens; blue tac; 4 handouts; student register; 1 worksheet; 3 sample
COVID-19 Pandemic media reports per student; computer and projector (to be booked);
PowerPoint presentation & memory stick; Copy of PowerPoint presentation as handout;
assignment handout.
Assessment:
Short in-lesson exercises, Observation by teacher (instructor or tutor), End of lesson take home
assignment handout.
Student Differentiation:
Organizing students in groups to enhance participation for all students in the class.
Having question-answer sessions.
Applying multiple teaching techniques to ensure the teaching technique preferred by
each student is catered for through the use of both auditory and visual teaching aids.
Life Skills:
Critical thinking
Understanding of Current affairs
Numeracy Approaches:
Estimation and rounding.
Rates and Percentages.
Time Activity and Content
(Teacher/ Instructor/
Tutor)
Activity and Content
(Student)
Resource
13:30 Mark the student Giving feedback on their
understanding of the
Student
10
Paraphrase This Document
Need a fresh take? Get an instant paraphrase of this document with our AI Paraphraser
Mathematics Application in the Reporting of the COVID-19 Pandemic
register.
Reviewing of the
purpose and goals
for the lesson.
purpose of the lesson as
well as the goals of the
lesson.
Register.
Handouts and
PowerPoint
Presentation.
13:37 Providing a
detailed
explanation of the
purpose that the
lesson aim at
achieving.
Elaborating and
expounding on the
goals that the
lesson intends to
achieve.
Reading handout,
listening and following
through the presentation.
Handouts and
PowerPoint
Presentation.
13:40 Providing an
introductory note
and background of
the COVID-19
Pandemic.
Dividing the class
into groups of 4.
Reading handout,
listening and following
through the presentation.
Handouts and
PowerPoint
Presentation.
13:55 Question and Answer
session on the students’
Providing
feedback on their
Handouts and
PowerPoint
11
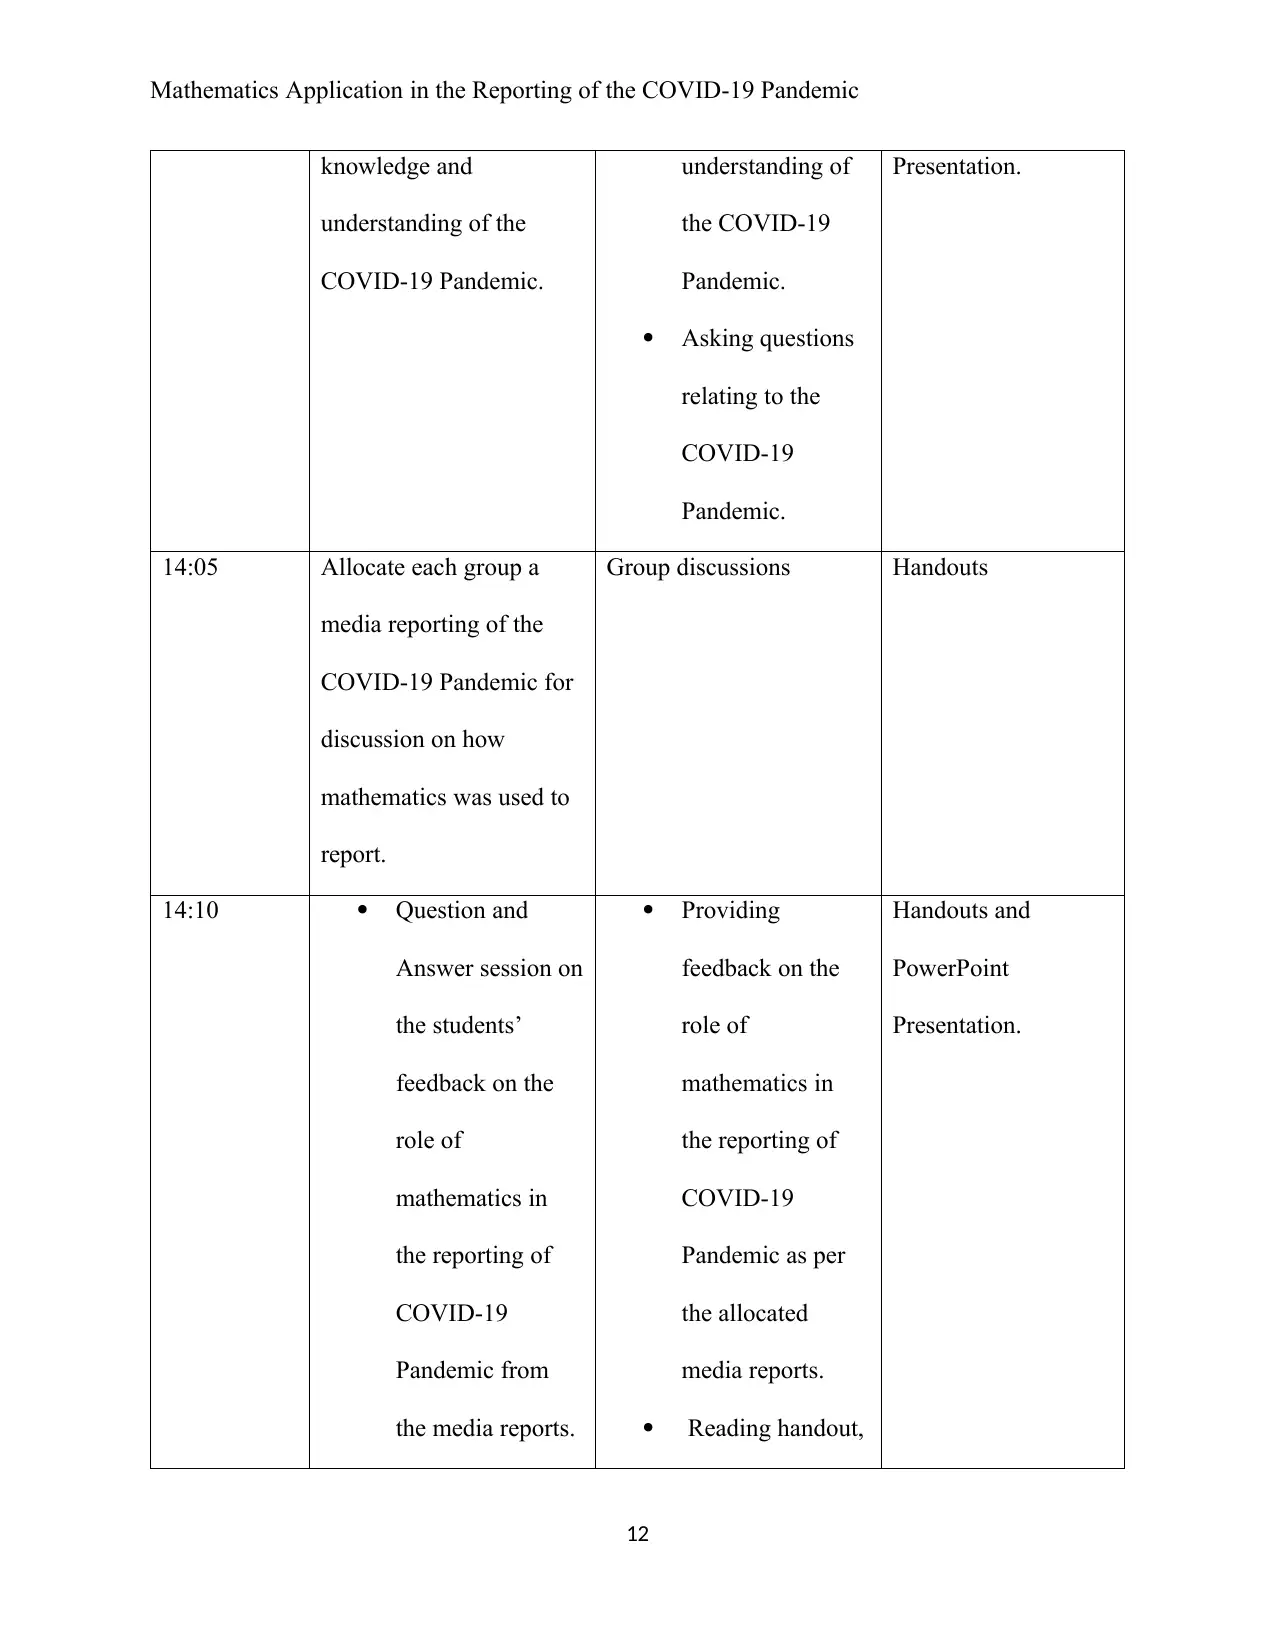
Mathematics Application in the Reporting of the COVID-19 Pandemic
knowledge and
understanding of the
COVID-19 Pandemic.
understanding of
the COVID-19
Pandemic.
Asking questions
relating to the
COVID-19
Pandemic.
Presentation.
14:05 Allocate each group a
media reporting of the
COVID-19 Pandemic for
discussion on how
mathematics was used to
report.
Group discussions Handouts
14:10 Question and
Answer session on
the students’
feedback on the
role of
mathematics in
the reporting of
COVID-19
Pandemic from
the media reports.
Providing
feedback on the
role of
mathematics in
the reporting of
COVID-19
Pandemic as per
the allocated
media reports.
Reading handout,
Handouts and
PowerPoint
Presentation.
12
⊘ This is a preview!⊘
Do you want full access?
Subscribe today to unlock all pages.
Trusted by 1+ million students worldwide
1 out of 16
Related Documents


Your All-in-One AI-Powered Toolkit for Academic Success.
+13062052269
info@desklib.com
Available 24*7 on WhatsApp / Email
![[object Object]](/_next/static/media/star-bottom.7253800d.svg)
Unlock your academic potential
Copyright © 2020–2026 A2Z Services. All Rights Reserved. Developed and managed by ZUCOL.