Data Analytics Report: Analysis of Lean Business Processes and Tableau
VerifiedAdded on 2020/05/28
|18
|4515
|81
Report
AI Summary
This report, titled "Mathematics of Data Analytics," explores various aspects of data analysis and its applications. It begins with an analysis of data cleaning processes, including identifying and addressing errors like missing data and inconsistencies, with a focus on the assumptions made during this process. The report then delves into the creation and rationale behind a data visualization poster, emphasizing the use of clustered bar charts in Microsoft Excel and the design choices that enhance the data's narrative. Furthermore, it discusses the skills developed in Tableau software and how these skills can be presented in a job interview. The report also reflects on a talk from an employer, highlighting insights into the data analytics industry and its real-world applications, particularly in companies like Google, Facebook, and Amazon. Finally, the report examines how data analysis can be effectively used by companies seeking to operate lean business processes, outlining the principles of lean processes and the role of data analytics in optimizing them.
Running Head: MATHEMATICS OF DATA ANALYTICS
Mathematics of Data Analytics
Student’s name:
Institution Affiliation
Mathematics of Data Analytics
Student’s name:
Institution Affiliation
Paraphrase This Document
Need a fresh take? Get an instant paraphrase of this document with our AI Paraphraser
Table of Contents
Question 1...................................................................................................................................................2
Question 2...................................................................................................................................................2
Question 3...................................................................................................................................................5
Question 4...................................................................................................................................................6
Question 5...................................................................................................................................................8
Question 6.................................................................................................................................................11
Question 7.................................................................................................................................................14
References.................................................................................................................................................16
Question 1
A poster has been created by using the Excel data provided in the Moodle. Both A power point
and a Pdf file are available.
Question 2
Write a maximum of 2500 words about how you created your poster and why. In this, you
should reflect on
• How you cleaned the data — did you need to make any assumptions?
• Why you chose the particular visuals you did and how you created them;
• What the rationale for the design of your poster is;
• What the design of the poster adds to the story it is telling.
Errors Checked for in the data
i) Missing data
ii) Erroneous entries
iii) Data format inconsistencies
iv) Extraneous Entries
v) Misspellings
Proposed Remedies for identified Errors
Identified errors include:
i) Missing Data (Blanks)
ii) Extraneous Entries
Proposed Remedies
i) Leave the data unchanged
⊘ This is a preview!⊘
Do you want full access?
Subscribe today to unlock all pages.
Trusted by 1+ million students worldwide
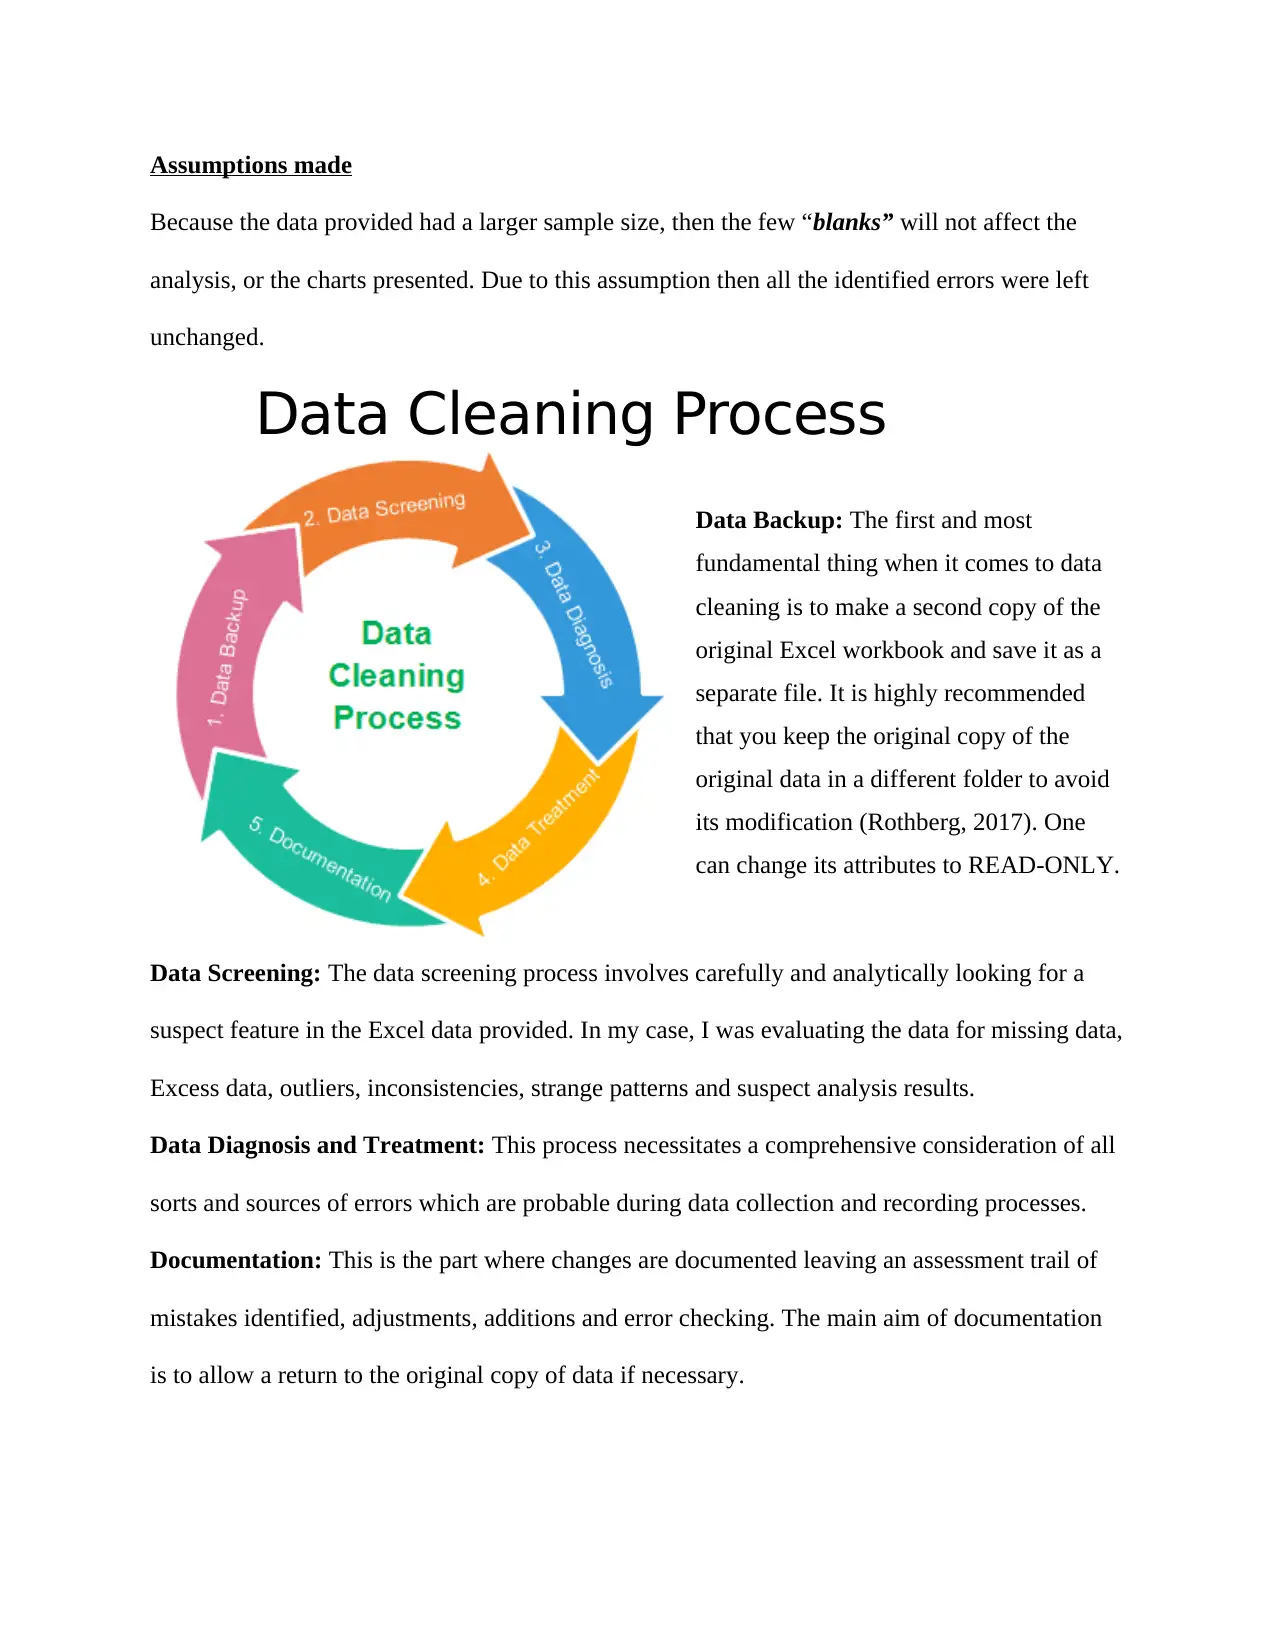
Assumptions made
Because the data provided had a larger sample size, then the few “blanks” will not affect the
analysis, or the charts presented. Due to this assumption then all the identified errors were left
unchanged.
Data Cleaning Process
Data Backup: The first and most
fundamental thing when it comes to data
cleaning is to make a second copy of the
original Excel workbook and save it as a
separate file. It is highly recommended
that you keep the original copy of the
original data in a different folder to avoid
its modification (Rothberg, 2017). One
can change its attributes to READ-ONLY.
Data Screening: The data screening process involves carefully and analytically looking for a
suspect feature in the Excel data provided. In my case, I was evaluating the data for missing data,
Excess data, outliers, inconsistencies, strange patterns and suspect analysis results.
Data Diagnosis and Treatment: This process necessitates a comprehensive consideration of all
sorts and sources of errors which are probable during data collection and recording processes.
Documentation: This is the part where changes are documented leaving an assessment trail of
mistakes identified, adjustments, additions and error checking. The main aim of documentation
is to allow a return to the original copy of data if necessary.
Paraphrase This Document
Need a fresh take? Get an instant paraphrase of this document with our AI Paraphraser
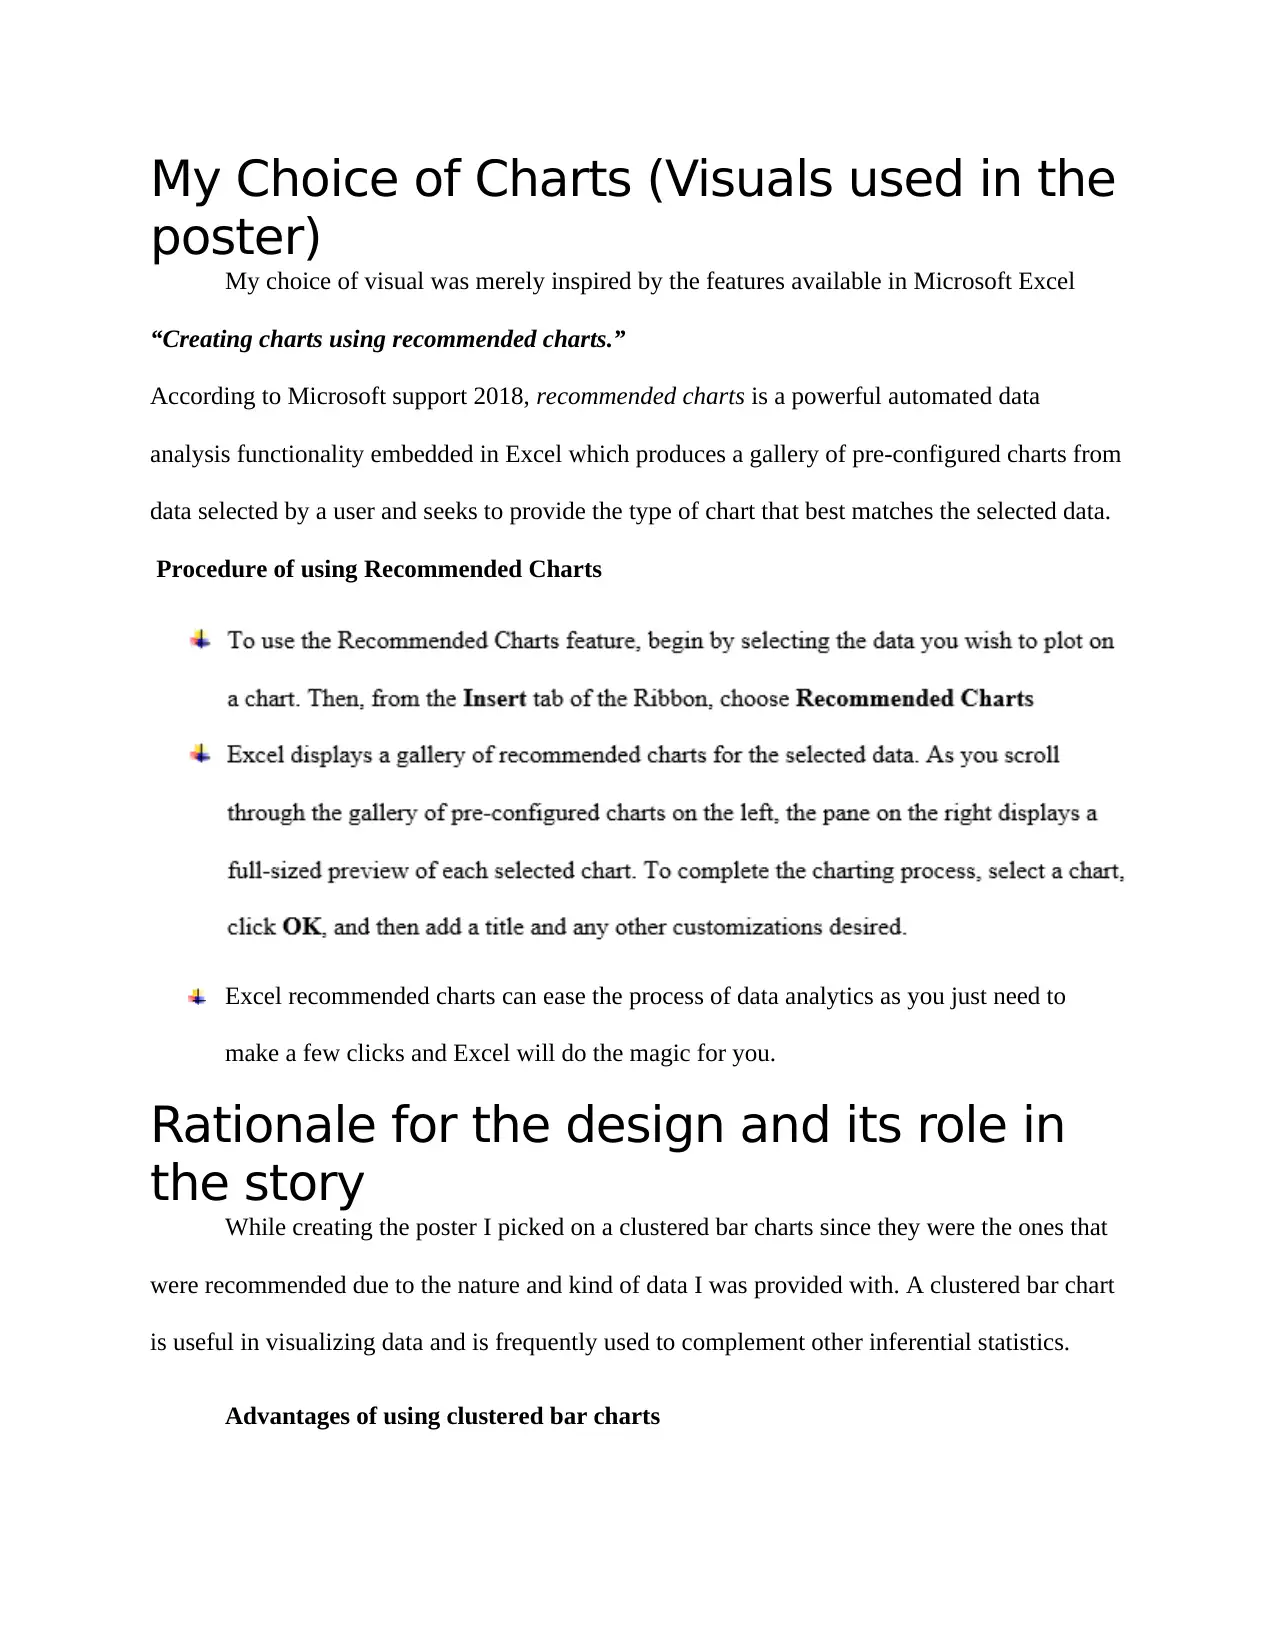
My Choice of Charts (Visuals used in the
poster)
My choice of visual was merely inspired by the features available in Microsoft Excel
“Creating charts using recommended charts.”
According to Microsoft support 2018, recommended charts is a powerful automated data
analysis functionality embedded in Excel which produces a gallery of pre-configured charts from
data selected by a user and seeks to provide the type of chart that best matches the selected data.
Procedure of using Recommended Charts
Excel recommended charts can ease the process of data analytics as you just need to
make a few clicks and Excel will do the magic for you.
Rationale for the design and its role in
the story
While creating the poster I picked on a clustered bar charts since they were the ones that
were recommended due to the nature and kind of data I was provided with. A clustered bar chart
is useful in visualizing data and is frequently used to complement other inferential statistics.
Advantages of using clustered bar charts
Adding another variable to a chart can double the amount of data that is represented, and
the spacing between clusters makes comparisons more explicit. “Clustered charts emphasize the
data within categories more than the data between them. However, you can make comparisons
between categories more clearly by using consistent color schemes; for example, in a quarterly
sales chart, each quarter should have the same color in each category.”
Disadvantages of using clustered bar charts
“The greater the number of categories a chart contains, the harder it is to compare
between them. For example, a clustered chart is ideal for quarterly sales data for five products,
but if you have monthly data going back three years, it's harder to see the trends. If comparisons
within categories are all you are interested in, a line graph would be a better choice.”
Question 3
With reference to Tableau software explain what skills you have developed in this area and
how you can present them at a job interview to help you obtain a graduate-level job.
Tableau software helps you see and understand the story in your data. The software is
designed to make human decisions smarter so that decisions making process can be improved.
With Tableau Software, an analyst can keep on querying the data until they establish the root
cause of the data. One of the primary objectives of the creators of this software is to answer
analytical questions at the speed of their thoughts, i.e. to answer questions faster. The software
comes with sharing capabilities such that an organization using this package can easily share the
data through cloud computing and any use can access the same data from anywhere in the worlds
using the various browsers available.
⊘ This is a preview!⊘
Do you want full access?
Subscribe today to unlock all pages.
Trusted by 1+ million students worldwide
Tableau being a statistical software package can lead a learner into several fields mainly
those dealing with statistics and handling of large data. For you to do well with this software, one
will need a strong foundation either in a statistical degree or a mathematical-based course.
Among the significant skills an individual will gain while learning and using Tableau software is
data collection, cleaning of data, data analysis, and data interpretation and using the interpreted
data to make corporate decisions.
If you are competent in Tableau, then you will be interested in some specific career fields
to work in. Some of these positions include; data scientists, data analysts, business analysts or a
statistician. There are some great companies that deal with big data and can give you the much-
needed experience. Some of this include tech companies like Google and Yahoo, financial
institutions and banks, Telecommunication companies such as Vodafone and analytic companies
such as KPMG.
With advanced knowledge and skills in the use of Tableau particularly in the use of
predictive modeling techniques such as decision trees and regression, one can fit into the above-
described positions.
Question 4
Reflect on one of the talks you have heard from employers this year either in this course or
the IMA lecture on 24th October. Describe how this talk has enhanced your understanding
of the data analytics industry.
My conversation was one that opened me up to the world of science, technology, and use
of big data. At one point in between the conversation, I would ask the data scientist who we were
talking with, “What happens at behind the scenes of this giant companies?”
Paraphrase This Document
Need a fresh take? Get an instant paraphrase of this document with our AI Paraphraser
When you here of data analytics, one will think of the basic data collections we do in
high school when performing chemistry and physics lab experiments, after which a student is
required to use the data they collect to answer questions. In the real world when you talk about
data analytics people think of giant companies implementing the concepts of big data analytics.
Say for instance Google, when you are making a search via a search engine, Google is able to
predict for you what you want even before you know it yourself (Jun et al., 2017). The company
is able to customize your search patterns, your travel routes etc. All these is big data analytics in
use.
When you think of social media sites such as Facebook, they can customize your feeds
and your pages using your profile and to depend on what pages you frequent. Facebook has
deployed the use of Hadoop technologies to help in big data solutions among other significant
concepts like tag suggestion, content customization and analyzing the frequented pages by a user
(Brandtzaeg, 2017).
In addition to the above companies, think of Amazon. This company has a supreme data
store on all its client’s accounts and their online purchasing behavior. Amazon has in the past
used the data it collects from its customers to build a “Recommender system.” This is a
framework that can suggest products and services to consumers who visit the Amazon.com
website (Muniz et al., 2018). Currently, Amazon is the leading online retail store and one which
has greatly perfected the art of using big data analytics in its operations. Client’s clicks and their
buying history is being used by Amazon to customize a user experience when they visit their
website again (Bradlow et al., 2017).
My friend mentioned that for him, he got inspired to pursue a statistics course as he had
always felt good interacting with numbers. “With the current use of computers and statistical-
based software(s), there is no question a boardroom cannot deliberate upon by using the data
they collect.” There are companies who are solely relying on data analytics for basically their
100% operations. For instance, Uber Company has a data store with its drivers. If you want a
ride or a delivery, the app will match you with the driver closest to you. Then immediately the
driver calls you to confirm your exact location on the ground and makes the trip. Use of data has
helped the company be a force to reckon with (Kubina et al., 2015). They have used the same
data to set prices in different cities and also to predict demand and supply.
“The use of big data and data analytics in the 21st century is simply inevitable.”
Among the main ideas, I leaned from the talk include the following:
As a person entering a career in data analytics, then I will need to be always updated with
day to day activities. For instance, knowing the most recent technology in use by Google.
Use of Technology, Science, Programming and data analytics are all closely intertwined
and dependent on each other.
For one to be successful in this field, then you need to identify a set of required skills that
you must be very good at.
Question 5
How data analysis can be used effectively by companies seeking to operate lean business
processes.
Lean business processes are processed that is set to create more value for consumers
while utilizing fewer resources. In other words, these are business models that focus their
attention on customer value and lays down plans to make that happen (Onken and Campeau,
2016). The primary target of lean business processes is to perfect value creation for the customer
and make sure they are producing insignificant waste. To achieve this, applying lean strategies
⊘ This is a preview!⊘
Do you want full access?
Subscribe today to unlock all pages.
Trusted by 1+ million students worldwide
revolutionizes the way the managerial heads view things. Think of deployment and optimization
of separate innovations to use of big data analytics in optimizing the flow of products and service
delivery to clients (Teece and Linden, 2017).
According to Lean Enterprise Institute, lean processes should be directed towards
creating zero waste along the value chains. Lean processes should be made less human
depended; they should occupy less space, use fewer investments resources and take less time to
produce goods and services at a cheaper budget with fewer or no defects at all being realized
(Massingham and Al Holaibi, 2017). The exploitation of data analytics in businesses today has
enabled organizations to respond to dynamic customer needs at a low cost with individual
customization of goods and services and in most scenarios respond to clients in real time. Data
analytics have equipped these organizations with capabilities to handle big and complex data
while at the same time providing a simpler and a more accurate way of interacting with the data.
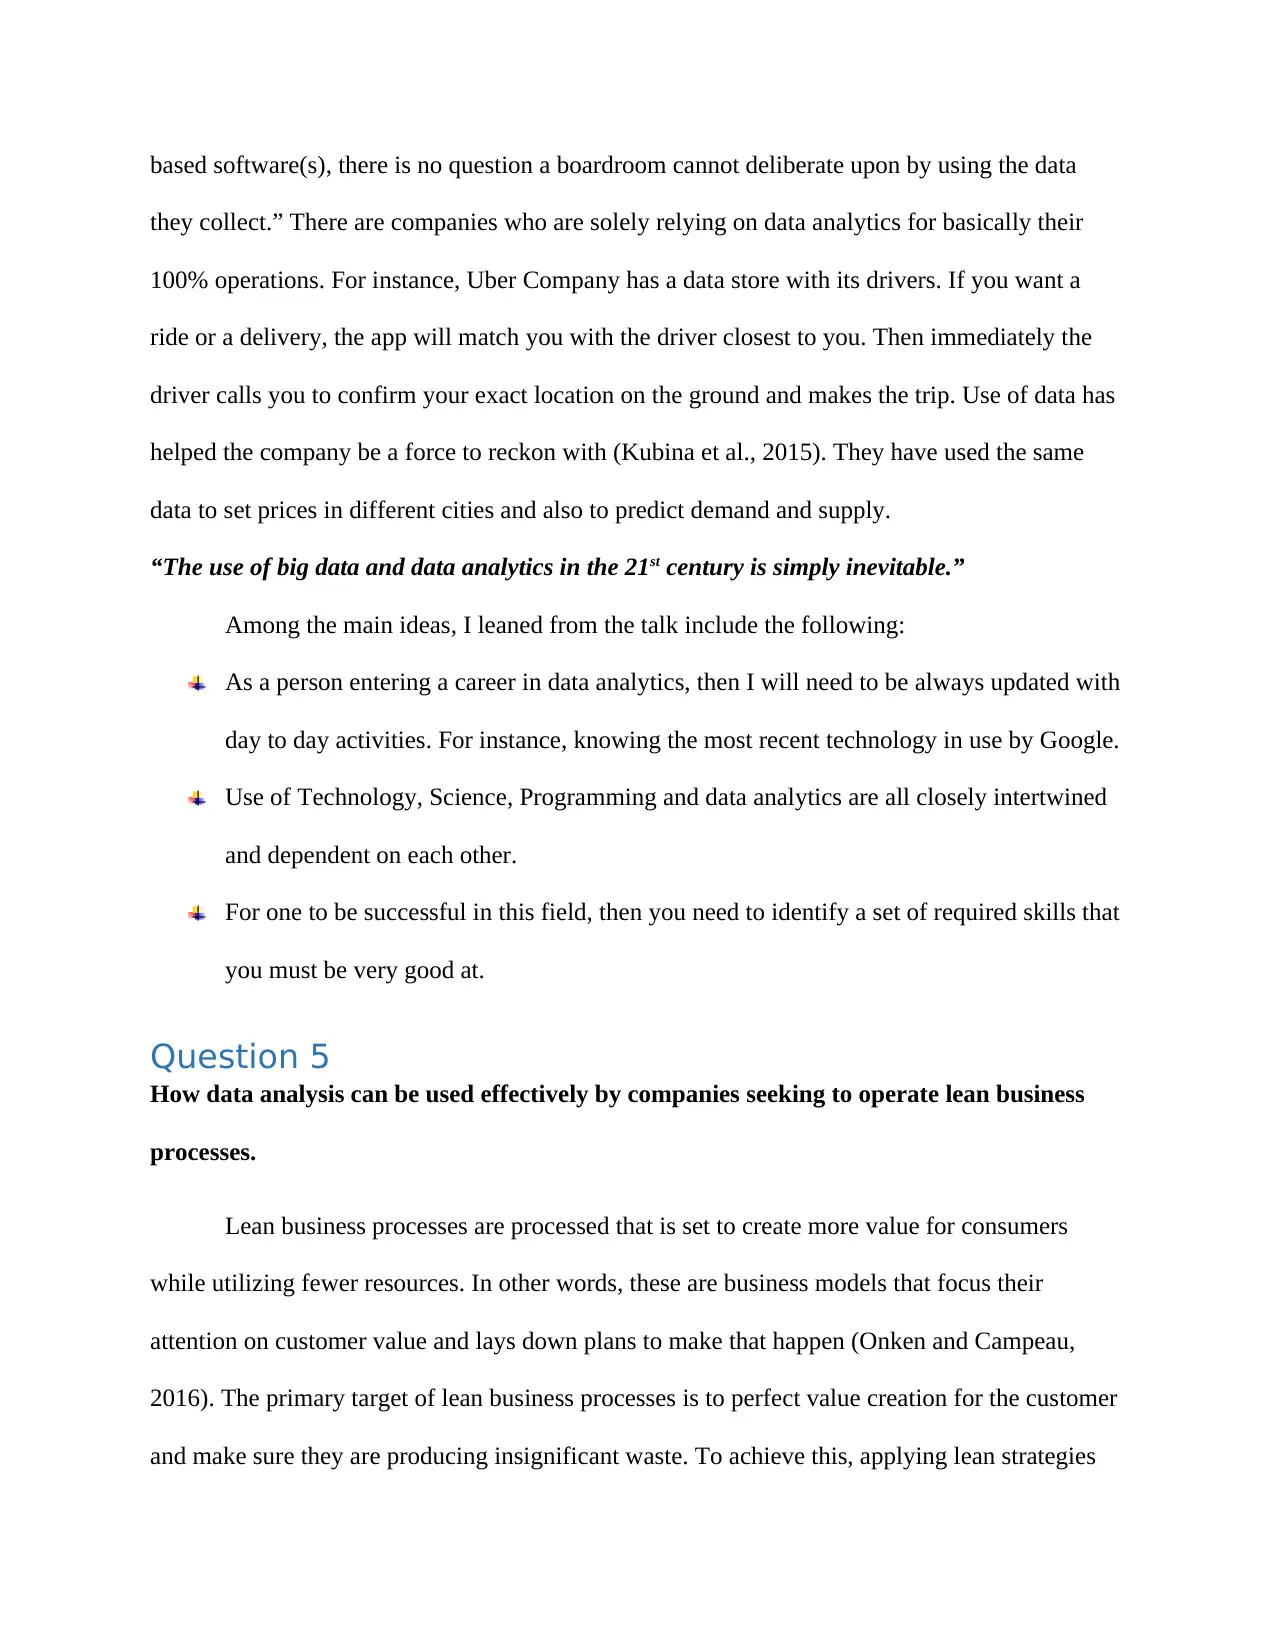
Below is a visual model representing the principles that a lean process employs.
Value: Correctly specify the value of a given product, good or service to a client.
of separate innovations to use of big data analytics in optimizing the flow of products and service
delivery to clients (Teece and Linden, 2017).
According to Lean Enterprise Institute, lean processes should be directed towards
creating zero waste along the value chains. Lean processes should be made less human
depended; they should occupy less space, use fewer investments resources and take less time to
produce goods and services at a cheaper budget with fewer or no defects at all being realized
(Massingham and Al Holaibi, 2017). The exploitation of data analytics in businesses today has
enabled organizations to respond to dynamic customer needs at a low cost with individual
customization of goods and services and in most scenarios respond to clients in real time. Data
analytics have equipped these organizations with capabilities to handle big and complex data
while at the same time providing a simpler and a more accurate way of interacting with the data.
Below is a visual model representing the principles that a lean process employs.
Value: Correctly specify the value of a given product, good or service to a client.
Paraphrase This Document
Need a fresh take? Get an instant paraphrase of this document with our AI Paraphraser
Value Stream: Identify the value stream and set procedures to remove waste
Flow: Make the product flow without hindrance and do away with non-value adding
activities.
Pull Actions initiated only by demand in the supply of goods or services.
Perfection: Eradication of waste as a continuous process in the quest for perfection.
Lean business processes are applicable in all business ventures contrary to the belief that
they can only be used in manufacturing industries. Lean is not a way for companies and
organizations to reduce their operation costs but rather a techniques where all stakeholders think
and act in a given manner. Governments, NGOs, healthcare institutions and learning foundations
are now using lean business process as the brain to their day-to-day operations. Companies have
chosen not to refer to their frameworks as ‘lean’ but rather incorporate their names. For instance,
Toyota is the best example of an organization using lean business processes to run all its
procedures, but have adopted the name “Toyota Production System” instead. The key thing to
note here is that, lean is not a cost-reduction and neither is it a program but rather the way an
organization operates. If an organization is thinking of going the ‘lean way’, then this must be a
long-term goal.
Having looked at what lean business processes are and the kind of organizations using the model
to run their activities, let’s see how data analytics can be of help to such ventures.
First and foremost, businesses are using data analytics to gain a competitive advantage.
Data analytics or as currently referred to as big data analytics helps an organization analyze the
customer and market needs and adjust accordingly. For instance, when a business what to launch
a marketing promotion in another country, it will be important for the management to understand
what a realistic prospect of sales penetration will be realized based on the past promotions
carried out by the organization and comparable demographics (D.W, 2014). This data can be
correlated with past sales advertisements and then used by decision-makers to predict and
forecast the change in demand for goods and services and the profits that are likely to be
realized. Lean advocates for actions that are only led by demand and therefore, analyzing these
data will inform the company executives whether to make investments or not (Frisk and
Bannister, 2017).
Also, data analytics have been implemented by organizations to achieve business agility.
Business agility is the ability of a firm to respond to threats and opportunities faster and with
speed. Traditionally, businesses would study the market over a given period say quarterly or
every six months and then write recommendations on how to handle threats and opportunities
and how to respond to their strengths and the weak areas of a firm. However, with current
advancements in technology, now business parameters need to be changed in real-time.
For instance, while you are traveling from one location to the next using Uber cab, the Uber app
is updating your route in real time. The next time you open the app, even before you update your
locating and where you want to travel, Uber will ask to suggest the route for you based on your
previous traveling patterns. The use of data has simply enabled businesses to offer customized
goods and services to each customer seamlessly and in real-time.
Question 6
The Employability Department at Redwich University is holding a Summer Internship
Fair. They have created an online system so that students can sign up with their name,
student Id number, Faculty and choice of compulsory workshop. The data was saved in an
Excel spreadsheet. However, the resulting data needs a lot of cleaning. Write explaining at
least three problems an analyst might expect to have with this sort of data that has been
⊘ This is a preview!⊘
Do you want full access?
Subscribe today to unlock all pages.
Trusted by 1+ million students worldwide
1 out of 18
Your All-in-One AI-Powered Toolkit for Academic Success.
+13062052269
info@desklib.com
Available 24*7 on WhatsApp / Email
![[object Object]](/_next/static/media/star-bottom.7253800d.svg)
Unlock your academic potential
Copyright © 2020–2026 A2Z Services. All Rights Reserved. Developed and managed by ZUCOL.