Managerial Finance Report: Matheson Electronics Case Study Analysis
VerifiedAdded on 2023/03/30
|18
|3462
|484
Report
AI Summary
This report analyzes the financial feasibility of Matheson Electronics launching a new electronic device. It employs various investment appraisal techniques such as Net Present Value (NPV), Payback Method, Internal Rate of Return (IRR), and Accounting Rate of Return (ARR) to evaluate the project's profitability. The report also explores sources of finance, breakeven analysis, margin of safety, and cash budgeting to assess the financial risks and returns. Furthermore, it includes performance evaluations, and considers other crucial issues. The analysis reveals a negative NPV, indicating the project's potential unprofitability, though ARR suggests some returns. The report also includes detailed calculations and interpretations of each financial metric, providing a comprehensive overview of the project's financial implications and recommendations.

Running Head: Managerial Finance
Managerial Finance
Contents
Managerial Finance
Contents
Paraphrase This Document
Need a fresh take? Get an instant paraphrase of this document with our AI Paraphraser
Managerial Finance
1. Executive Summary....................................................................................................................2
2. Introduction..................................................................................................................................2
3. Investment Appraisal Technique...............................................................................................2
3.1 Net Present Value (NPV)...................................................................................................2
3.2 Payback Method..................................................................................................................3
3.3 Internal Rate of Return (IRR).............................................................................................4
3.4 Accounting Rate of Return (ARR).....................................................................................4
4. Sources of Finance.....................................................................................................................5
4.1 Personal Finance.....................................................................................................................5
4.2 Internal Source of Finance......................................................................................................5
4.3 External Source of Finance.....................................................................................................5
a) Equity Financing..................................................................................................................5
b) Debt Financing....................................................................................................................5
5. Breakeven Analysis....................................................................................................................6
5.1 Margin of Safety..................................................................................................................6
6. Cash Budget................................................................................................................................6
7. Performance Evaluation of Lily Wholesale Company............................................................7
8. Issues to be considered by Matheson Electronics.................................................................8
9. Conclusion...................................................................................................................................8
10. References.............................................................................................................................10
11. Appendix................................................................................................................................11
11.1 Calculation of Net Present Value.......................................................................................11
11.2 Payback Method...................................................................................................................12
11.3 Internal Rate of Return........................................................................................................13
11.4 Accounting Rate of Return..................................................................................................13
11.5 Breakeven Analysis.............................................................................................................14
11.6 Margin of Safety...................................................................................................................14
11.7 Cash Budget.........................................................................................................................15
11.8 Income Statement................................................................................................................16
1
Managerial Finance
1. Executive Summary
This project is prepared to assist Matheson Electronics with the decision of selecting
or rejecting the project of launching a new electronic device which could measure
miles an automobile could cover in per gallon of gasoline. Analysis has shown that
company could launch the project as a result of positive NPV and acceptable level of
Accounting Rate of Return. The other reason of selecting the project is that it would
help company in reaping more profit because there are no competitors in the market.
2. Introduction
Every business needs capital to meet its long term needs like expansion, acquisition
of another company or to enter all new market. These funds are required for meeting
the needs arising in day to day business operations which are considered as short-
term needs. So now when the fund is so important for any business organisation,
they think twice before investing in any project. To avoid the risk of loss arising from
the investment done in the project the company employs the investment appraisal
techniques like NPV, IRR, and Payback Period etc. to check the profitability of the
project. To avoid the risk associated with the sales and market variability the
company often carries out the breakeven analysis and calculates margin of safety.
3. Investment Appraisal Technique
3.1 Net Present Value (NPV)
Net Present value is usually employed in the investment industry to make a
proper valuation of the project (Bell, 2017).NPV is used to estimate the return
on the amount invested in the project and then the return is converted into
dollar value of today. This helps the company in understanding whether the
project worth the investment or not. It helps the company in knowing whether
the investment would actually increase the value of the firm or not. The best
part of using NPV as an investment appraisal technique is it consider time
value of money, all the cash flows and also the risks associated with the
future cash flows. There are certain reasons which make the NPV less
attractive. The calculations involved in the NPV are very complex in nature
like estimation of cost of capital. There are certain assumptions which are
2
⊘ This is a preview!⊘
Do you want full access?
Subscribe today to unlock all pages.
Trusted by 1+ million students worldwide
Managerial Finance
taken while computing NPV of any project. Management of the company
needs to take the assumptions in respect of dollar amount as well as timing of
the future cash flows related with the project. Interest rates for the project’s
duration are also assumed. The problem lies in the fact that these
assumptions could or could not be realistic in nature.
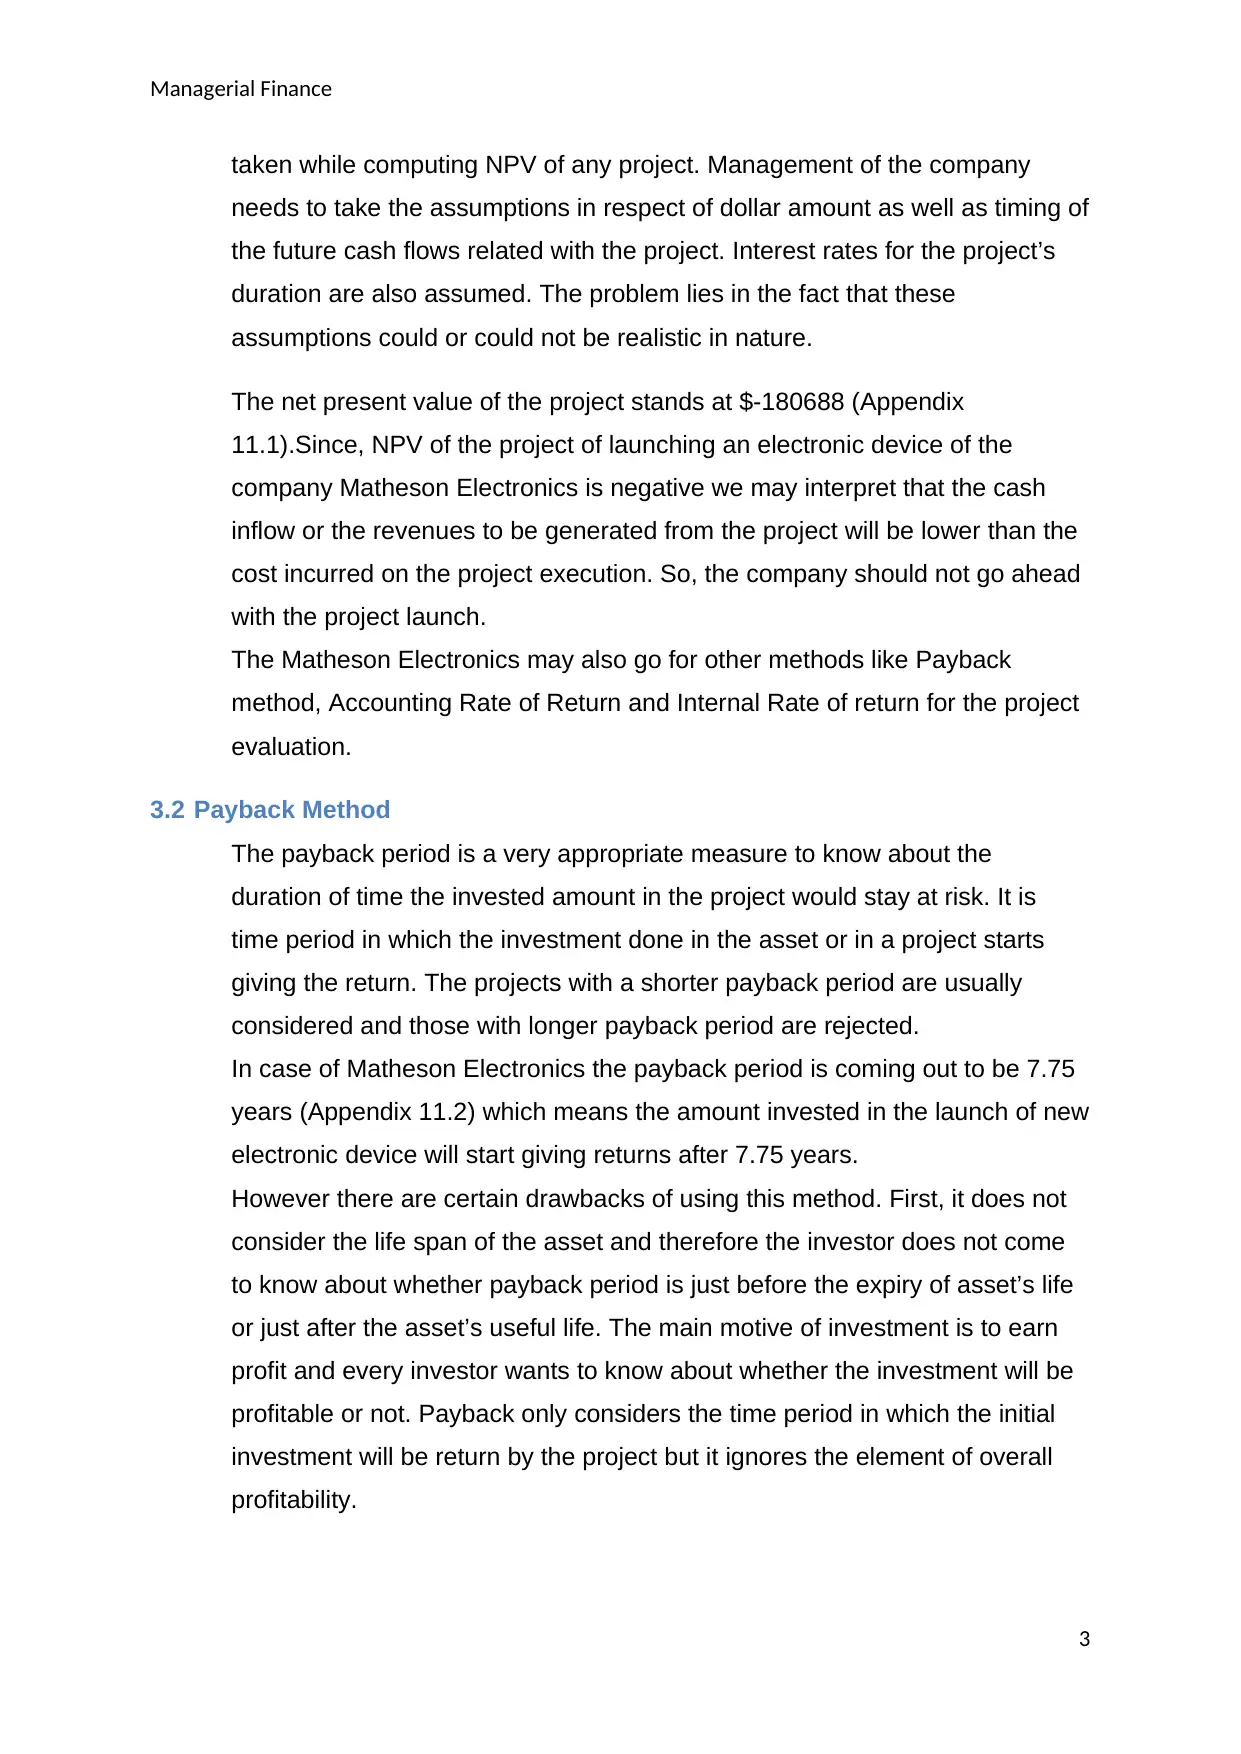
The net present value of the project stands at $-180688 (Appendix
11.1).Since, NPV of the project of launching an electronic device of the
company Matheson Electronics is negative we may interpret that the cash
inflow or the revenues to be generated from the project will be lower than the
cost incurred on the project execution. So, the company should not go ahead
with the project launch.
The Matheson Electronics may also go for other methods like Payback
method, Accounting Rate of Return and Internal Rate of return for the project
evaluation.
3.2 Payback Method
The payback period is a very appropriate measure to know about the
duration of time the invested amount in the project would stay at risk. It is
time period in which the investment done in the asset or in a project starts
giving the return. The projects with a shorter payback period are usually
considered and those with longer payback period are rejected.
In case of Matheson Electronics the payback period is coming out to be 7.75
years (Appendix 11.2) which means the amount invested in the launch of new
electronic device will start giving returns after 7.75 years.
However there are certain drawbacks of using this method. First, it does not
consider the life span of the asset and therefore the investor does not come
to know about whether payback period is just before the expiry of asset’s life
or just after the asset’s useful life. The main motive of investment is to earn
profit and every investor wants to know about whether the investment will be
profitable or not. Payback only considers the time period in which the initial
investment will be return by the project but it ignores the element of overall
profitability.
3
taken while computing NPV of any project. Management of the company
needs to take the assumptions in respect of dollar amount as well as timing of
the future cash flows related with the project. Interest rates for the project’s
duration are also assumed. The problem lies in the fact that these
assumptions could or could not be realistic in nature.
The net present value of the project stands at $-180688 (Appendix
11.1).Since, NPV of the project of launching an electronic device of the
company Matheson Electronics is negative we may interpret that the cash
inflow or the revenues to be generated from the project will be lower than the
cost incurred on the project execution. So, the company should not go ahead
with the project launch.
The Matheson Electronics may also go for other methods like Payback
method, Accounting Rate of Return and Internal Rate of return for the project
evaluation.
3.2 Payback Method
The payback period is a very appropriate measure to know about the
duration of time the invested amount in the project would stay at risk. It is
time period in which the investment done in the asset or in a project starts
giving the return. The projects with a shorter payback period are usually
considered and those with longer payback period are rejected.
In case of Matheson Electronics the payback period is coming out to be 7.75
years (Appendix 11.2) which means the amount invested in the launch of new
electronic device will start giving returns after 7.75 years.
However there are certain drawbacks of using this method. First, it does not
consider the life span of the asset and therefore the investor does not come
to know about whether payback period is just before the expiry of asset’s life
or just after the asset’s useful life. The main motive of investment is to earn
profit and every investor wants to know about whether the investment will be
profitable or not. Payback only considers the time period in which the initial
investment will be return by the project but it ignores the element of overall
profitability.
3
Paraphrase This Document
Need a fresh take? Get an instant paraphrase of this document with our AI Paraphraser
Managerial Finance
3.3 Internal Rate of Return (IRR)
The calculation of internal rate of Return is one of the significant tools used
for project selection. It computes the amount of profit that a company would
generate in future course taking time value of money into consideration.
Internal Rate of Return tries to find the discount rate at which the present
value of cash flows relating to future will become zero (Bizfluent, 2017).
Higher the IRR of any project better is the probability of the business to be
successful.
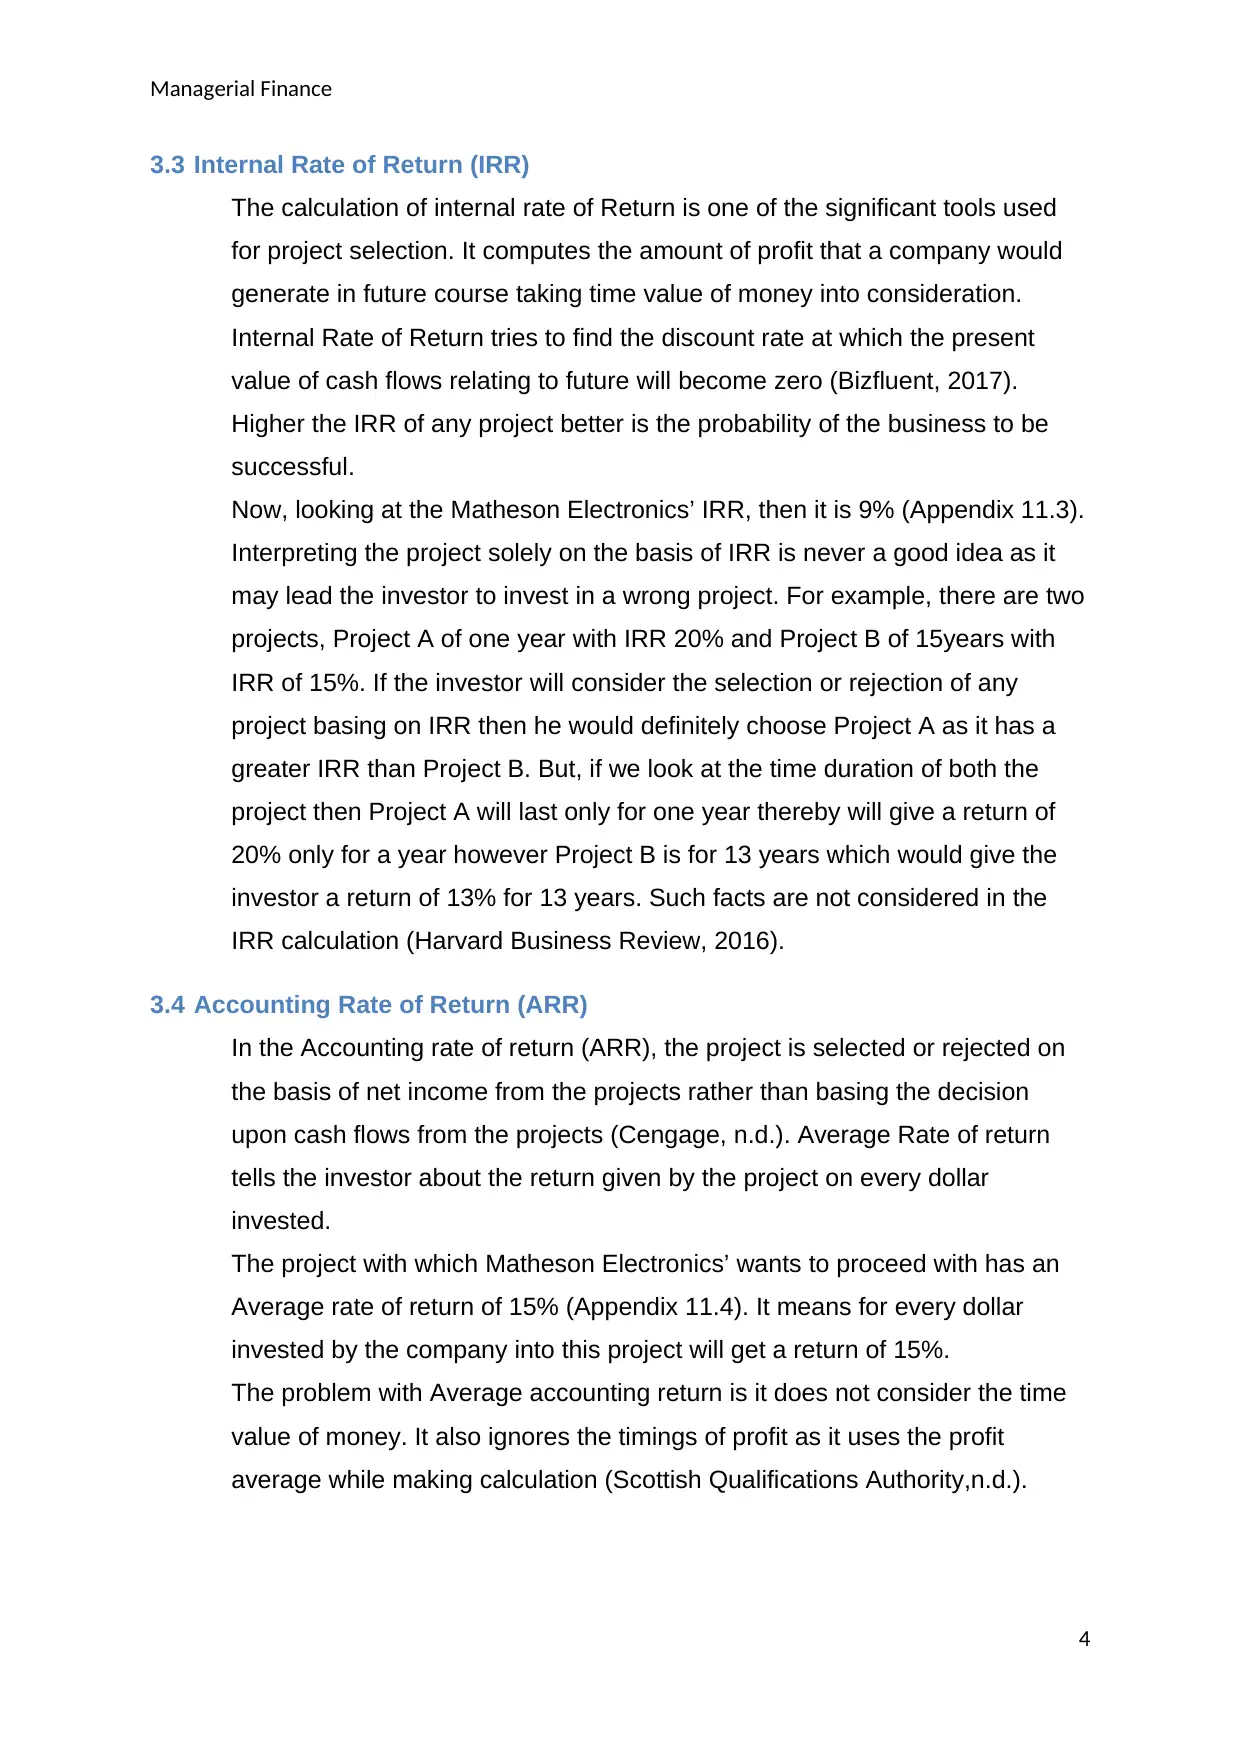
Now, looking at the Matheson Electronics’ IRR, then it is 9% (Appendix 11.3).
Interpreting the project solely on the basis of IRR is never a good idea as it
may lead the investor to invest in a wrong project. For example, there are two
projects, Project A of one year with IRR 20% and Project B of 15years with
IRR of 15%. If the investor will consider the selection or rejection of any
project basing on IRR then he would definitely choose Project A as it has a
greater IRR than Project B. But, if we look at the time duration of both the
project then Project A will last only for one year thereby will give a return of
20% only for a year however Project B is for 13 years which would give the
investor a return of 13% for 13 years. Such facts are not considered in the
IRR calculation (Harvard Business Review, 2016).
3.4 Accounting Rate of Return (ARR)
In the Accounting rate of return (ARR), the project is selected or rejected on
the basis of net income from the projects rather than basing the decision
upon cash flows from the projects (Cengage, n.d.). Average Rate of return
tells the investor about the return given by the project on every dollar
invested.
The project with which Matheson Electronics’ wants to proceed with has an
Average rate of return of 15% (Appendix 11.4). It means for every dollar
invested by the company into this project will get a return of 15%.
The problem with Average accounting return is it does not consider the time
value of money. It also ignores the timings of profit as it uses the profit
average while making calculation (Scottish Qualifications Authority,n.d.).
4
3.3 Internal Rate of Return (IRR)
The calculation of internal rate of Return is one of the significant tools used
for project selection. It computes the amount of profit that a company would
generate in future course taking time value of money into consideration.
Internal Rate of Return tries to find the discount rate at which the present
value of cash flows relating to future will become zero (Bizfluent, 2017).
Higher the IRR of any project better is the probability of the business to be
successful.
Now, looking at the Matheson Electronics’ IRR, then it is 9% (Appendix 11.3).
Interpreting the project solely on the basis of IRR is never a good idea as it
may lead the investor to invest in a wrong project. For example, there are two
projects, Project A of one year with IRR 20% and Project B of 15years with
IRR of 15%. If the investor will consider the selection or rejection of any
project basing on IRR then he would definitely choose Project A as it has a
greater IRR than Project B. But, if we look at the time duration of both the
project then Project A will last only for one year thereby will give a return of
20% only for a year however Project B is for 13 years which would give the
investor a return of 13% for 13 years. Such facts are not considered in the
IRR calculation (Harvard Business Review, 2016).
3.4 Accounting Rate of Return (ARR)
In the Accounting rate of return (ARR), the project is selected or rejected on
the basis of net income from the projects rather than basing the decision
upon cash flows from the projects (Cengage, n.d.). Average Rate of return
tells the investor about the return given by the project on every dollar
invested.
The project with which Matheson Electronics’ wants to proceed with has an
Average rate of return of 15% (Appendix 11.4). It means for every dollar
invested by the company into this project will get a return of 15%.
The problem with Average accounting return is it does not consider the time
value of money. It also ignores the timings of profit as it uses the profit
average while making calculation (Scottish Qualifications Authority,n.d.).
4
Managerial Finance
4. Sources of Finance
In order to run the business successfully the companies are required to meet their
working capital needs and also their long term needs for which they require a
extensive amount of capital. There are various ways and sources through which the
companies fulfil their needs of meeting the capital needs.
4.1 Personal Finance
The first thing and first source of finance which every business owner could find is
his own funds. Most of the start-up companies choose to finance their business with
the amount they have with them as their savings. Personal finance also includes the
borrowed funds from friends, relatives, personal loans from financial institutions etc.
4.2 Internal Source of Finance
Internal Source of finance is nothing but the accumulated funds maintained by the
company in the form of retained earnings, depreciation provisions, deferred taxation
etc.
4.3 External Source of Finance
There are usually two external sources of finance, one is the debt financing and the
other is equity financing. These two sources very popular sources of finance and are
also used very frequently and extensively by the business firms.
a) Equity Financing
Equity financing refers to the process of raising funds through the issue of shares to
the persons who are contributing funds and they are known as shareholders of the
company. They enjoy the ownership of the company to the extent of share held by
them. The shareholders receive the dividend at the time when company earns the
profit. However, company is not liable to pay dividends to the shareholders in case of
low profit or at the time it incurred loss.
b) Debt Financing
There are times when the business entities with good record of earnings over the
year and with good market reputation and goodwill often search for raising money
through outside sources in order to meet their capital needs. For meeting this need
companies issue debentures to the persons who lend money and for this lent
amount the company is liable to pay a fixed rate of interest to the debenture holders
5
⊘ This is a preview!⊘
Do you want full access?
Subscribe today to unlock all pages.
Trusted by 1+ million students worldwide
Managerial Finance
irrespective of whether the firm has earned profit or has incurred loss (Business
Management Ideas, n.d.).
5. Breakeven Analysis
Breakeven Analysis is the tool usually employed by the management of the company
and the management accountants. It gives them an idea about the level of sale at
which the income of the project equals the cost incurred on the project (Business,
2018). The breakeven analysis for the Matheson Electronics had been shown in
Appendix 11.5. From the table we could see that when the company will sell
5119(approx.) units of the electronic device (Device which Matheson Electronic is
planning to launch) then it will be able to cover its total costs which stand at
$184285.7.
5.1 Margin of Safety
The margin of safety is calculated to quantify business risk. It shows the
percentage by which the company could witness a drop in its sales figure before
it actually starts to incur losses. Higher Margin of Safety is considered good as it
shows the capability of the company to withstand the changes taking place in
sales. In case the company’s sale would fall below the margin of safety then it
would have to face net loss for that particular year or period.
The Margin of Safety for the Matheson Electronics had been computed in
Appendix 11.6. From the table we could see the company would not face the loss
related to the sales variability till it produces and sells 189881 units of the
electronic device. Up to this unit the company is free from the risk. So if the
company will produce more than 189881 units then the company could witness
3% drop in its sales before it starts facing the loss.
6. Cash Budget
Cash Budget reflects the future cash position of the business organisation. It reflects
the future sources of receipts and also the prospect areas where the company would
require paying cash. For any business organisation liquidity matters the most even
more than earning profit. Usually the forecast made in the cash budget is for a period
6
Paraphrase This Document
Need a fresh take? Get an instant paraphrase of this document with our AI Paraphraser
Managerial Finance
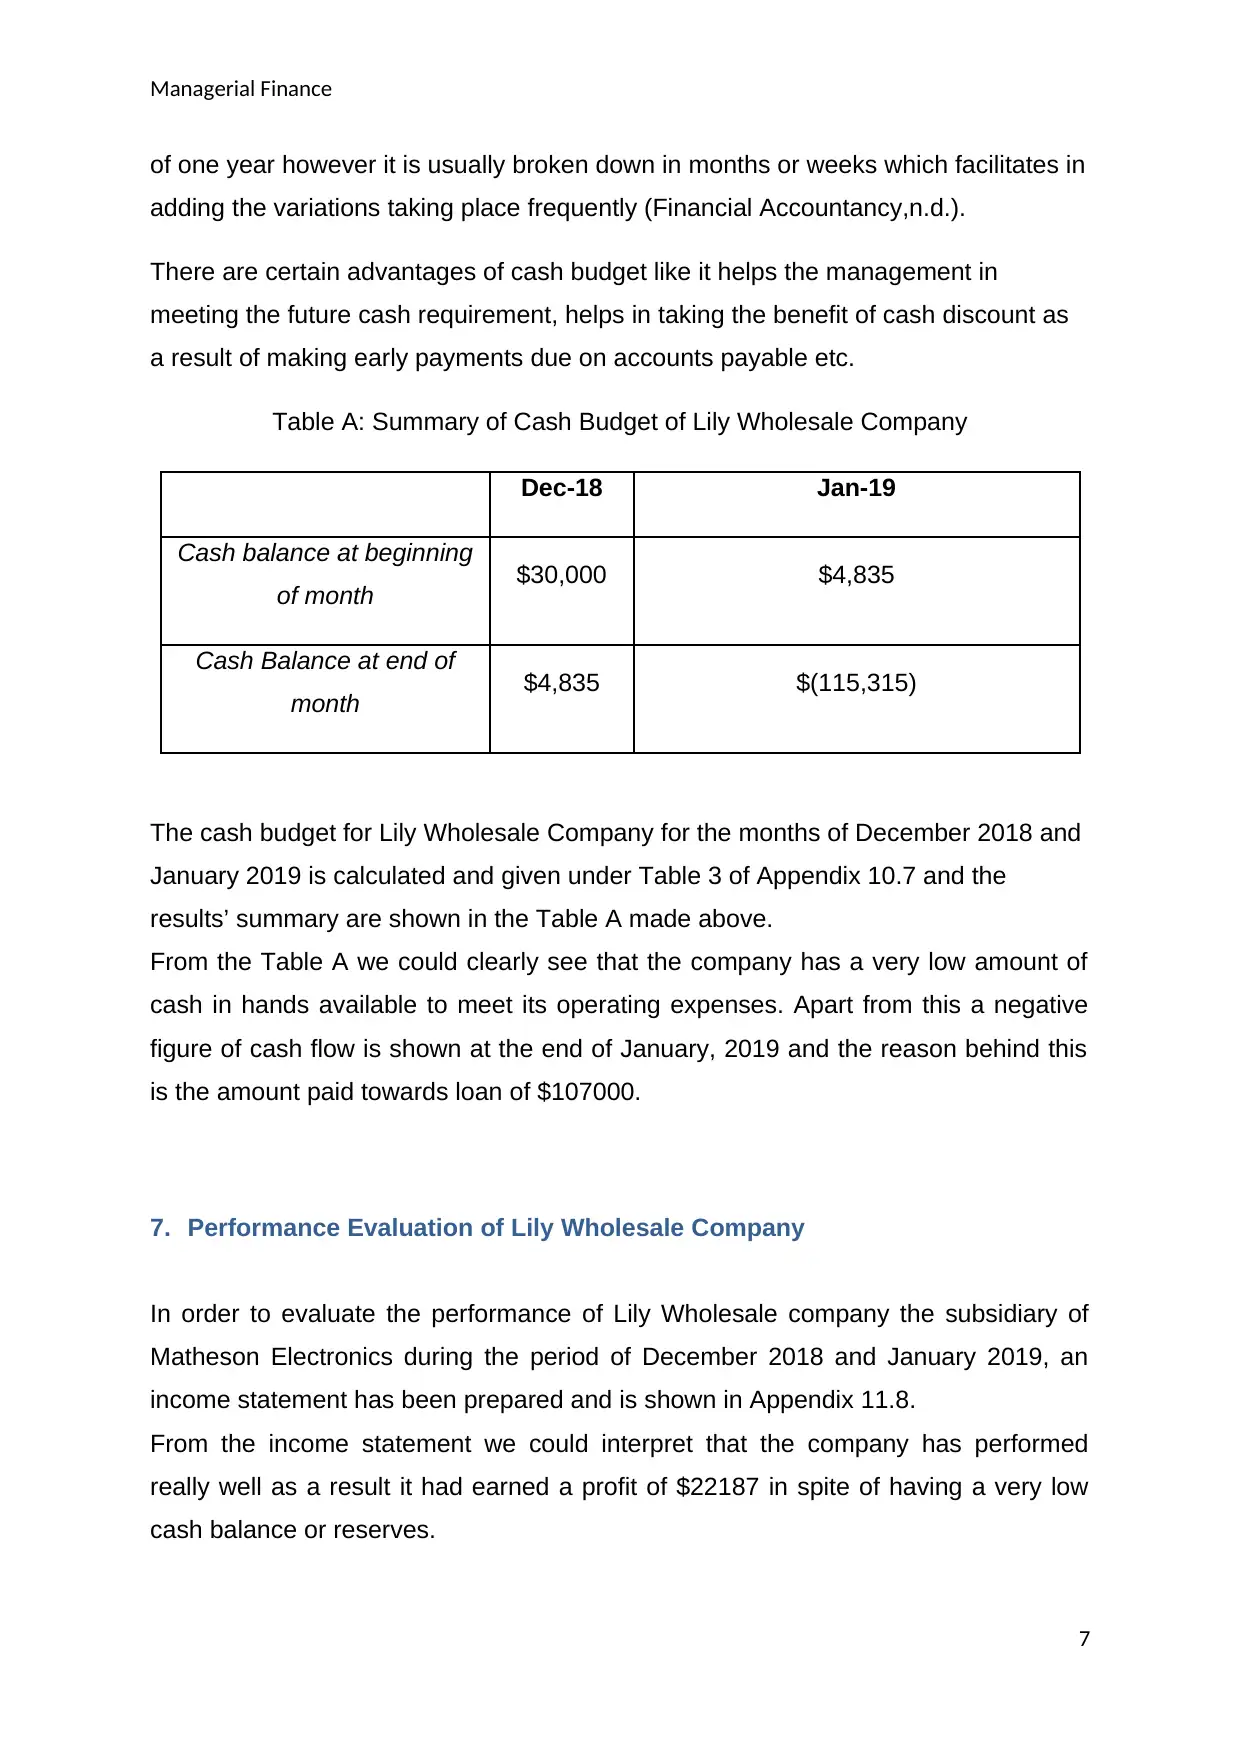
of one year however it is usually broken down in months or weeks which facilitates in
adding the variations taking place frequently (Financial Accountancy,n.d.).
There are certain advantages of cash budget like it helps the management in
meeting the future cash requirement, helps in taking the benefit of cash discount as
a result of making early payments due on accounts payable etc.
Table A: Summary of Cash Budget of Lily Wholesale Company
Dec-18 Jan-19
Cash balance at beginning
of month $30,000 $4,835
Cash Balance at end of
month $4,835 $(115,315)
The cash budget for Lily Wholesale Company for the months of December 2018 and
January 2019 is calculated and given under Table 3 of Appendix 10.7 and the
results’ summary are shown in the Table A made above.
From the Table A we could clearly see that the company has a very low amount of
cash in hands available to meet its operating expenses. Apart from this a negative
figure of cash flow is shown at the end of January, 2019 and the reason behind this
is the amount paid towards loan of $107000.
7. Performance Evaluation of Lily Wholesale Company
In order to evaluate the performance of Lily Wholesale company the subsidiary of
Matheson Electronics during the period of December 2018 and January 2019, an
income statement has been prepared and is shown in Appendix 11.8.
From the income statement we could interpret that the company has performed
really well as a result it had earned a profit of $22187 in spite of having a very low
cash balance or reserves.
7
Managerial Finance
8. Issues to be considered by Matheson Electronics
The electronic device which Matheson Electronics is planning to produce and launch
in the market facilitates the driver in knowing about the number of miles the
automobile is able to travel per gallon of gasoline. The market would get such a
product for the first time so Matheson Electronics could charge a good sum for the
unique and innovative device and could earn a good amount of return.
Next, since the product is new in the market and there are no competitors selling the
same product in the market, Matheson Electronics could use it as its competitive
advantage.
Matheson Electronics could also employ the cost leadership strategy. At the start the
company will not have any competitor as a result it could sell the device at a higher
price in order to earn more profit. However, since it does not takes time for other
companies to copy the technology so by that time Matheson Electronics could go for
producing the device at a larger scale and earn the economies of scale which would
lower the cost incurred on producing each device. This would help the company in
selling the device at a lower price than that of their competitors and earn profit
Other way is the company could focus on increasing the market share with the help
of reduced price. Increasing the market share would result in reduced cost and
increased profit.
If Matheson Electronics would apply the above stated cost leadership strategy
successfully then it would get other benefits like capital would be easily accessible in
order to invest in technology.
Matheson Electronics is coming with a completely unique product which shows that
the company has employed differentiation strategy. However, to remain competitive
in the market the company is required to remain focussed on the continuous
development of the device or else the risk of competitor would go high.
9. Conclusion
So Matheson Electronics should not proceed with the project of launching the type of
electronic device which could assist driver in understanding the number of miles the
8
⊘ This is a preview!⊘
Do you want full access?
Subscribe today to unlock all pages.
Trusted by 1+ million students worldwide

Managerial Finance
automobile could travel per gallon of gasoline because it has a negative NPV which
is considered to be very important for project selection and then it has a very long
payback period of approximately 8 years where the project life is itself 12 years. Now
talking about the performance of Lily Wholesale Company which is the subsidiary of
Matheson Electronics then it has performed well as a result of which in spite of
having a low cash balance it managed to generate profit.
9
Paraphrase This Document
Need a fresh take? Get an instant paraphrase of this document with our AI Paraphraser
Managerial Finance
10. References
Business.(2018).Break even analysis.[Online].Available 2 June, 2019
https://www.business.gov.au/planning/business-plans/writing-a-business-plan/break-
even-analysis.
Bell, P.(2017).Introducing the Net Present Value Profile.[Online].Available 2 June,
2019 https://mpra.ub.uni-muenchen.de/79764/1/MPRA_paper_79764.pdf.
Bizfluent.(2017).The Advantages & Disadvantages of the Internal Rate of Return
Method.[Online].Available 2 June, 2019 https://bizfluent.com/info-8564382-
advantages-internal-rate-return-method.html.
Business Management Ideas.(n.d.).Sources of Finance:Internal and External
Industries.[Online].Available 2 June, 2019
http://www.businessmanagementideas.com/financial-management/sources-of-
finance-internal-and-external-industries/10548.
Cengage.(n.d.).The Accounting Rate of Return (ARR).[Online].Available 2 June,
2019
http://www.cengage.com/resource_uploads/downloads/0324594690_163041.pdf.
Financial Accountancy.(2018).Break even analysis.[Online].Available 2 June, 2019
http://www.financialaccountancy.org/management-of-cash-budgets/introduction-to-
cash-budget/.
Harvard Business Review.(2016).A Refresher on Internal Rate of Return.
[Online].Available 2 June, 2019 https://hbr.org/2016/03/a-refresher-on-internal-rate-
of-return.
Scottish Qualifications Authority.(n.d.).Capital Investment Appraisal- Advantages &
Disadvantage of Different Methods.[Online].Available 2 June, 2019
https://cn.sqa.org.uk/files/professional-development-conference-2017/day2/
MangementAccountingDecisionMakingPack3ChrisAtkinson.pdf.
10
Managerial Finance
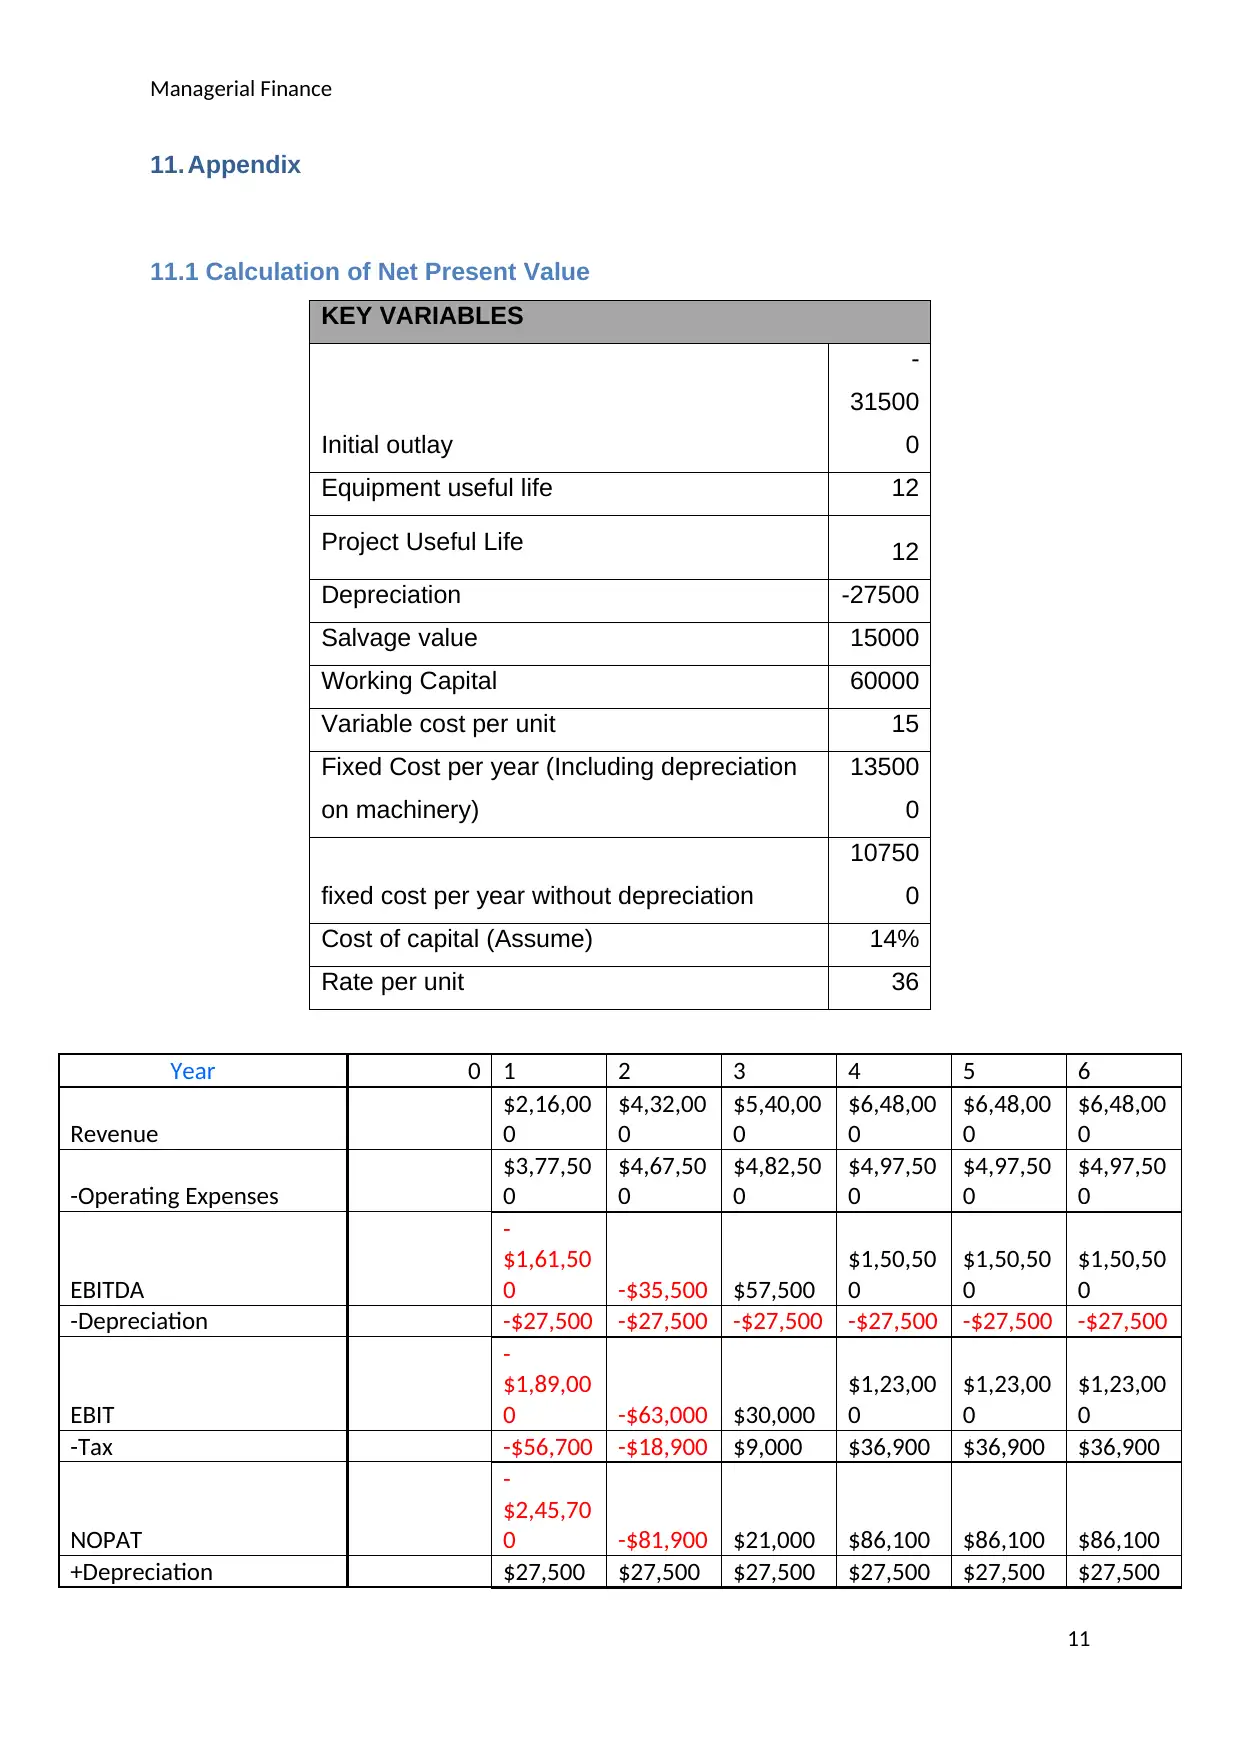
11. Appendix
11.1 Calculation of Net Present Value
KEY VARIABLES
Initial outlay
-
31500
0
Equipment useful life 12
Project Useful Life 12
Depreciation -27500
Salvage value 15000
Working Capital 60000
Variable cost per unit 15
Fixed Cost per year (Including depreciation
on machinery)
13500
0
fixed cost per year without depreciation
10750
0
Cost of capital (Assume) 14%
Rate per unit 36
Year 0 1 2 3 4 5 6
Revenue
$2,16,00
0
$4,32,00
0
$5,40,00
0
$6,48,00
0
$6,48,00
0
$6,48,00
0
-Operating Expenses
$3,77,50
0
$4,67,50
0
$4,82,50
0
$4,97,50
0
$4,97,50
0
$4,97,50
0
EBITDA
-
$1,61,50
0 -$35,500 $57,500
$1,50,50
0
$1,50,50
0
$1,50,50
0
-Depreciation -$27,500 -$27,500 -$27,500 -$27,500 -$27,500 -$27,500
EBIT
-
$1,89,00
0 -$63,000 $30,000
$1,23,00
0
$1,23,00
0
$1,23,00
0
-Tax -$56,700 -$18,900 $9,000 $36,900 $36,900 $36,900
NOPAT
-
$2,45,70
0 -$81,900 $21,000 $86,100 $86,100 $86,100
+Depreciation $27,500 $27,500 $27,500 $27,500 $27,500 $27,500
11
⊘ This is a preview!⊘
Do you want full access?
Subscribe today to unlock all pages.
Trusted by 1+ million students worldwide
1 out of 18
Related Documents


Your All-in-One AI-Powered Toolkit for Academic Success.
+13062052269
info@desklib.com
Available 24*7 on WhatsApp / Email
![[object Object]](/_next/static/media/star-bottom.7253800d.svg)
Unlock your academic potential
Copyright © 2020–2026 A2Z Services. All Rights Reserved. Developed and managed by ZUCOL.