Maths for Computing 2016 Coursework
VerifiedAdded on 2019/09/18
|6
|2121
|481
Report
AI Summary
This is a coursework assignment for the 'Maths for Computing' course, focusing on a business problem faced by a fictional company, BPP Lyft. The assignment requires students to analyze provided data, build a regression model to predict sales revenue, create decision tables for sales, costs, and profit, calculate expected profit, and provide a recommendation on the optimal size of an operations hub. The report should include an introduction, data overview, regression model description, summary of alternatives, expected profit analysis, and a conclusion with a recommendation. The report is assessed based on various criteria, including the quality of analysis, clarity of discussion, and report writing skills.
BSc (Hons) Digital and Technology
Solutions
Maths for Computing
Coursework Assessment Brief
Winter Term 2016
Solutions
Maths for Computing
Coursework Assessment Brief
Winter Term 2016
Paraphrase This Document
Need a fresh take? Get an instant paraphrase of this document with our AI Paraphraser
Maths for Computing
2016 Coursework Assessment Brief
1. Problem Description
BPP Lyft is a UK rival of Uber, the American multinational online transportation network company
offering driver services to customers through its mobile app. They have been operating within the UK
successfully for many years, and despite the uncertainty surrounding Britain’s exit from Europe, they
are taking a long term view and are now considering further expansion of their fleet of autonomous
‘self-driven’ vehicles by launching its services in Leicester. The managing director, Robert Jules (RJ),
financial director, Eva Watkins (EW) and marketing director, Jonathan Kent (JK) have met recently to
discuss the decision. Below is an extract from that meeting which took place at the company’s main
headquarters in London.
RJ: We've finally been able to identify a suitable site for the new fleet in Leicester. The site has plenty of
room and we shall need to decide how large an operations hub to build. If we use one of our standard
designs then we shall have to decide between a small, medium or large operations hub.
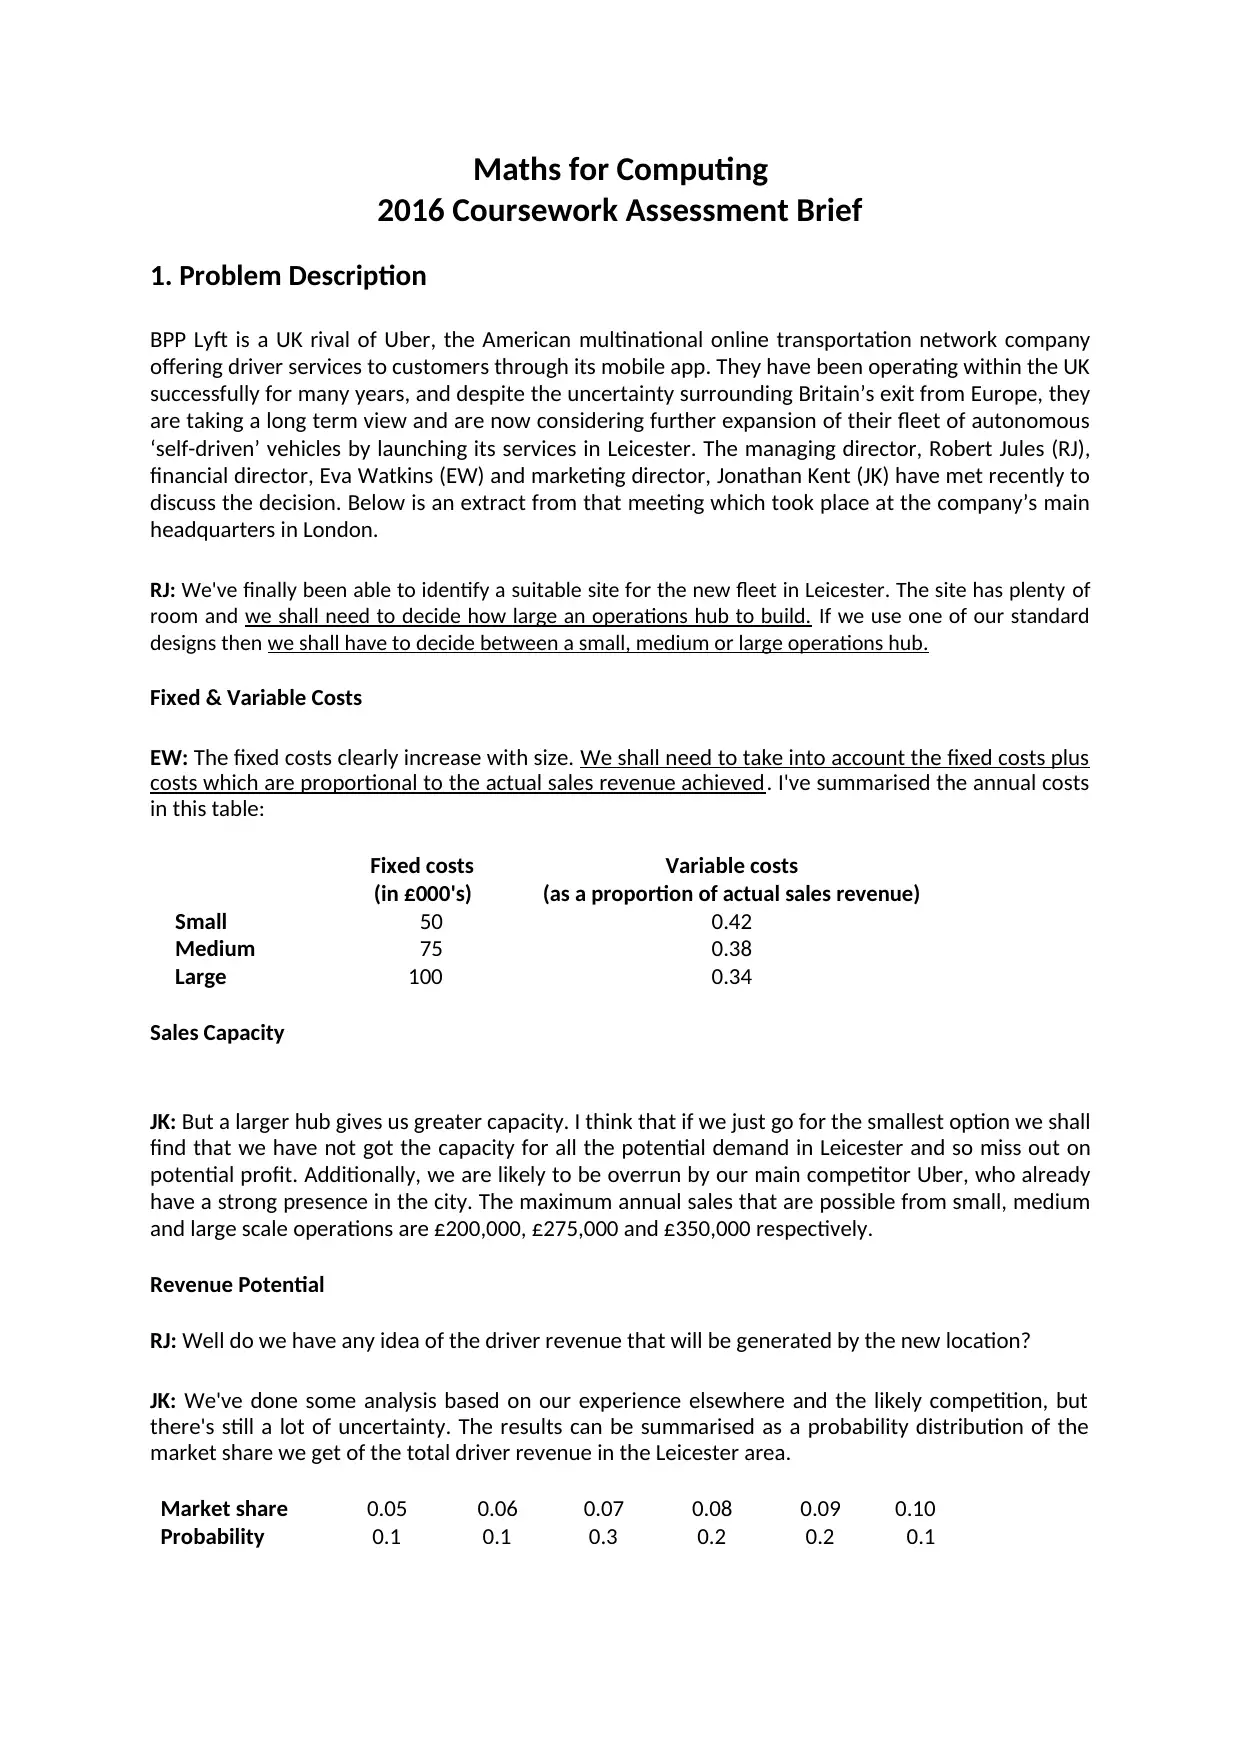
Fixed & Variable Costs
EW: The fixed costs clearly increase with size. We shall need to take into account the fixed costs plus
costs which are proportional to the actual sales revenue achieved. I've summarised the annual costs
in this table:
Fixed costs Variable costs
(in £000's) (as a proportion of actual sales revenue)
Small 50 0.42
Medium 75 0.38
Large 100 0.34
Sales Capacity
JK: But a larger hub gives us greater capacity. I think that if we just go for the smallest option we shall
find that we have not got the capacity for all the potential demand in Leicester and so miss out on
potential profit. Additionally, we are likely to be overrun by our main competitor Uber, who already
have a strong presence in the city. The maximum annual sales that are possible from small, medium
and large scale operations are £200,000, £275,000 and £350,000 respectively.
Revenue Potential
RJ: Well do we have any idea of the driver revenue that will be generated by the new location?
JK: We've done some analysis based on our experience elsewhere and the likely competition, but
there's still a lot of uncertainty. The results can be summarised as a probability distribution of the
market share we get of the total driver revenue in the Leicester area.
Market share 0.05 0.06 0.07 0.08 0.09 0.10
Probability 0.1 0.1 0.3 0.2 0.2 0.1
2016 Coursework Assessment Brief
1. Problem Description
BPP Lyft is a UK rival of Uber, the American multinational online transportation network company
offering driver services to customers through its mobile app. They have been operating within the UK
successfully for many years, and despite the uncertainty surrounding Britain’s exit from Europe, they
are taking a long term view and are now considering further expansion of their fleet of autonomous
‘self-driven’ vehicles by launching its services in Leicester. The managing director, Robert Jules (RJ),
financial director, Eva Watkins (EW) and marketing director, Jonathan Kent (JK) have met recently to
discuss the decision. Below is an extract from that meeting which took place at the company’s main
headquarters in London.
RJ: We've finally been able to identify a suitable site for the new fleet in Leicester. The site has plenty of
room and we shall need to decide how large an operations hub to build. If we use one of our standard
designs then we shall have to decide between a small, medium or large operations hub.
Fixed & Variable Costs
EW: The fixed costs clearly increase with size. We shall need to take into account the fixed costs plus
costs which are proportional to the actual sales revenue achieved. I've summarised the annual costs
in this table:
Fixed costs Variable costs
(in £000's) (as a proportion of actual sales revenue)
Small 50 0.42
Medium 75 0.38
Large 100 0.34
Sales Capacity
JK: But a larger hub gives us greater capacity. I think that if we just go for the smallest option we shall
find that we have not got the capacity for all the potential demand in Leicester and so miss out on
potential profit. Additionally, we are likely to be overrun by our main competitor Uber, who already
have a strong presence in the city. The maximum annual sales that are possible from small, medium
and large scale operations are £200,000, £275,000 and £350,000 respectively.
Revenue Potential
RJ: Well do we have any idea of the driver revenue that will be generated by the new location?
JK: We've done some analysis based on our experience elsewhere and the likely competition, but
there's still a lot of uncertainty. The results can be summarised as a probability distribution of the
market share we get of the total driver revenue in the Leicester area.
Market share 0.05 0.06 0.07 0.08 0.09 0.10
Probability 0.1 0.1 0.3 0.2 0.2 0.1
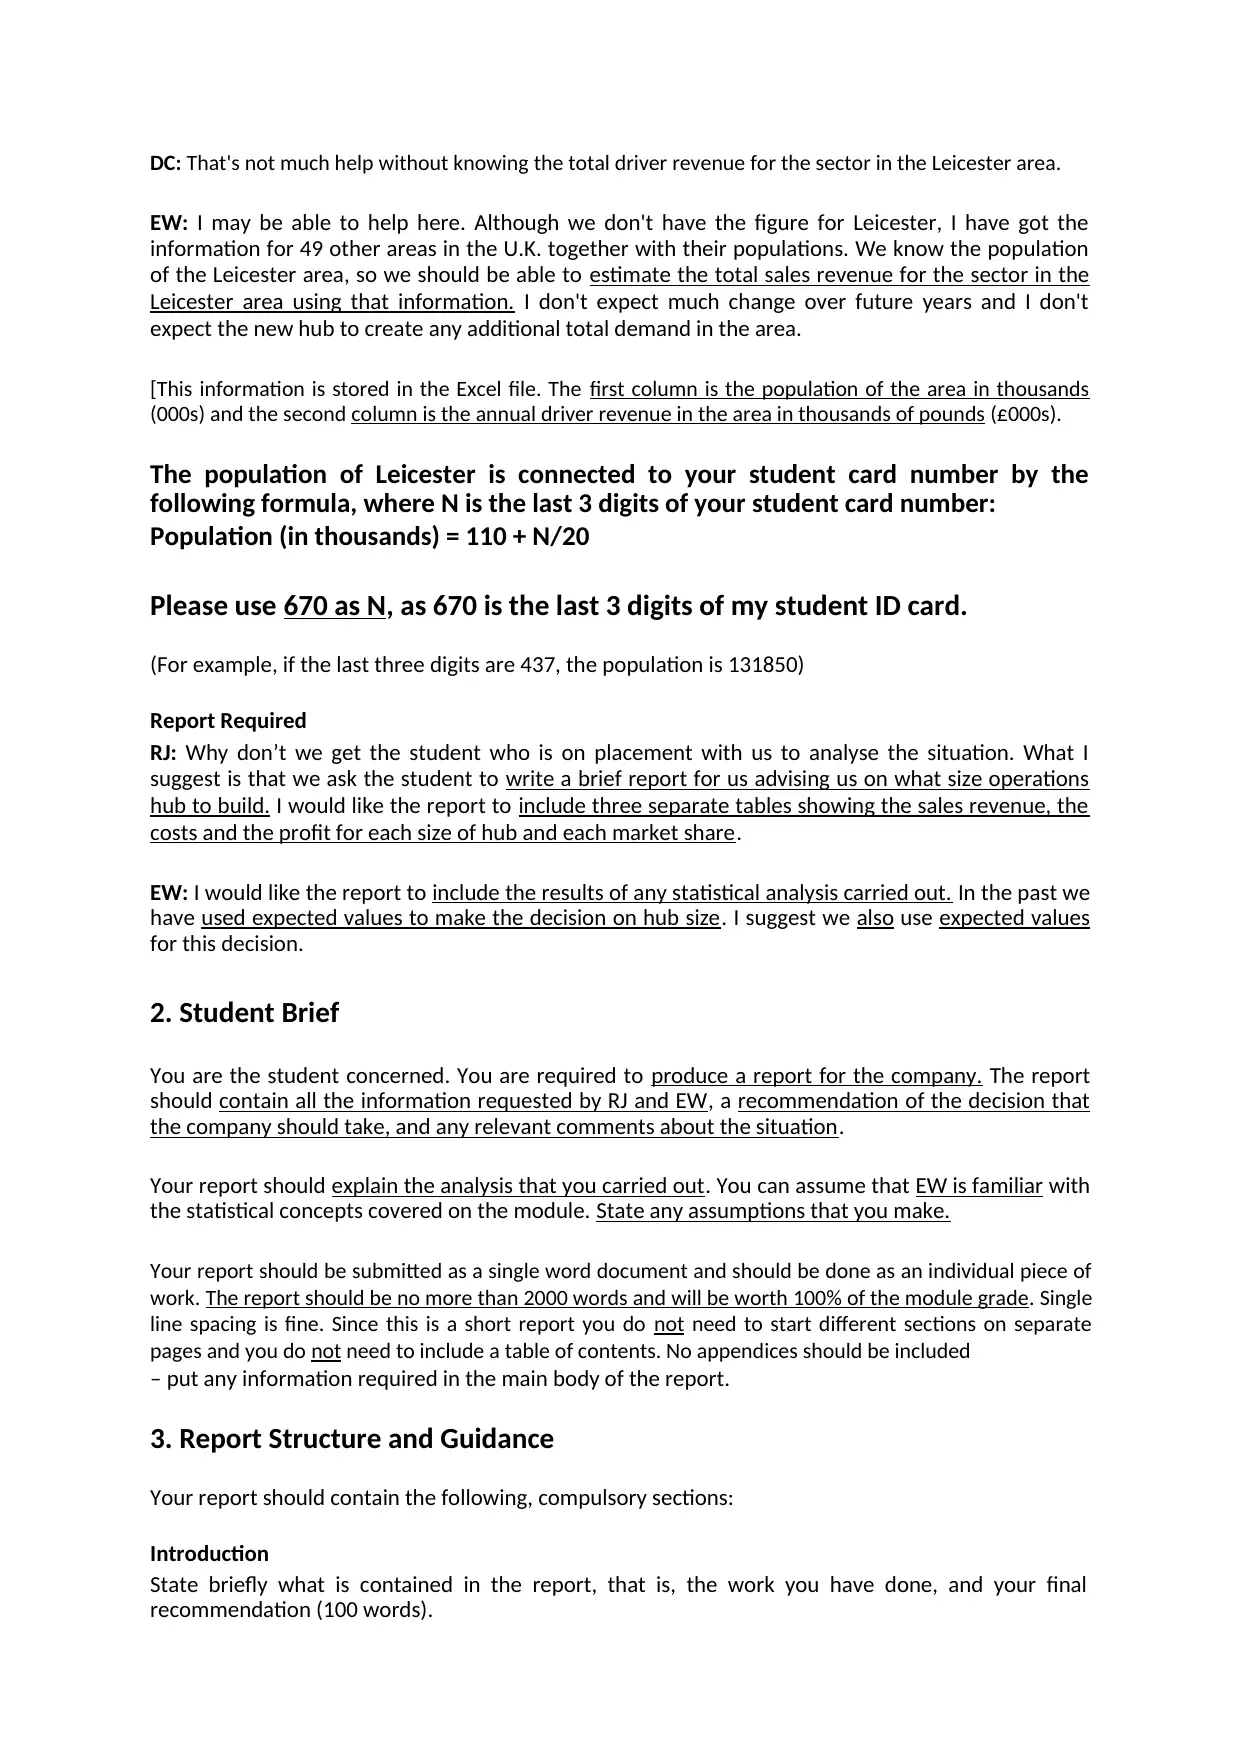
DC: That's not much help without knowing the total driver revenue for the sector in the Leicester area.
EW: I may be able to help here. Although we don't have the figure for Leicester, I have got the
information for 49 other areas in the U.K. together with their populations. We know the population
of the Leicester area, so we should be able to estimate the total sales revenue for the sector in the
Leicester area using that information. I don't expect much change over future years and I don't
expect the new hub to create any additional total demand in the area.
[This information is stored in the Excel file. The first column is the population of the area in thousands
(000s) and the second column is the annual driver revenue in the area in thousands of pounds (£000s).
The population of Leicester is connected to your student card number by the
following formula, where N is the last 3 digits of your student card number:
Population (in thousands) = 110 + N/20
Please use 670 as N, as 670 is the last 3 digits of my student ID card.
(For example, if the last three digits are 437, the population is 131850)
Report Required
RJ: Why don’t we get the student who is on placement with us to analyse the situation. What I
suggest is that we ask the student to write a brief report for us advising us on what size operations
hub to build. I would like the report to include three separate tables showing the sales revenue, the
costs and the profit for each size of hub and each market share.
EW: I would like the report to include the results of any statistical analysis carried out. In the past we
have used expected values to make the decision on hub size. I suggest we also use expected values
for this decision.
2. Student Brief
You are the student concerned. You are required to produce a report for the company. The report
should contain all the information requested by RJ and EW, a recommendation of the decision that
the company should take, and any relevant comments about the situation.
Your report should explain the analysis that you carried out. You can assume that EW is familiar with
the statistical concepts covered on the module. State any assumptions that you make.
Your report should be submitted as a single word document and should be done as an individual piece of
work. The report should be no more than 2000 words and will be worth 100% of the module grade. Single
line spacing is fine. Since this is a short report you do not need to start different sections on separate
pages and you do not need to include a table of contents. No appendices should be included
– put any information required in the main body of the report.
3. Report Structure and Guidance
Your report should contain the following, compulsory sections:
Introduction
State briefly what is contained in the report, that is, the work you have done, and your final
recommendation (100 words).
⊘ This is a preview!⊘
Do you want full access?
Subscribe today to unlock all pages.
Trusted by 1+ million students worldwide

Overview of data
Paraphrase This Document
Need a fresh take? Get an instant paraphrase of this document with our AI Paraphraser
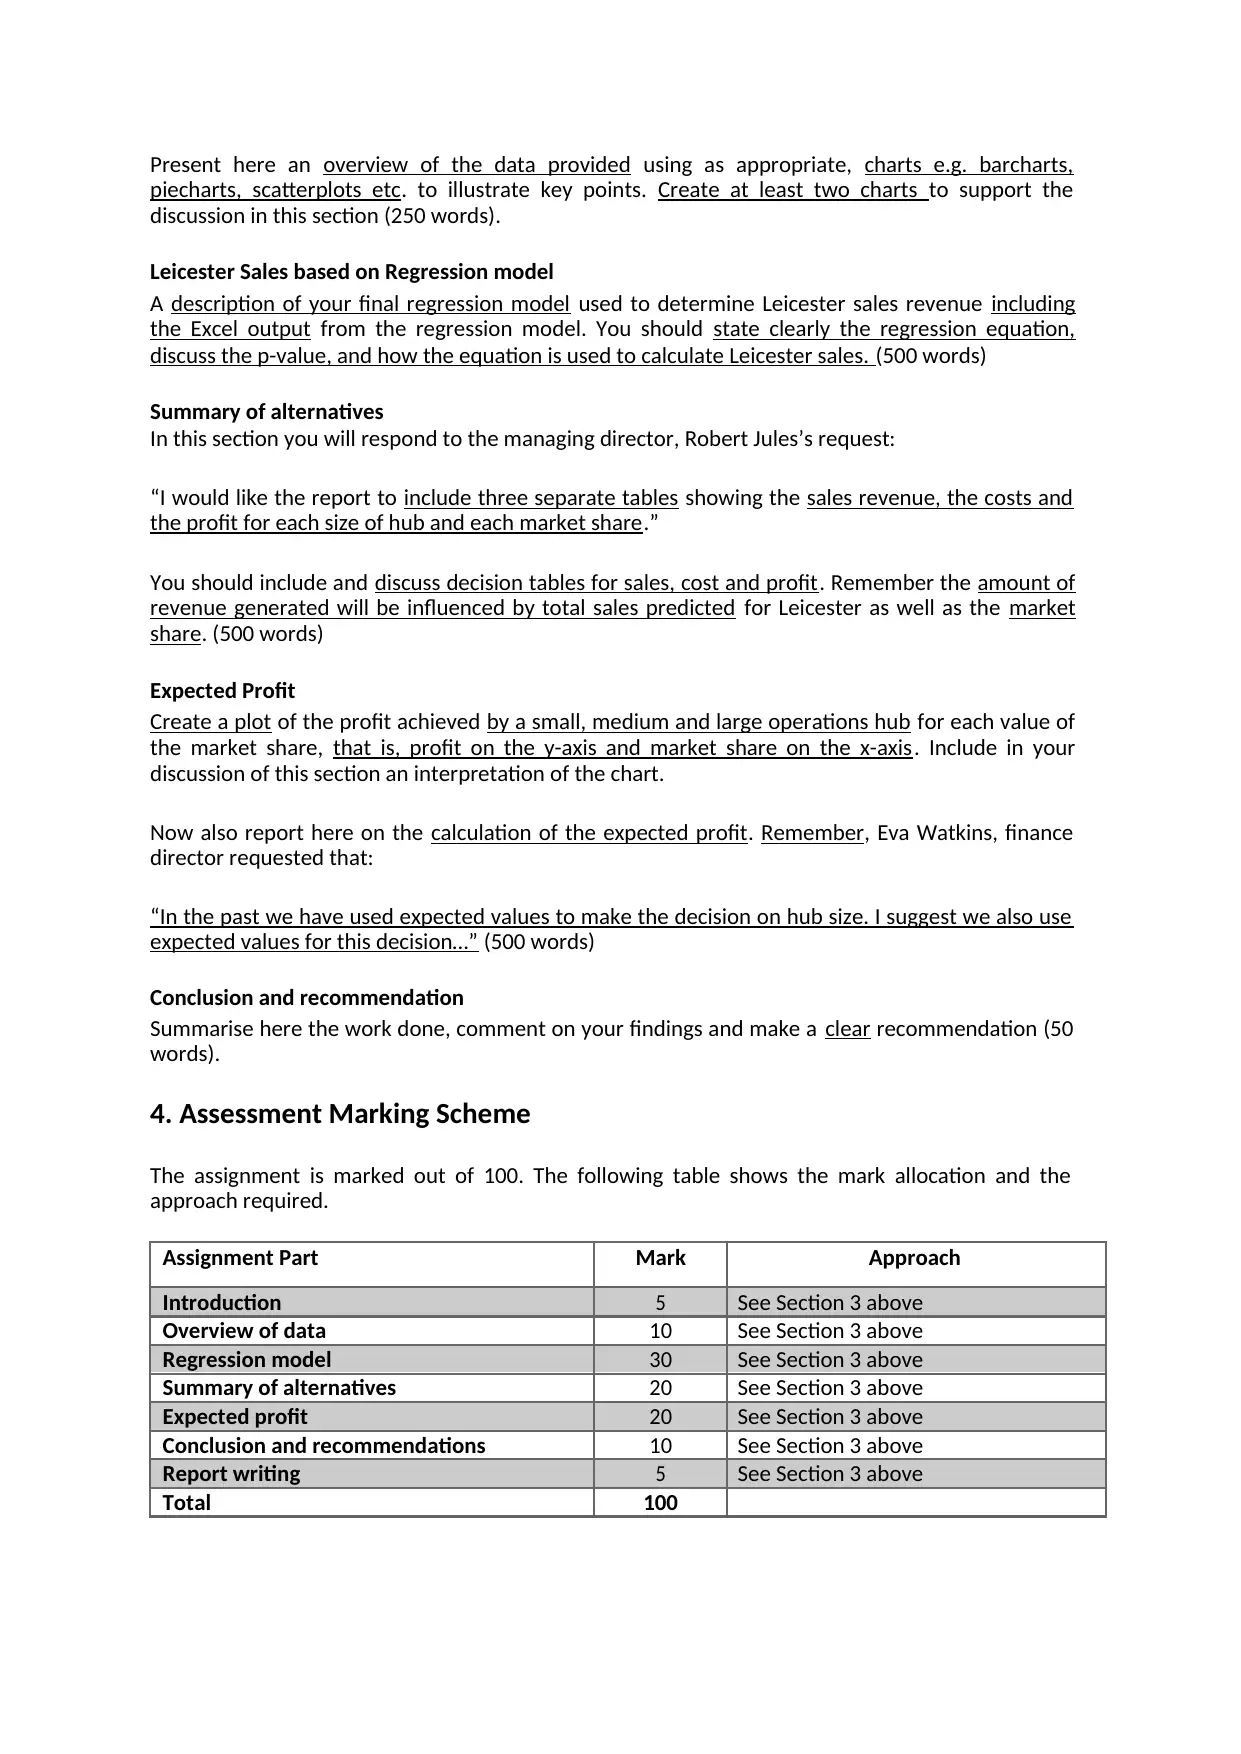
Present here an overview of the data provided using as appropriate, charts e.g. barcharts,
piecharts, scatterplots etc. to illustrate key points. Create at least two charts to support the
discussion in this section (250 words).
Leicester Sales based on Regression model
A description of your final regression model used to determine Leicester sales revenue including
the Excel output from the regression model. You should state clearly the regression equation,
discuss the p-value, and how the equation is used to calculate Leicester sales. (500 words)
Summary of alternatives
In this section you will respond to the managing director, Robert Jules’s request:
“I would like the report to include three separate tables showing the sales revenue, the costs and
the profit for each size of hub and each market share.”
You should include and discuss decision tables for sales, cost and profit. Remember the amount of
revenue generated will be influenced by total sales predicted for Leicester as well as the market
share. (500 words)
Expected Profit
Create a plot of the profit achieved by a small, medium and large operations hub for each value of
the market share, that is, profit on the y-axis and market share on the x-axis. Include in your
discussion of this section an interpretation of the chart.
Now also report here on the calculation of the expected profit. Remember, Eva Watkins, finance
director requested that:
“In the past we have used expected values to make the decision on hub size. I suggest we also use
expected values for this decision…” (500 words)
Conclusion and recommendation
Summarise here the work done, comment on your findings and make a clear recommendation (50
words).
4. Assessment Marking Scheme
The assignment is marked out of 100. The following table shows the mark allocation and the
approach required.
Assignment Part Mark Approach
Introduction 5 See Section 3 above
Overview of data 10 See Section 3 above
Regression model 30 See Section 3 above
Summary of alternatives 20 See Section 3 above
Expected profit 20 See Section 3 above
Conclusion and recommendations 10 See Section 3 above
Report writing 5 See Section 3 above
Total 100
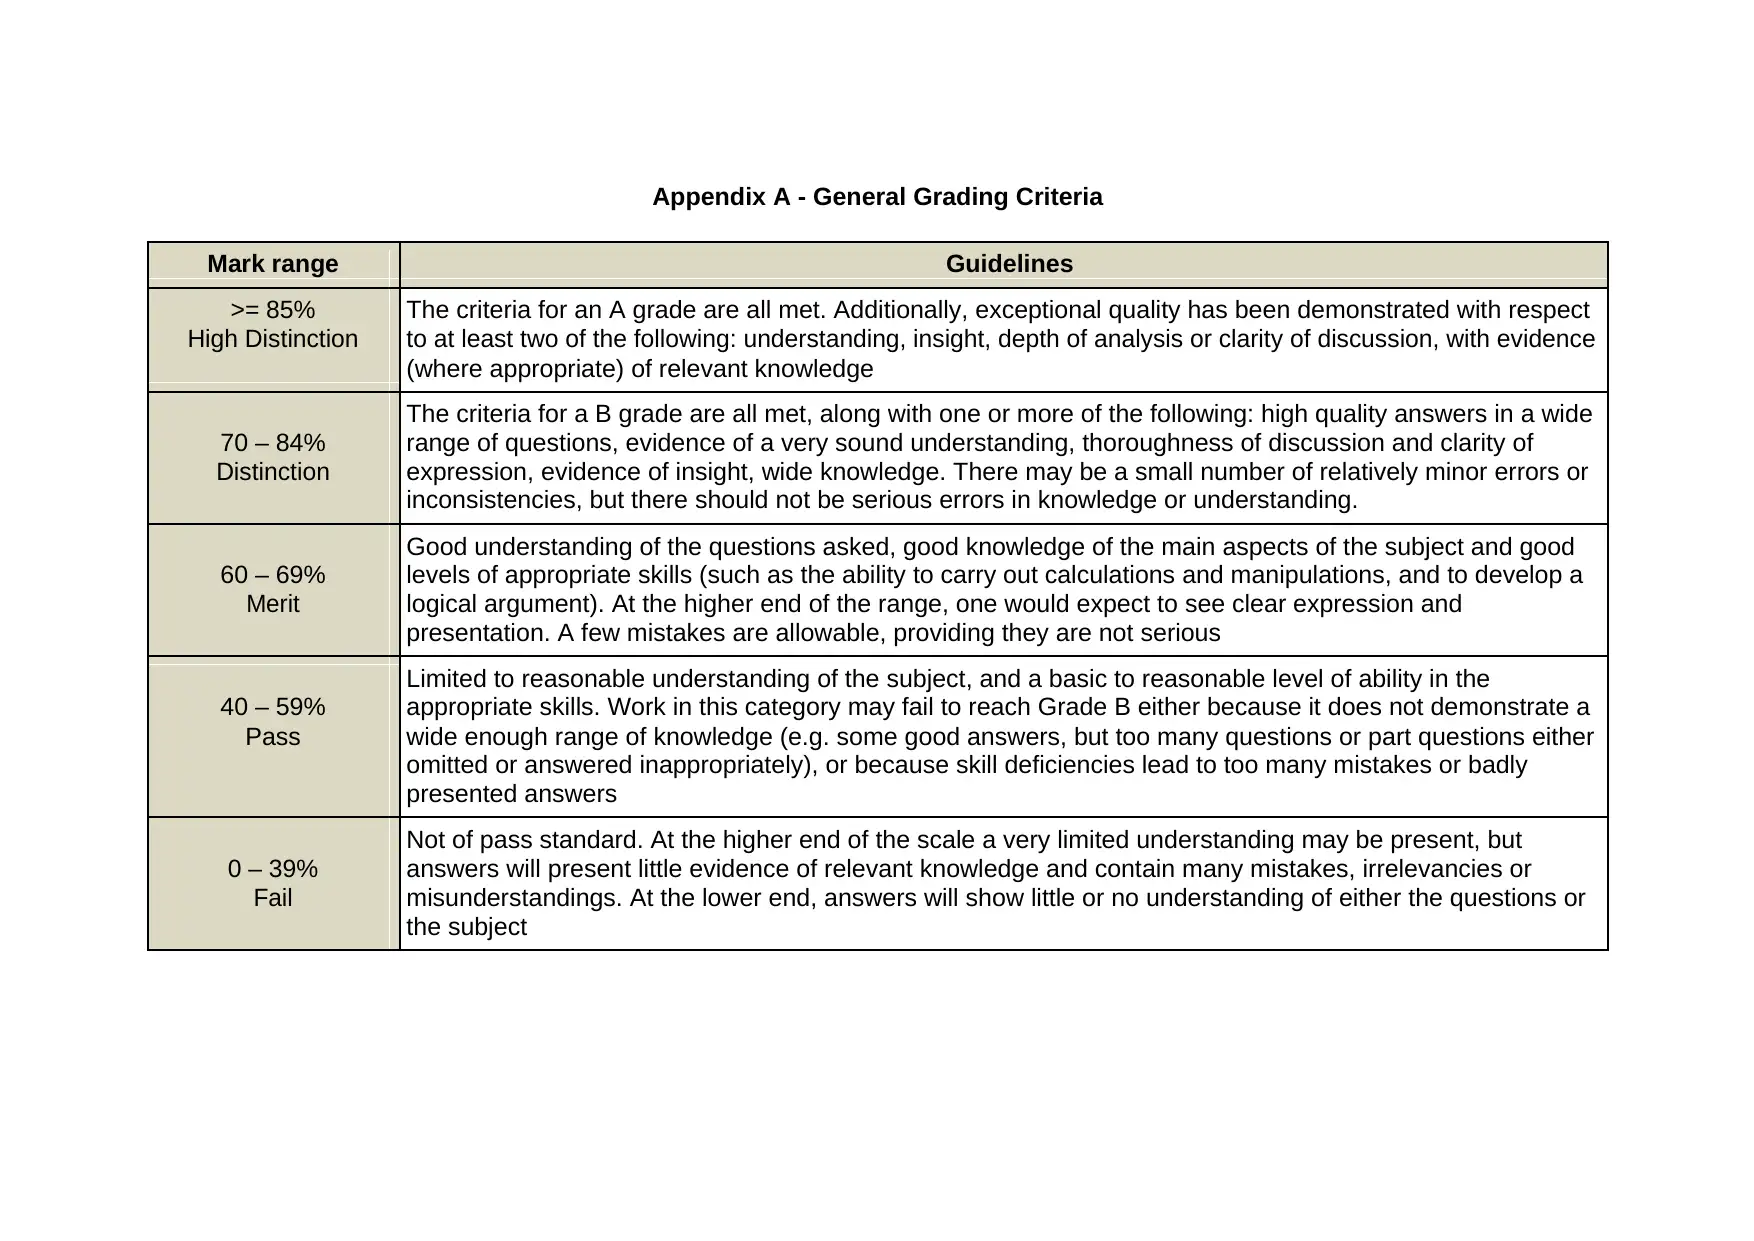
Appendix A - General Grading Criteria
Mark range Guidelines
>= 85% The criteria for an A grade are all met. Additionally, exceptional quality has been demonstrated with respect
High Distinction to at least two of the following: understanding, insight, depth of analysis or clarity of discussion, with evidence
(where appropriate) of relevant knowledge
The criteria for a B grade are all met, along with one or more of the following: high quality answers in a wide
70 – 84% range of questions, evidence of a very sound understanding, thoroughness of discussion and clarity of
Distinction expression, evidence of insight, wide knowledge. There may be a small number of relatively minor errors or
inconsistencies, but there should not be serious errors in knowledge or understanding.
Good understanding of the questions asked, good knowledge of the main aspects of the subject and good
60 – 69% levels of appropriate skills (such as the ability to carry out calculations and manipulations, and to develop a
Merit logical argument). At the higher end of the range, one would expect to see clear expression and
presentation. A few mistakes are allowable, providing they are not serious
Limited to reasonable understanding of the subject, and a basic to reasonable level of ability in the
40 – 59% appropriate skills. Work in this category may fail to reach Grade B either because it does not demonstrate a
Pass wide enough range of knowledge (e.g. some good answers, but too many questions or part questions either
omitted or answered inappropriately), or because skill deficiencies lead to too many mistakes or badly
presented answers
Not of pass standard. At the higher end of the scale a very limited understanding may be present, but
0 – 39% answers will present little evidence of relevant knowledge and contain many mistakes, irrelevancies or
Fail misunderstandings. At the lower end, answers will show little or no understanding of either the questions or
the subject
⊘ This is a preview!⊘
Do you want full access?
Subscribe today to unlock all pages.
Trusted by 1+ million students worldwide
1 out of 6
Your All-in-One AI-Powered Toolkit for Academic Success.
+13062052269
info@desklib.com
Available 24*7 on WhatsApp / Email
![[object Object]](/_next/static/media/star-bottom.7253800d.svg)
Unlock your academic potential
Copyright © 2020–2026 A2Z Services. All Rights Reserved. Developed and managed by ZUCOL.