Mathematics and Statistics Homework Assignment - DCU, 2019
VerifiedAdded on 2022/11/15
|15
|3314
|129
Homework Assignment
AI Summary
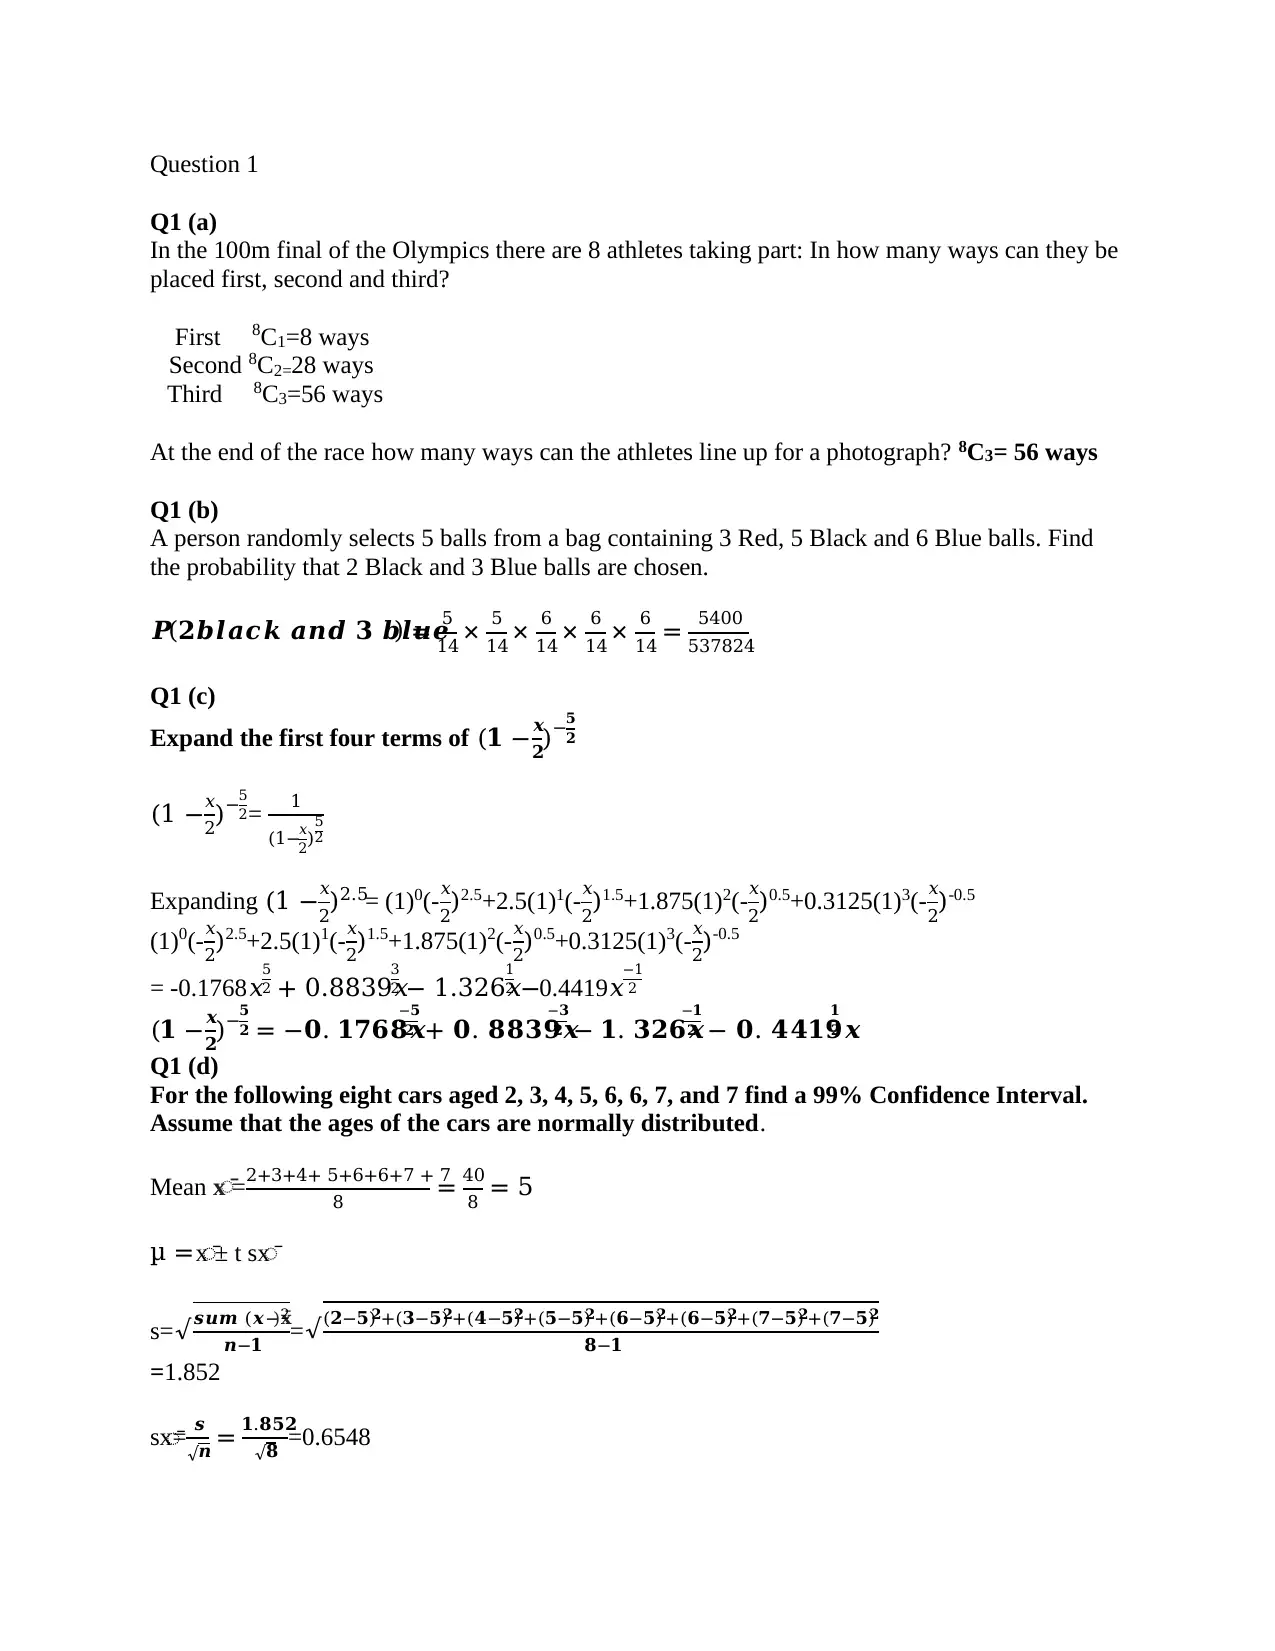
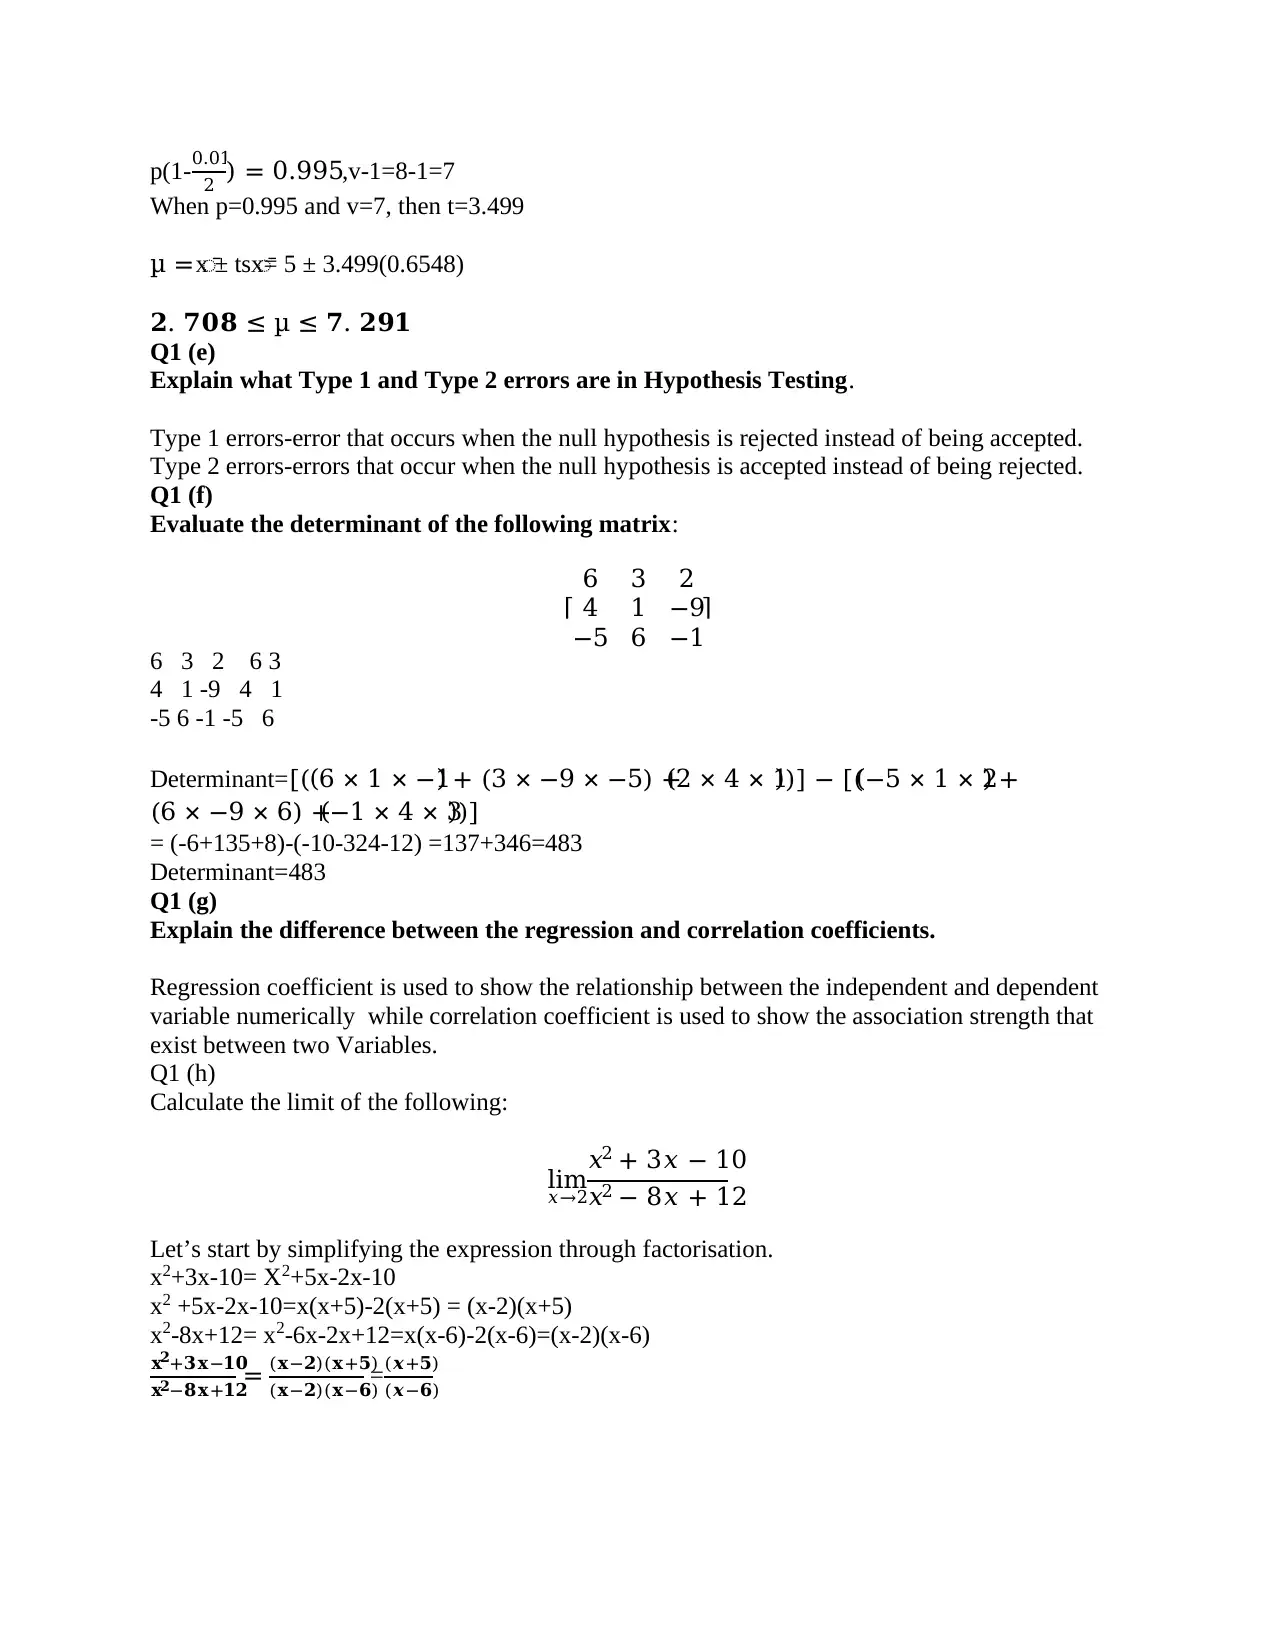
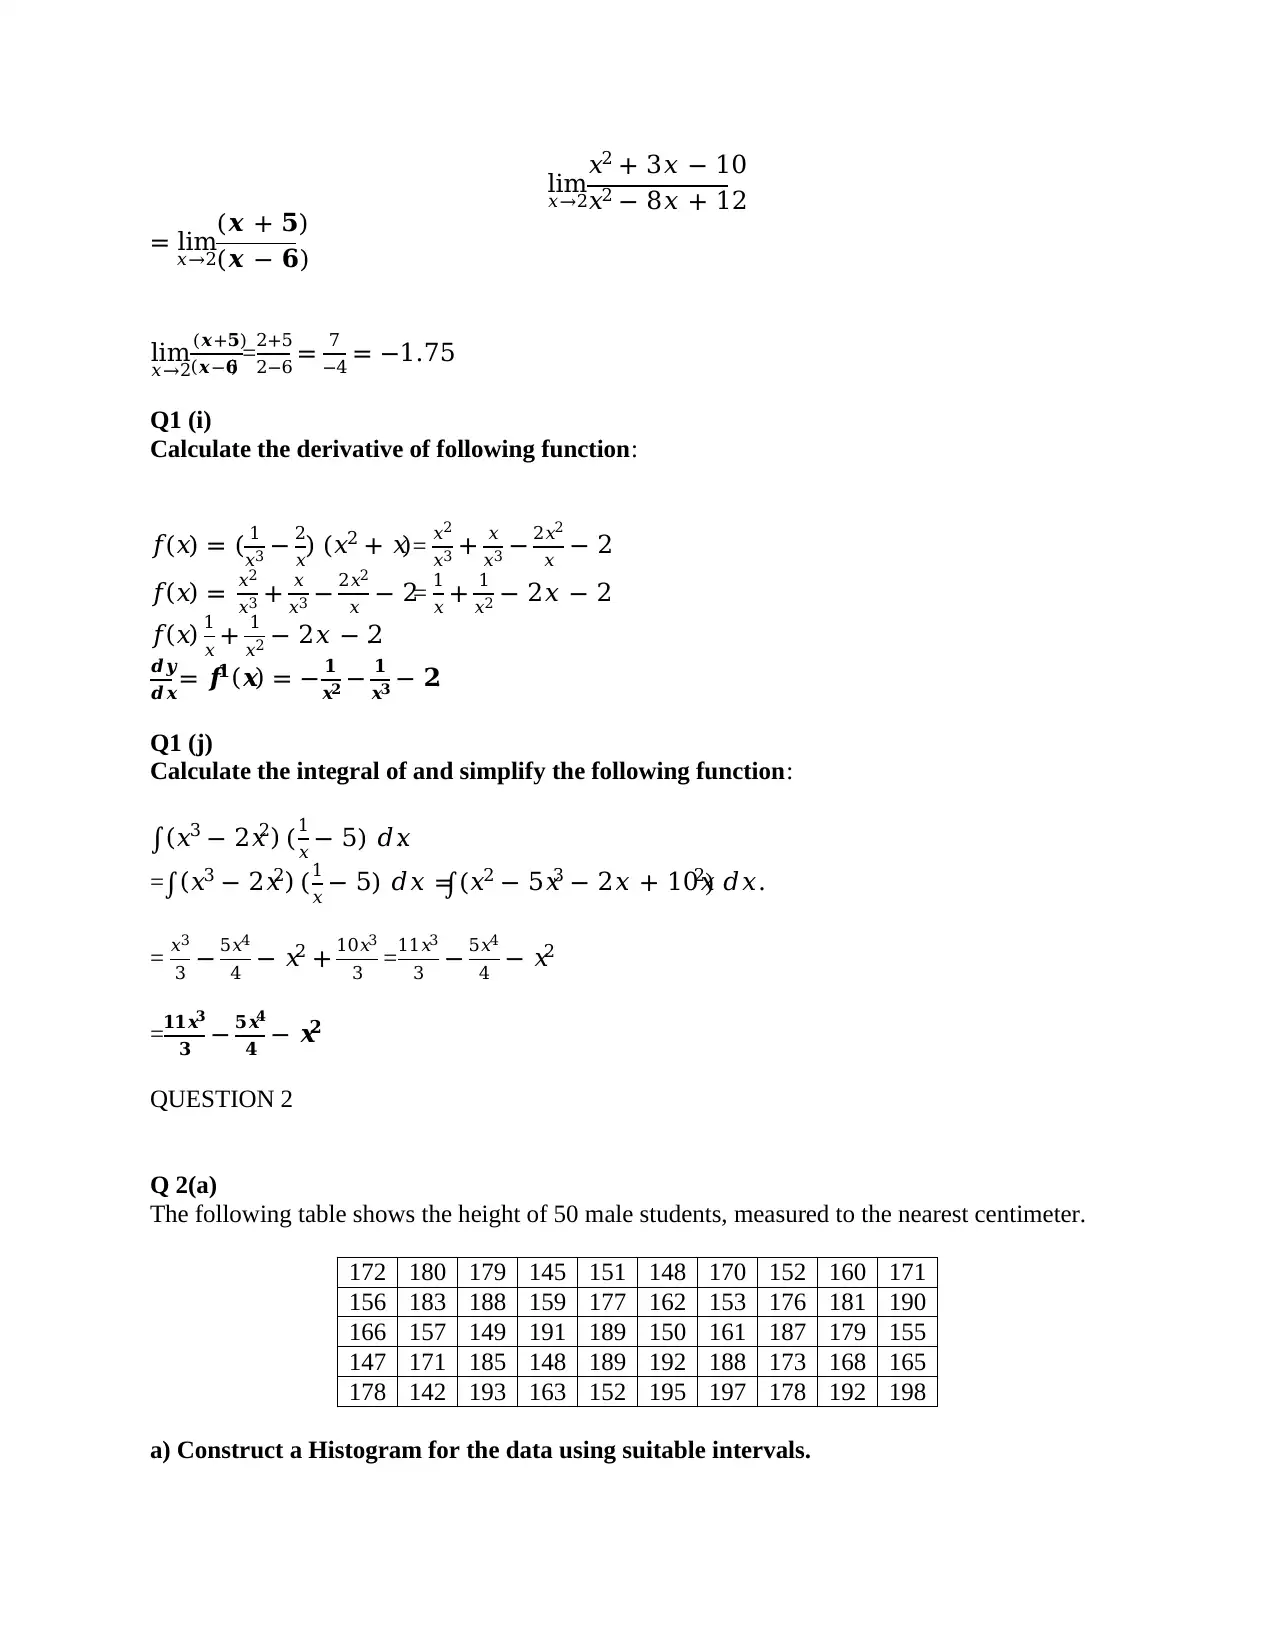
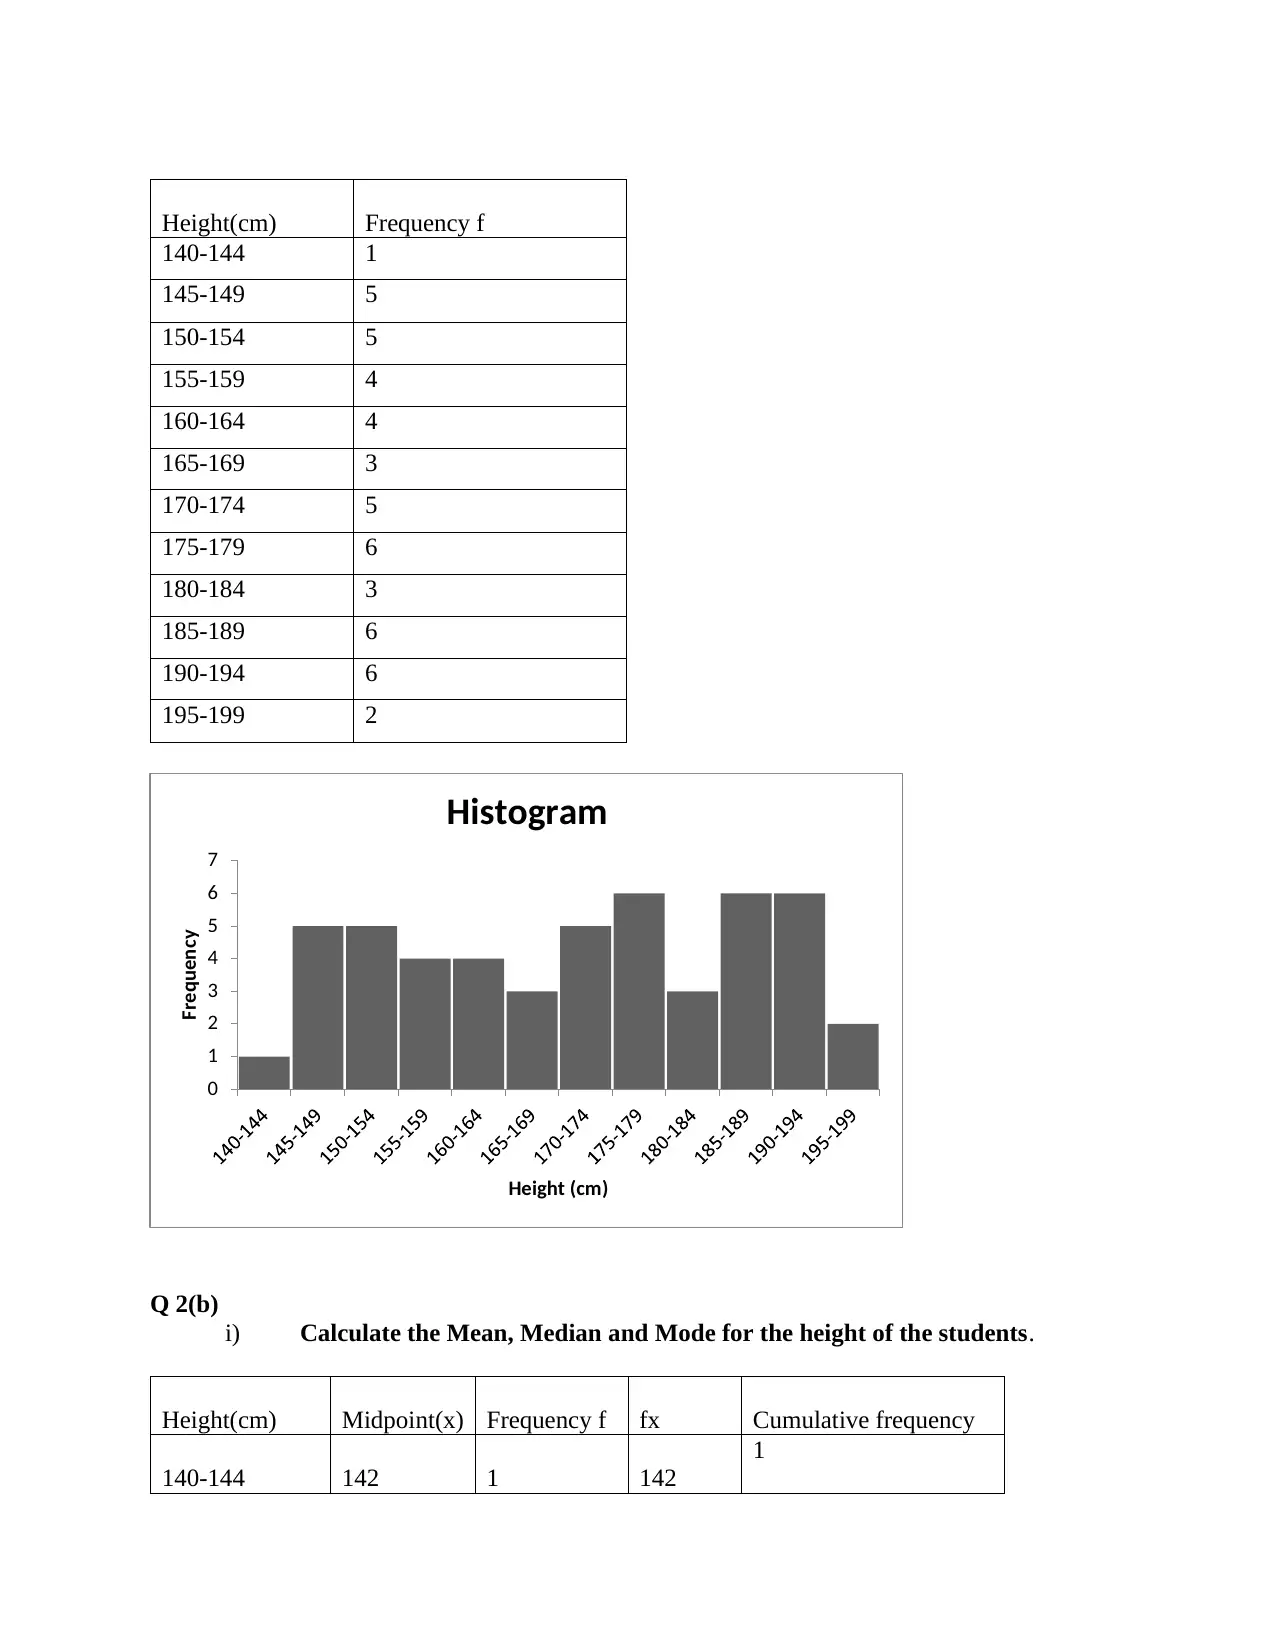
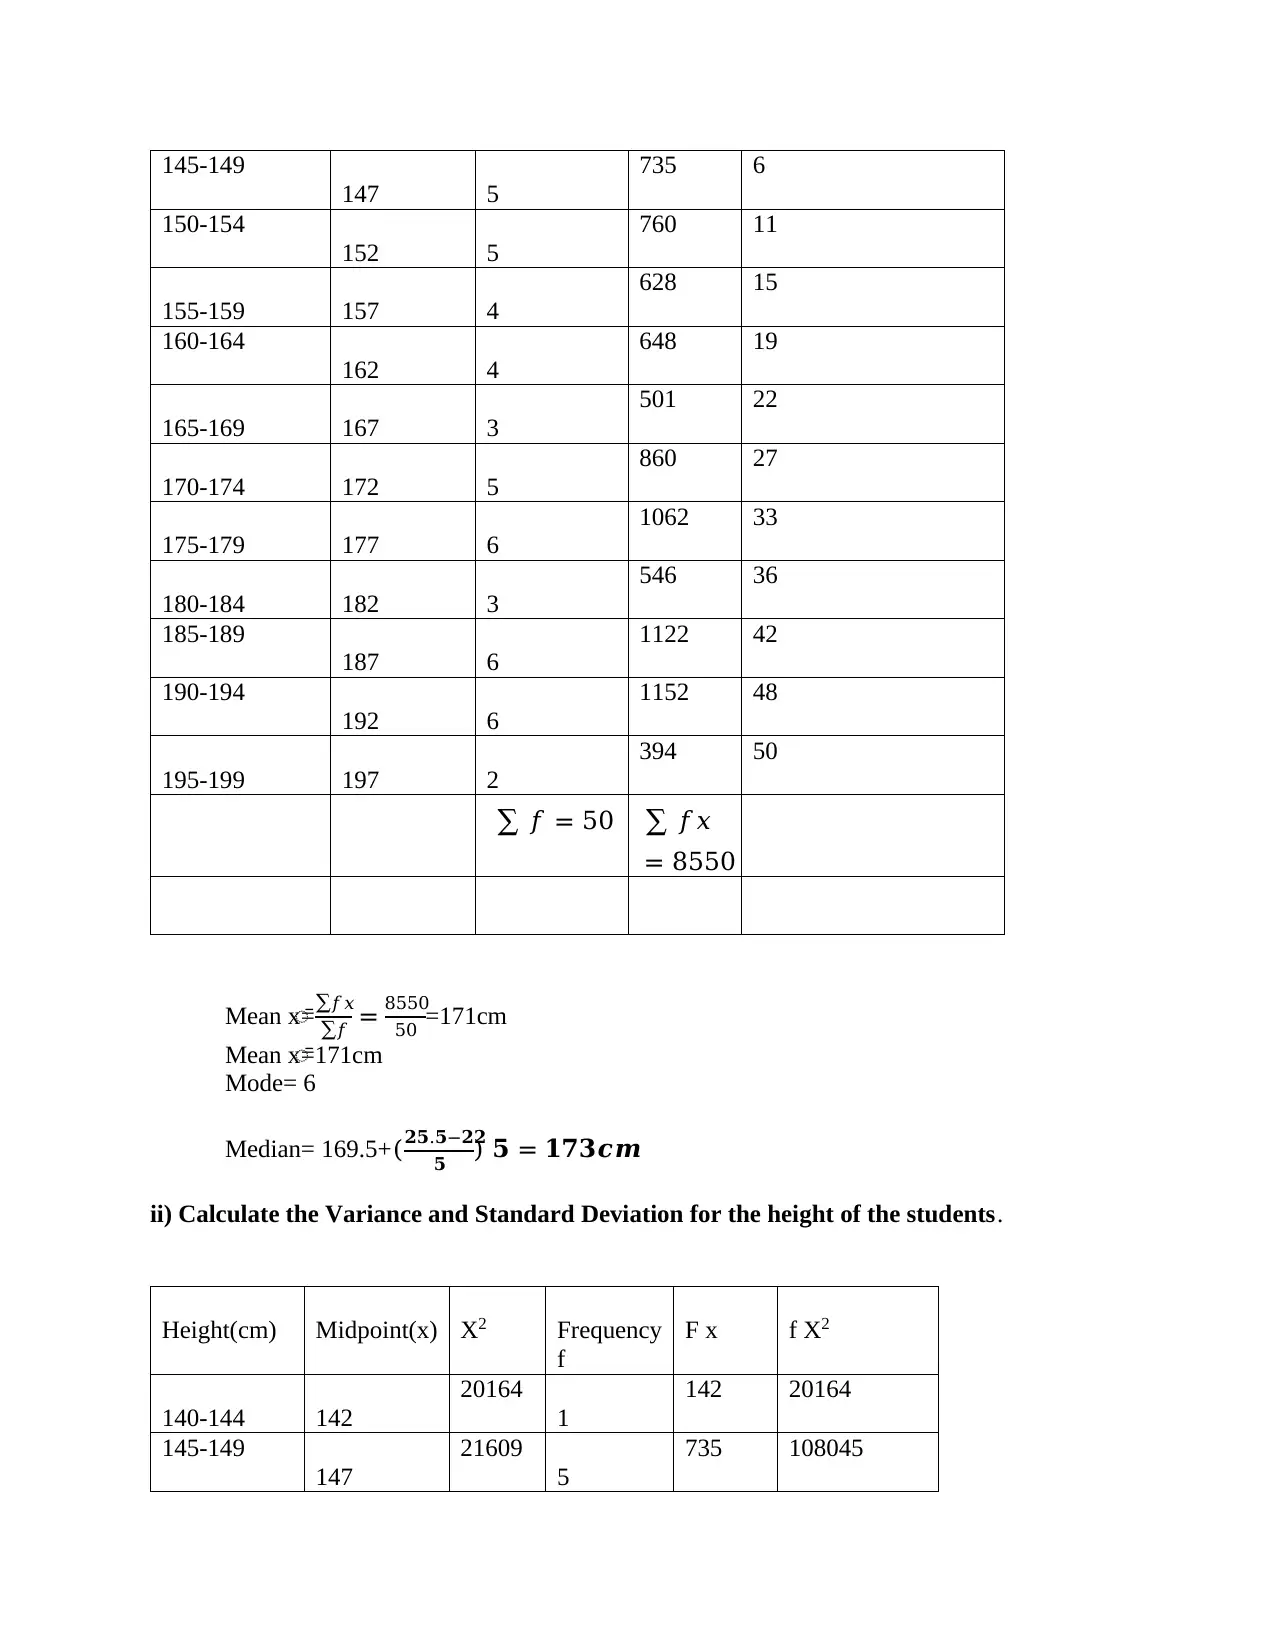
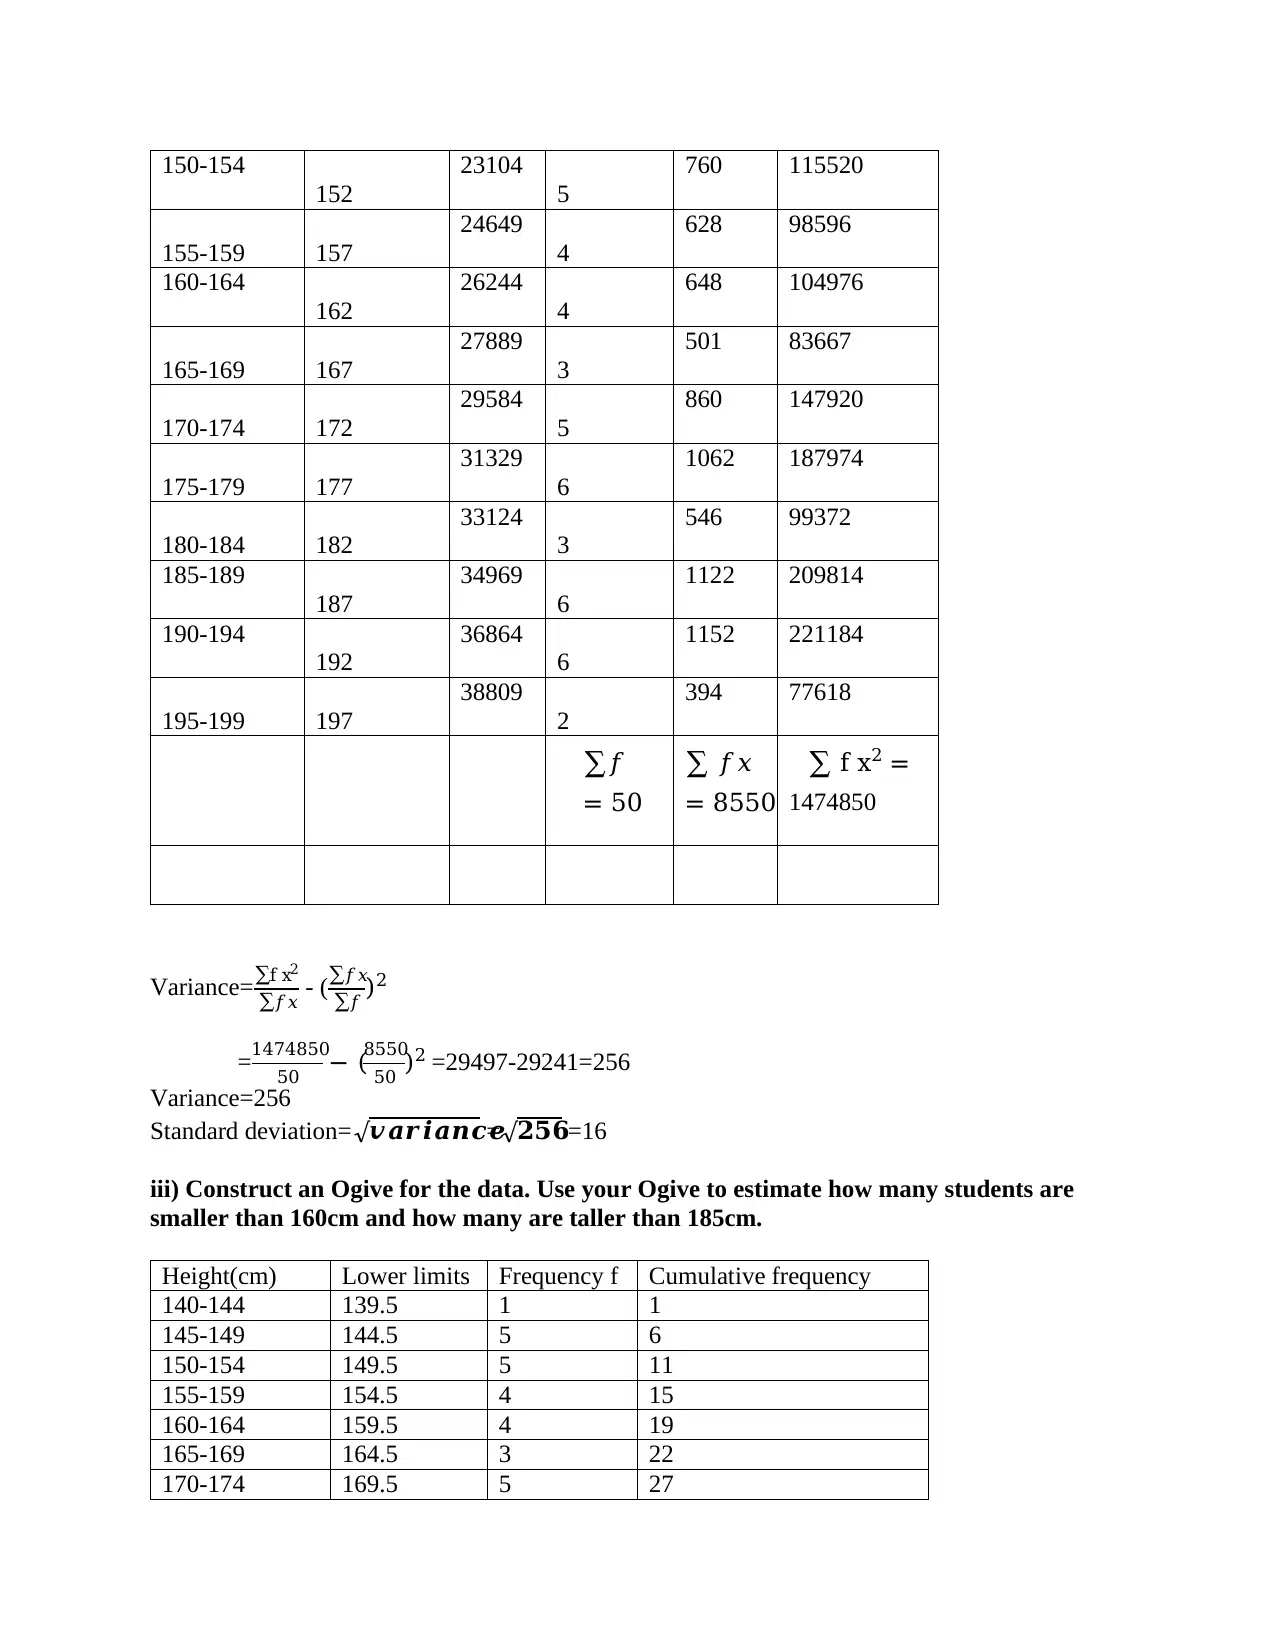
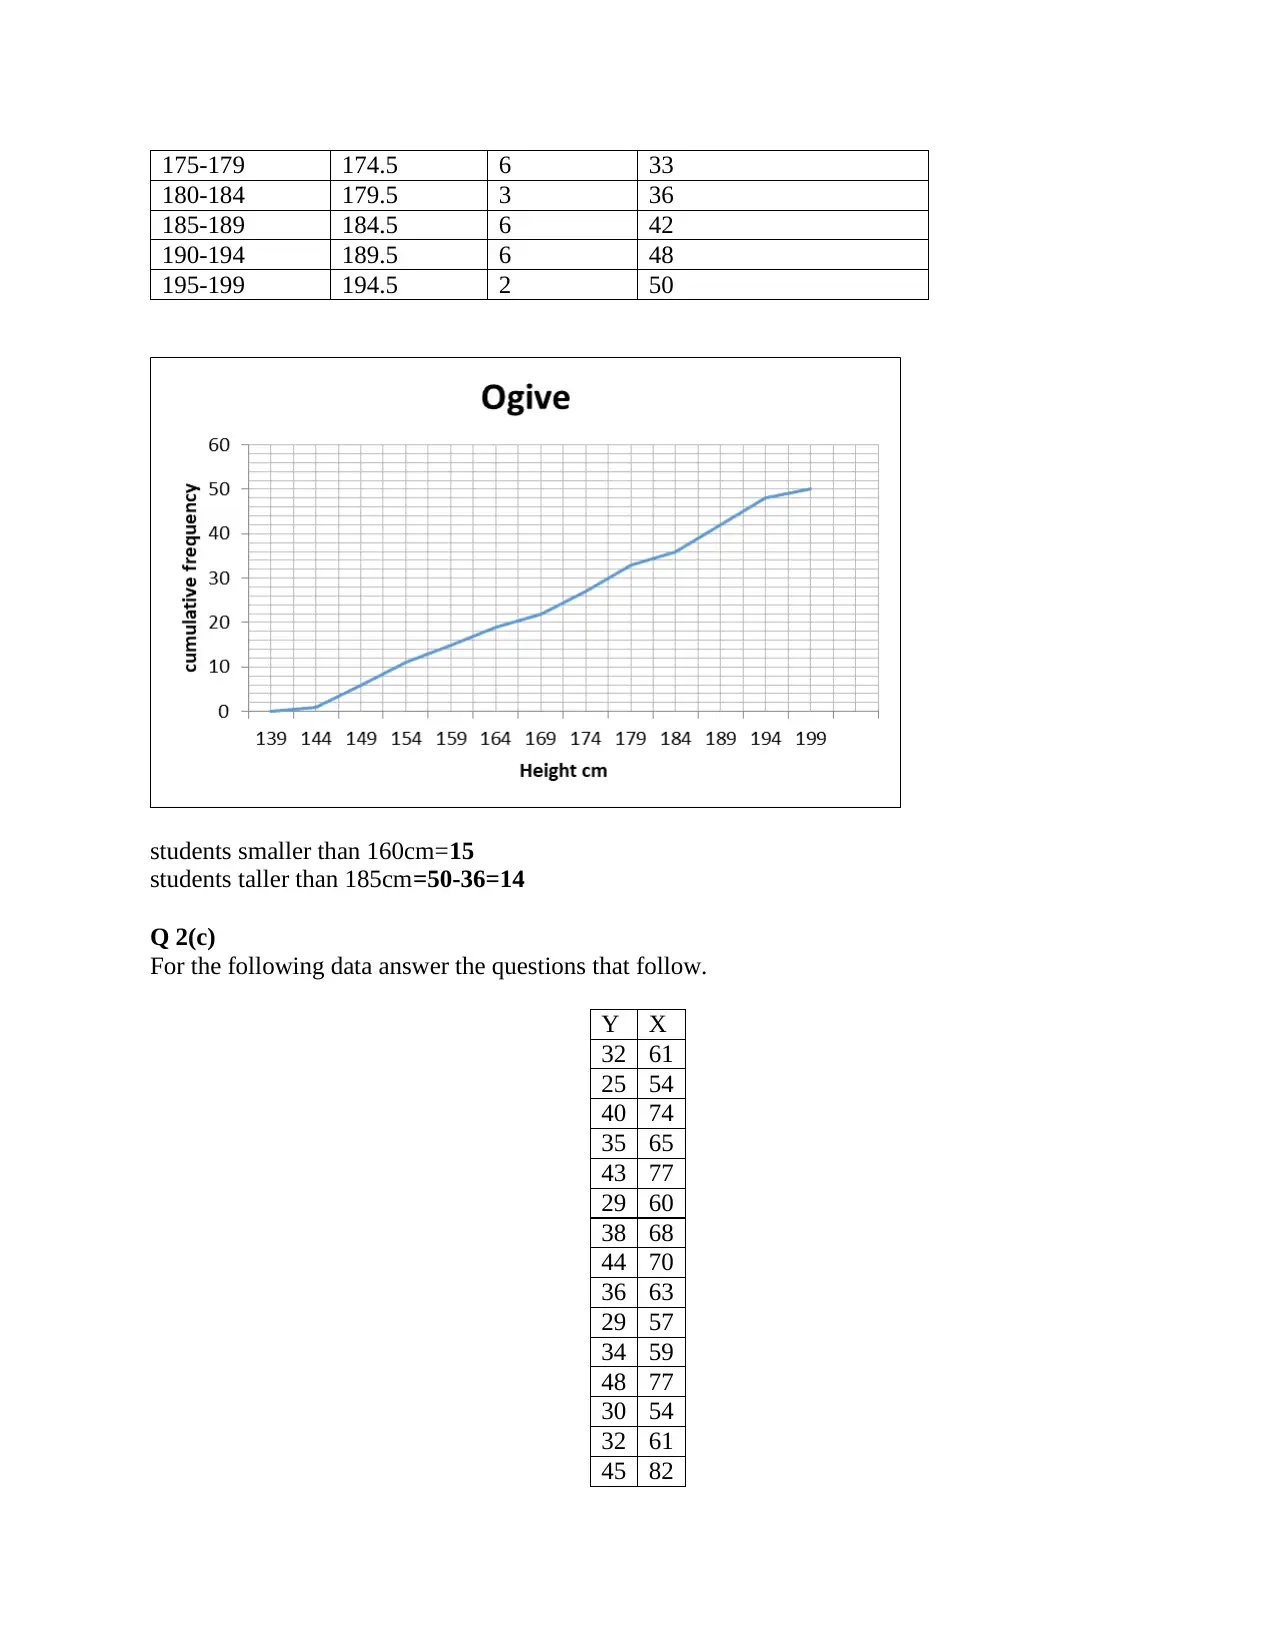
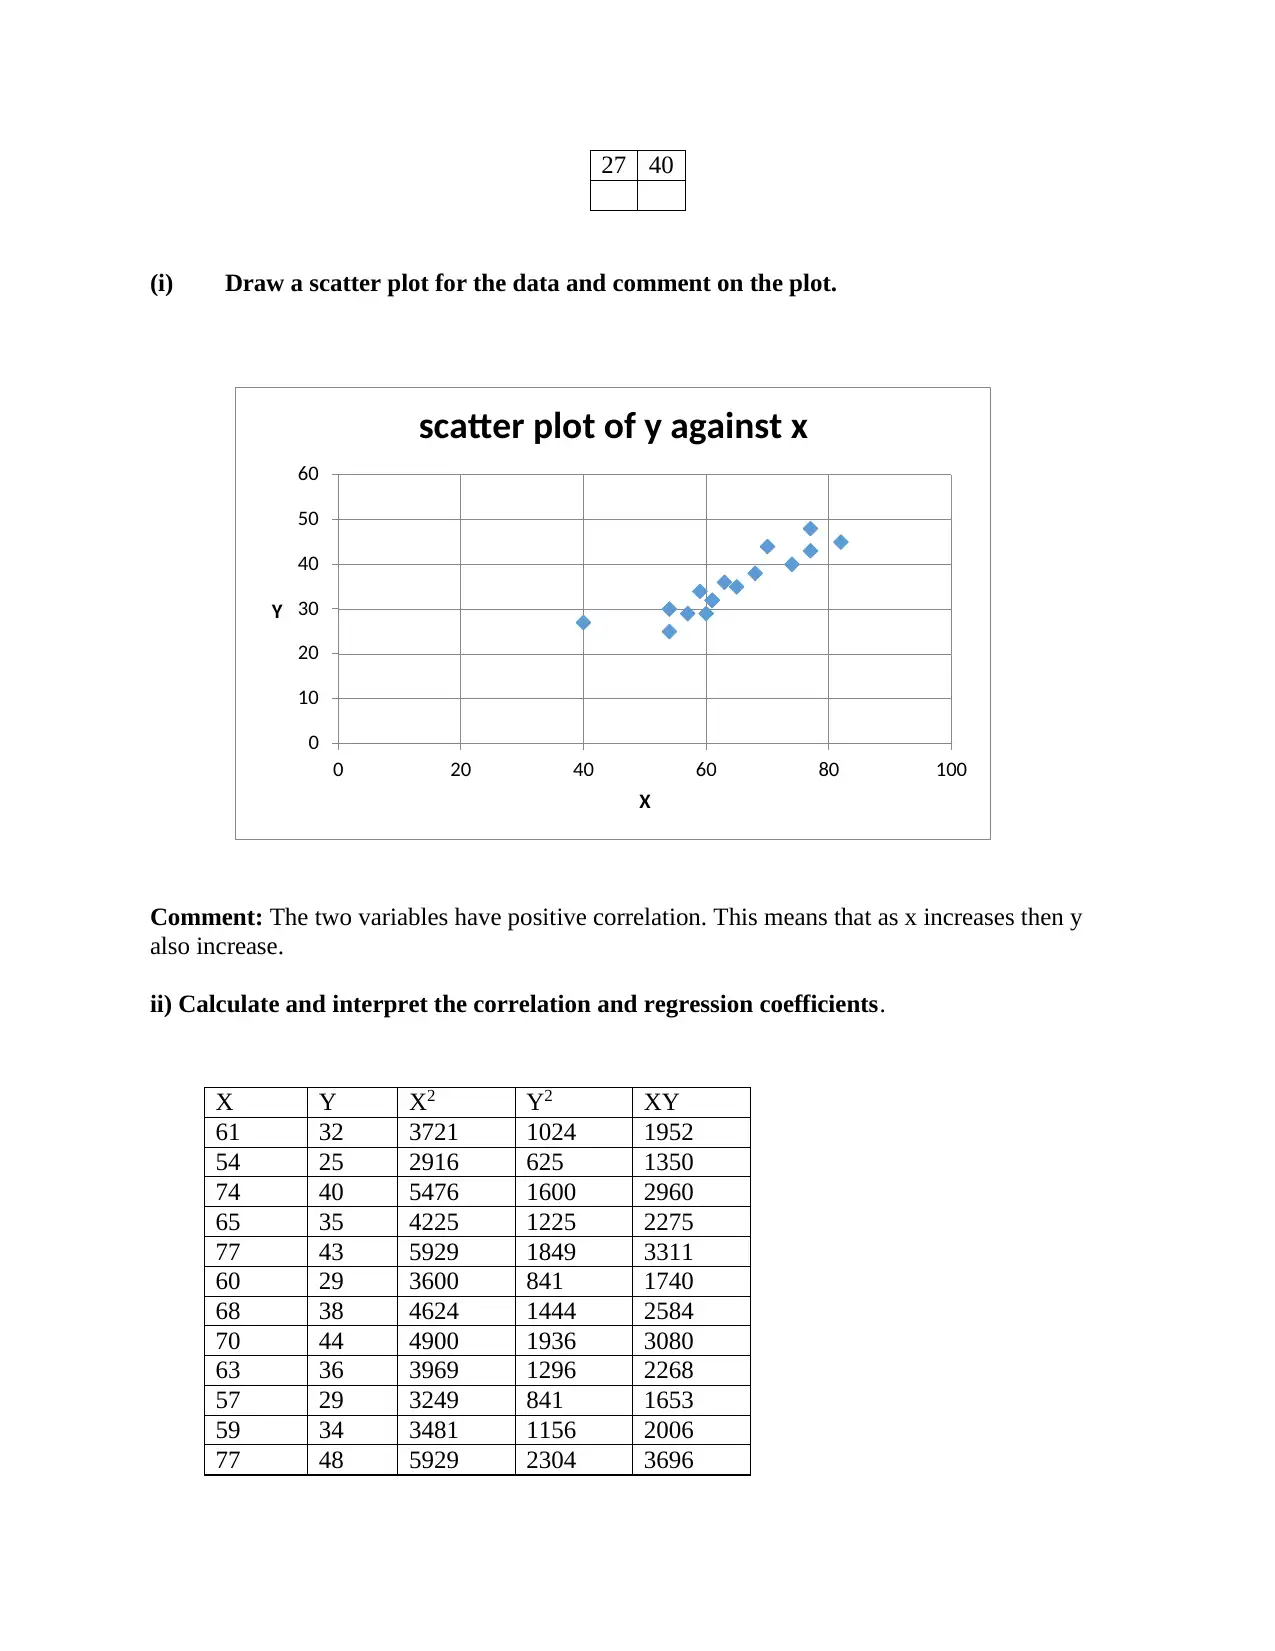
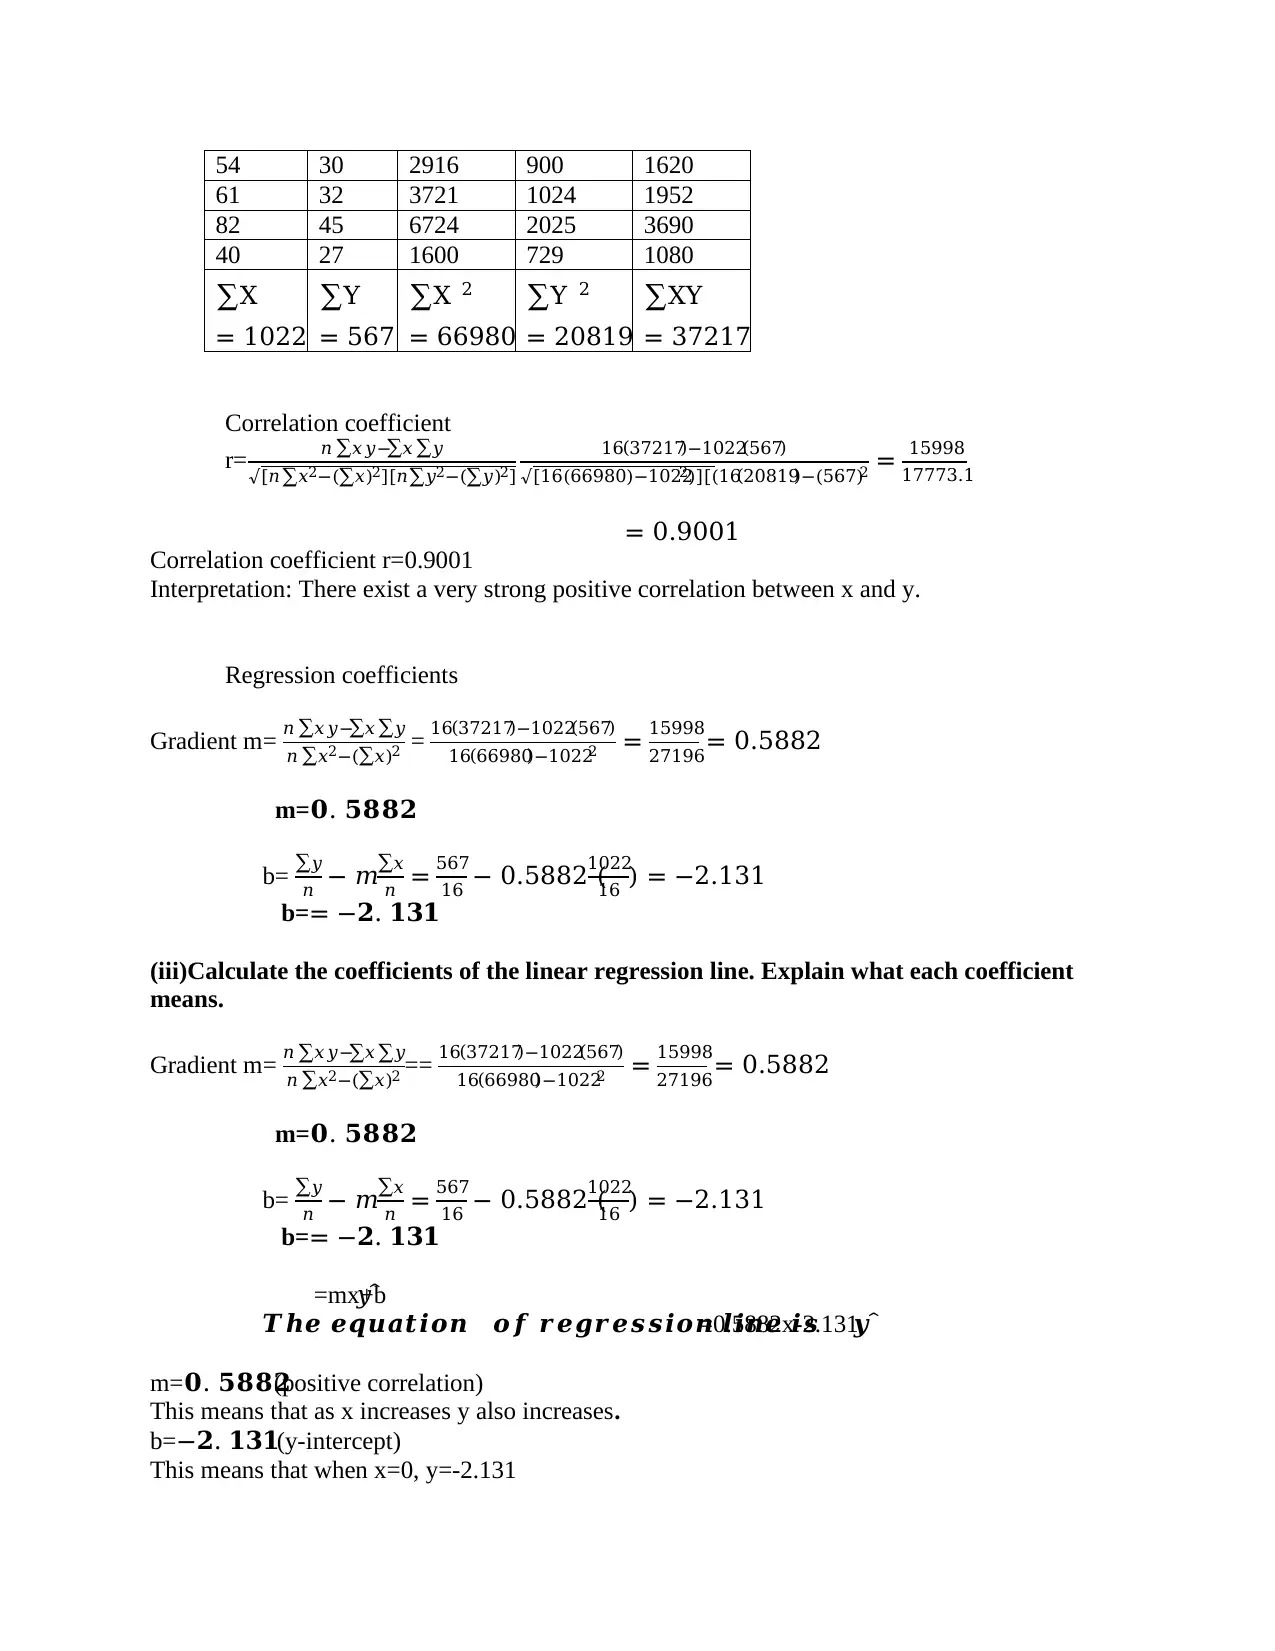
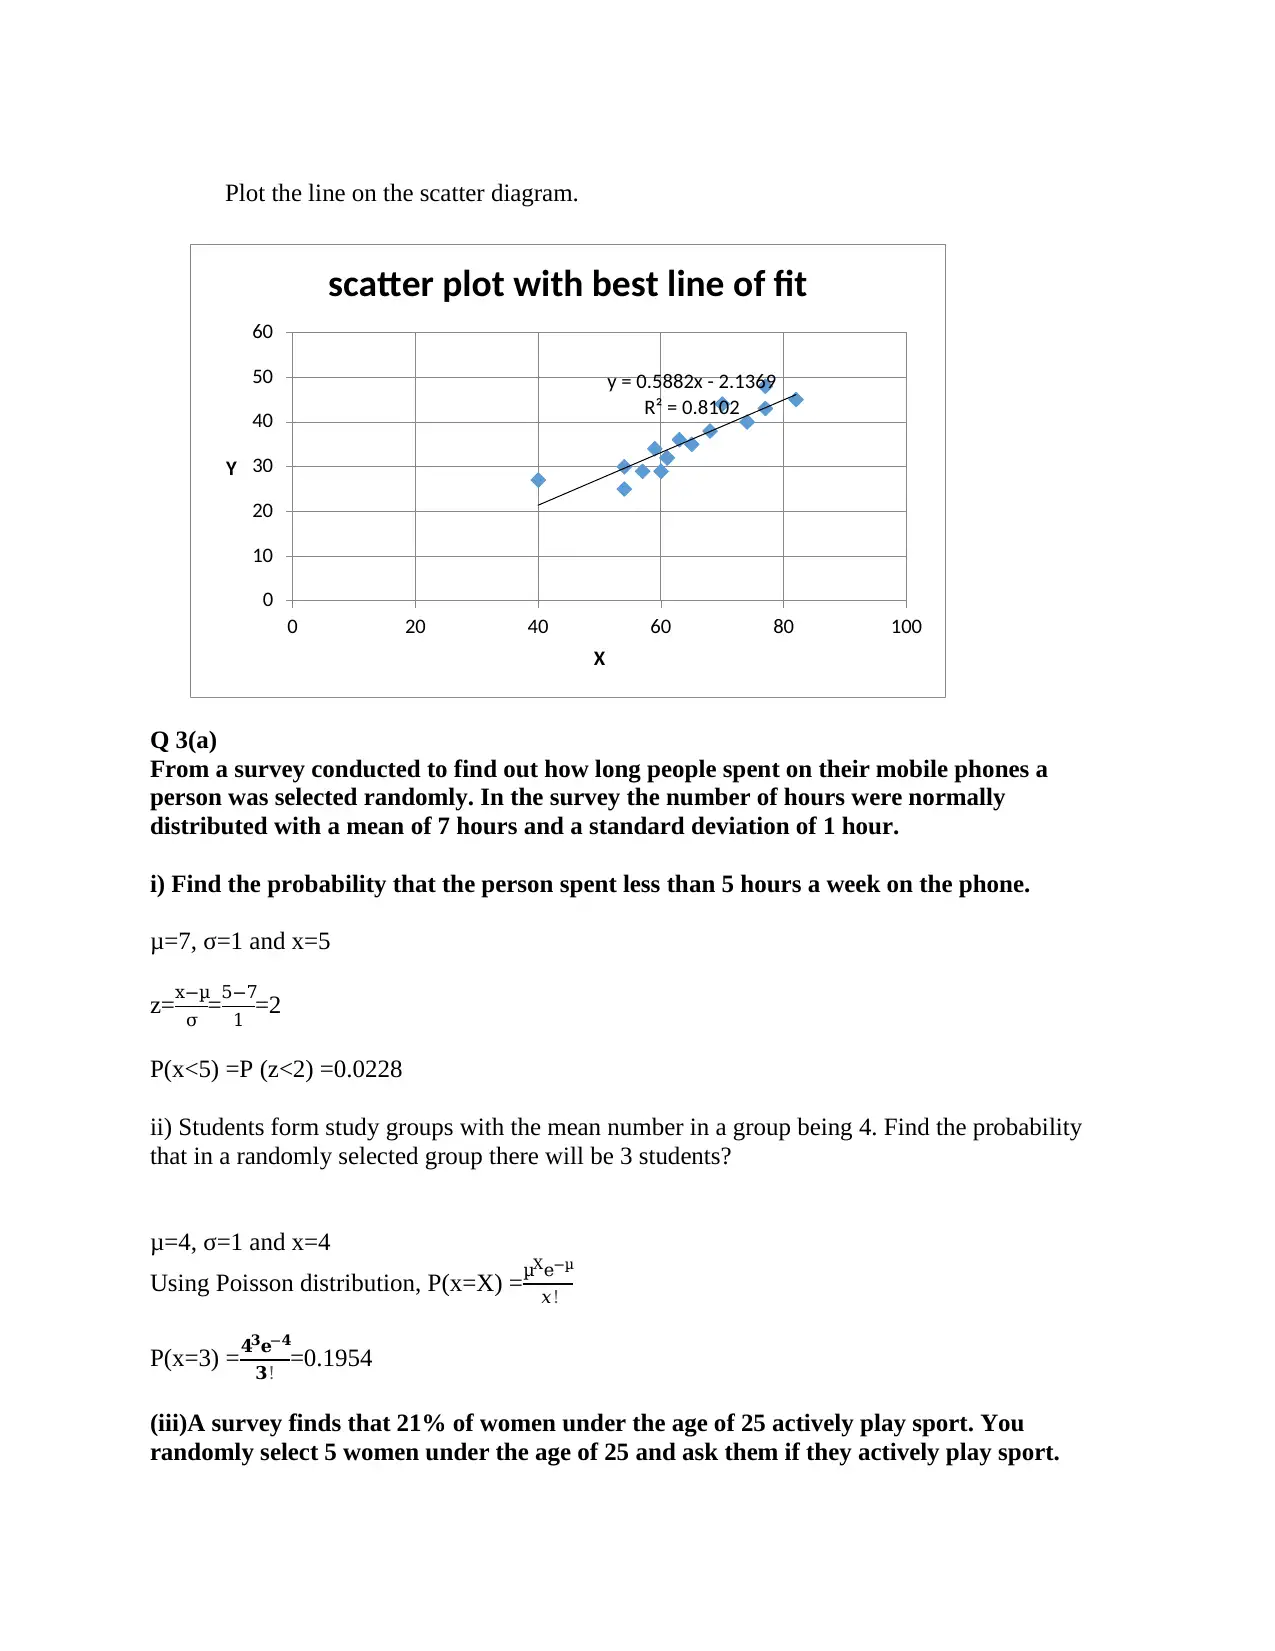
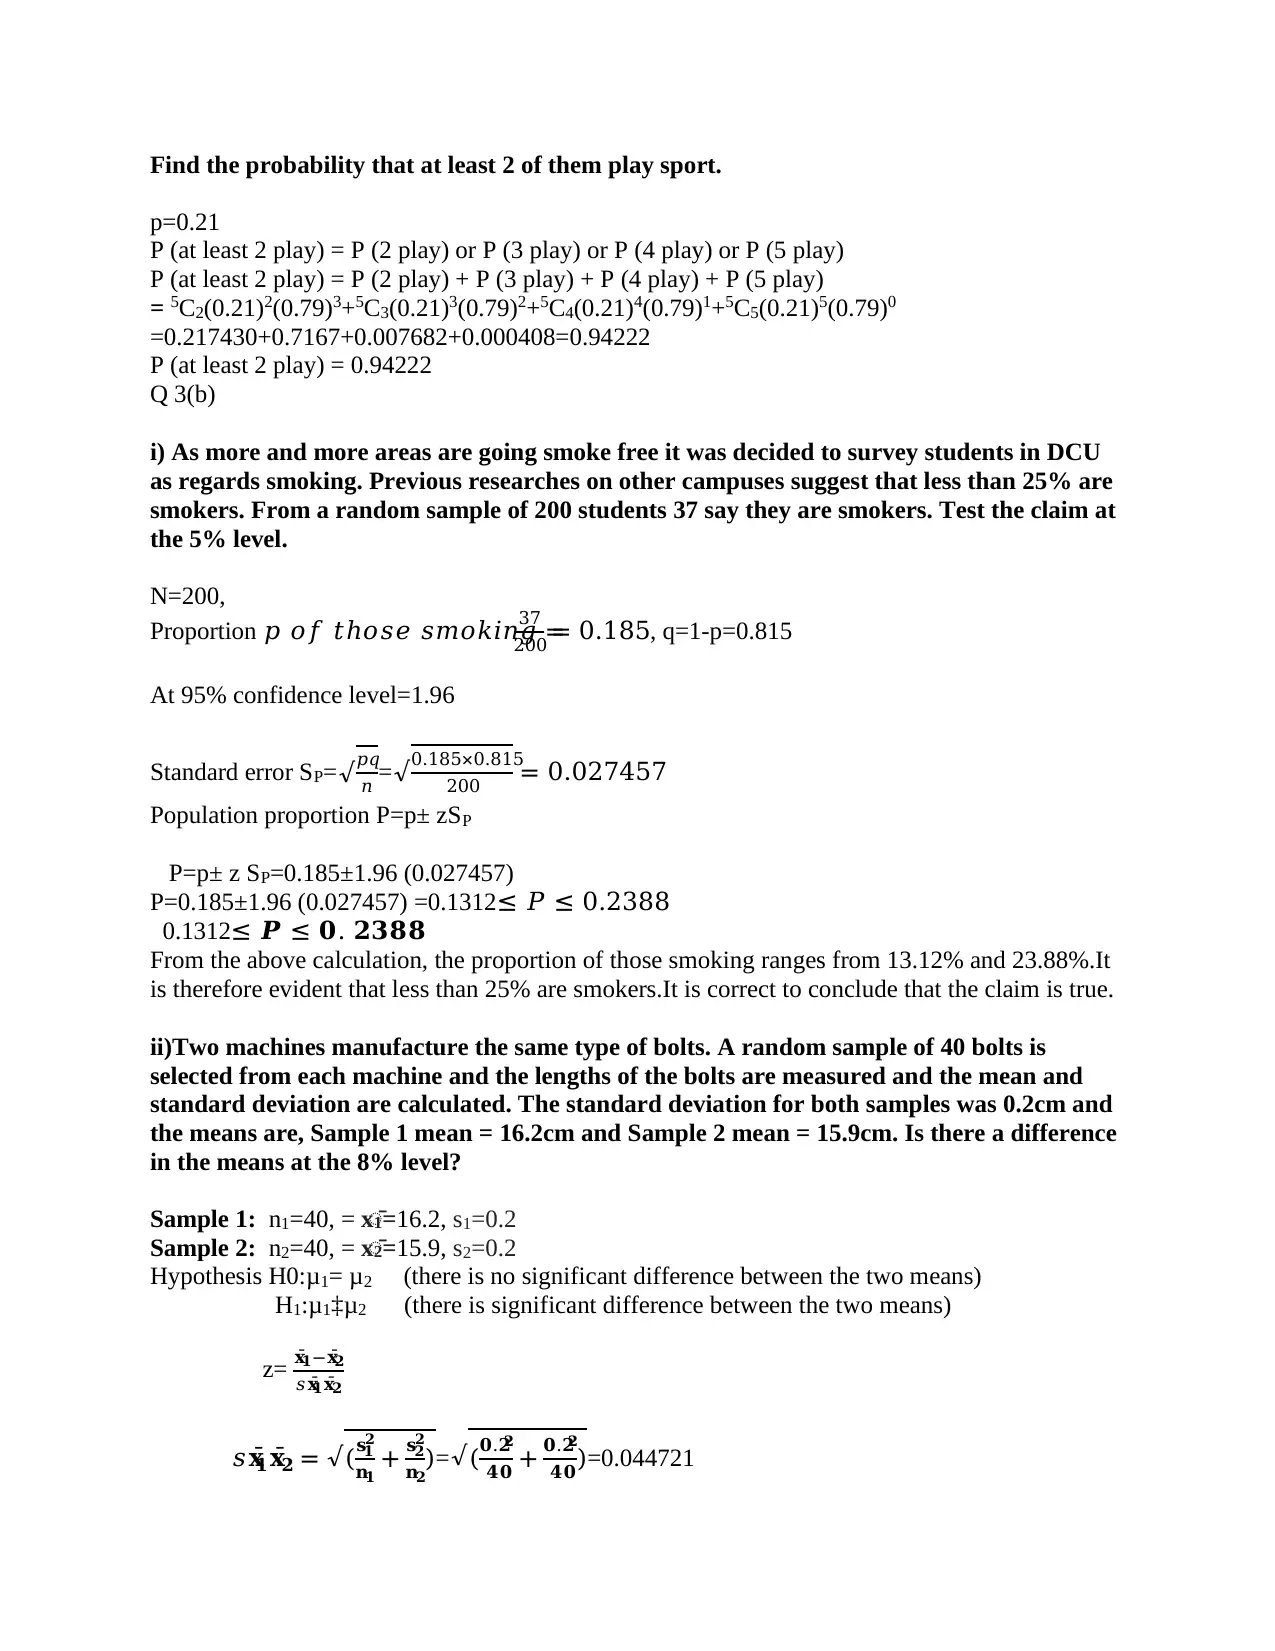
This mathematics and statistics assignment solution covers a range of topics including permutations and combinations, probability calculations involving ball selection, binomial expansion, and confidence intervals. It delves into hypothesis testing, explaining Type 1 and Type 2 errors, and includes matrix determinant evaluation. Furthermore, the assignment explores the difference between regression and correlation coefficients, calculates limits, derivatives, and integrals of functions. The second question focuses on statistical analysis of student heights, constructing histograms, calculating mean, median, mode, variance, and standard deviation, constructing an Ogive, and interpreting it. The assignment also encompasses scatter plots, correlation and regression coefficients calculations and interpretation, and Poisson distribution problems. Finally, it addresses hypothesis testing regarding smoking habits and compares means of bolt lengths, providing a comprehensive overview of statistical methods.

Mathematics Assignment
Student Name:
Instructor Name:
Course Number:
16th July 2019
Student Name:
Instructor Name:
Course Number:
16th July 2019
Paraphrase This Document
Need a fresh take? Get an instant paraphrase of this document with our AI Paraphraser

Question 1
Q1 (a)
In the 100m final of the Olympics there are 8 athletes taking part: In how many ways can they be
placed first, second and third?
First 8C1=8 ways
Second 8C2=28 ways
Third 8C3=56 ways
At the end of the race how many ways can the athletes line up for a photograph? 8C3= 56 ways
Q1 (b)
A person randomly selects 5 balls from a bag containing 3 Red, 5 Black and 6 Blue balls. Find
the probability that 2 Black and 3 Blue balls are chosen.
𝑷(𝟐𝒃𝒍𝒂𝒄𝒌 𝒂𝒏𝒅 𝟑 𝒃𝒍𝒖𝒆) = 5
14 × 5
14 × 6
14 × 6
14 × 6
14 = 5400
537824
Q1 (c)
Expand the first four terms of (𝟏 −𝒙
𝟐)−𝟓
𝟐
(1 −𝑥
2)−5
2= 1
(1−𝑥
2)
5
2
Expanding (1 −𝑥
2)2.5= (1)0(-𝑥
2)2.5+2.5(1)1(-𝑥
2)1.5+1.875(1)2(-𝑥
2)0.5+0.3125(1)3(-𝑥
2)-0.5
(1)0(-𝑥
2)2.5+2.5(1)1(-𝑥
2)1.5+1.875(1)2(-𝑥
2)0.5+0.3125(1)3(-𝑥
2)-0.5
= -0.1768𝑥5
2 + 0.8839𝑥
3
2 − 1.326𝑥
1
2 −0.4419𝑥−1
2
(𝟏 −𝒙
𝟐)−𝟓
𝟐 = −𝟎. 𝟏𝟕𝟔𝟖𝒙
−𝟓
𝟐 + 𝟎. 𝟖𝟖𝟑𝟗𝒙
−𝟑
𝟐 − 𝟏. 𝟑𝟐𝟔𝒙
−𝟏
𝟐 − 𝟎. 𝟒𝟒𝟏𝟗𝒙
𝟏
𝟐
Q1 (d)
For the following eight cars aged 2, 3, 4, 5, 6, 6, 7, and 7 find a 99% Confidence Interval.
Assume that the ages of the cars are normally distributed.
Mean x̄. =2+3+4+ 5+6+6+7 + 7
8 = 40
8 = 5
μ = x̄: ± t sx̄:
s=√𝒔𝒖𝒎 (𝒙−𝐱̄)2
𝒏−𝟏 =√(𝟐−𝟓)𝟐+(𝟑−𝟓)𝟐+(𝟒−𝟓)𝟐+(𝟓−𝟓)𝟐+(𝟔−𝟓)𝟐+(𝟔−𝟓)𝟐+(𝟕−𝟓)𝟐+(𝟕−𝟓)𝟐
𝟖−𝟏
=1.852
sx̄: = 𝒔
√𝒏 = 𝟏.𝟖𝟓𝟐
√𝟖 =0.6548

p(1-0.01
2 ) = 0.995,v-1=8-1=7
When p=0.995 and v=7, then t=3.499
μ = x̄: ± tsx̄: = 5 ± 3.499(0.6548)
𝟐. 𝟕𝟎𝟖 ≤ μ ≤ 𝟕. 𝟐𝟗𝟏
Q1 (e)
Explain what Type 1 and Type 2 errors are in Hypothesis Testing.
Type 1 errors-error that occurs when the null hypothesis is rejected instead of being accepted.
Type 2 errors-errors that occur when the null hypothesis is accepted instead of being rejected.
Q1 (f)
Evaluate the determinant of the following matrix:
⌈
6 3 2
4 1 −9
−5 6 −1
⌉
6 3 2 6 3
4 1 -9 4 1
-5 6 -1 -5 6
Determinant=[((6 × 1 × −1) + (3 × −9 × −5) +(2 × 4 × 1))] − [((−5 × 1 × 2) +
(6 × −9 × 6) +(−1 × 4 × 3))]
= (-6+135+8)-(-10-324-12) =137+346=483
Determinant=483
Q1 (g)
Explain the difference between the regression and correlation coefficients.
Regression coefficient is used to show the relationship between the independent and dependent
variable numerically while correlation coefficient is used to show the association strength that
exist between two Variables.
Q1 (h)
Calculate the limit of the following:
lim
𝑥→2
𝑥2 + 3𝑥 − 10
𝑥2 − 8𝑥 + 12
Let’s start by simplifying the expression through factorisation.
x2+3x-10= X2+5x-2x-10
x2 +5x-2x-10=x(x+5)-2(x+5) = (x-2)(x+5)
x2-8x+12= x2-6x-2x+12=x(x-6)-2(x-6)=(x-2)(x-6)
𝐱𝟐+𝟑𝐱−𝟏𝟎
𝐱𝟐−𝟖𝐱+𝟏𝟐
= (𝐱−𝟐)(𝐱+𝟓)
(𝐱−𝟐)(𝐱−𝟔)
=(𝒙+𝟓)
(𝒙−𝟔)
You're viewing a preview
Unlock full access by subscribing today!

lim
𝑥→2
𝑥2 + 3𝑥 − 10
𝑥2 − 8𝑥 + 12
= lim
𝑥→2
(𝒙 + 𝟓)
(𝒙 − 𝟔)
lim
𝑥→2
(𝒙+𝟓)
(𝒙−𝟔) =2+5
2−6 = 7
−4 = −1.75
Q1 (i)
Calculate the derivative of following function:
𝑓(𝑥) = ( 1
𝑥3 − 2
𝑥) (𝑥2 + 𝑥)= 𝑥2
𝑥3 + 𝑥
𝑥3 − 2𝑥2
𝑥 − 2
𝑓(𝑥) = 𝑥2
𝑥3 + 𝑥
𝑥3 − 2𝑥2
𝑥 − 2= 1
𝑥 + 1
𝑥2 − 2𝑥 − 2
𝑓(𝑥) 1
𝑥 + 1
𝑥2 − 2𝑥 − 2.
𝒅𝒚
𝒅𝒙= 𝒇𝟏(𝒙) = − 𝟏
𝒙𝟐 − 𝟏
𝒙𝟑 − 𝟐.
Q1 (j)
Calculate the integral of and simplify the following function:
∫(𝑥3 − 2𝑥2) (1
𝑥 − 5) 𝑑𝑥.
=∫(𝑥3 − 2𝑥2) (1
𝑥 − 5) 𝑑𝑥 =∫(𝑥2 − 5𝑥3 − 2𝑥 + 10𝑥2) 𝑑𝑥.
= 𝑥3
3 − 5𝑥4
4 − 𝑥2 + 10𝑥3
3 =11𝑥3
3 − 5𝑥4
4 − 𝑥2
=𝟏𝟏𝒙𝟑
𝟑 − 𝟓𝒙𝟒
𝟒 − 𝒙𝟐
QUESTION 2
Q 2(a)
The following table shows the height of 50 male students, measured to the nearest centimeter.
172 180 179 145 151 148 170 152 160 171
156 183 188 159 177 162 153 176 181 190
166 157 149 191 189 150 161 187 179 155
147 171 185 148 189 192 188 173 168 165
178 142 193 163 152 195 197 178 192 198
a) Construct a Histogram for the data using suitable intervals.
𝑥→2
𝑥2 + 3𝑥 − 10
𝑥2 − 8𝑥 + 12
= lim
𝑥→2
(𝒙 + 𝟓)
(𝒙 − 𝟔)
lim
𝑥→2
(𝒙+𝟓)
(𝒙−𝟔) =2+5
2−6 = 7
−4 = −1.75
Q1 (i)
Calculate the derivative of following function:
𝑓(𝑥) = ( 1
𝑥3 − 2
𝑥) (𝑥2 + 𝑥)= 𝑥2
𝑥3 + 𝑥
𝑥3 − 2𝑥2
𝑥 − 2
𝑓(𝑥) = 𝑥2
𝑥3 + 𝑥
𝑥3 − 2𝑥2
𝑥 − 2= 1
𝑥 + 1
𝑥2 − 2𝑥 − 2
𝑓(𝑥) 1
𝑥 + 1
𝑥2 − 2𝑥 − 2.
𝒅𝒚
𝒅𝒙= 𝒇𝟏(𝒙) = − 𝟏
𝒙𝟐 − 𝟏
𝒙𝟑 − 𝟐.
Q1 (j)
Calculate the integral of and simplify the following function:
∫(𝑥3 − 2𝑥2) (1
𝑥 − 5) 𝑑𝑥.
=∫(𝑥3 − 2𝑥2) (1
𝑥 − 5) 𝑑𝑥 =∫(𝑥2 − 5𝑥3 − 2𝑥 + 10𝑥2) 𝑑𝑥.
= 𝑥3
3 − 5𝑥4
4 − 𝑥2 + 10𝑥3
3 =11𝑥3
3 − 5𝑥4
4 − 𝑥2
=𝟏𝟏𝒙𝟑
𝟑 − 𝟓𝒙𝟒
𝟒 − 𝒙𝟐
QUESTION 2
Q 2(a)
The following table shows the height of 50 male students, measured to the nearest centimeter.
172 180 179 145 151 148 170 152 160 171
156 183 188 159 177 162 153 176 181 190
166 157 149 191 189 150 161 187 179 155
147 171 185 148 189 192 188 173 168 165
178 142 193 163 152 195 197 178 192 198
a) Construct a Histogram for the data using suitable intervals.
Paraphrase This Document
Need a fresh take? Get an instant paraphrase of this document with our AI Paraphraser

Height(cm) Frequency f
140-144 1
145-149 5
150-154 5
155-159 4
160-164 4
165-169 3
170-174 5
175-179 6
180-184 3
185-189 6
190-194 6
195-199 2
Q 2(b)
i) Calculate the Mean, Median and Mode for the height of the students.
Height(cm) Midpoint(x) Frequency f fx Cumulative frequency
140-144 142 1 142
1
0
1
2
3
4
5
6
7
Frequency
Height (cm)
Histogram

Mean x̄: =∑𝑓𝑥
∑𝑓 = 8550
50 =171cm
Mean x̄: =171cm
Mode= 6
Median= 169.5+(𝟐𝟓.𝟓−𝟐𝟐
𝟓 ) 𝟓 = 𝟏𝟕𝟑𝒄𝒎
ii) Calculate the Variance and Standard Deviation for the height of the students.
Height(cm) Midpoint(x) X2 Frequency
f
F x f X2
140-144 142
20164
1
142 20164
145-149
147
21609
5
735 108045
145-149
147 5
735 6
150-154
152 5
760 11
155-159 157 4
628 15
160-164
162 4
648 19
165-169 167 3
501 22
170-174 172 5
860 27
175-179 177 6
1062 33
180-184 182 3
546 36
185-189
187 6
1122 42
190-194
192 6
1152 48
195-199 197 2
394 50
∑ 𝑓 = 50 ∑ 𝑓𝑥
= 8550
You're viewing a preview
Unlock full access by subscribing today!

150-154
152
23104
5
760 115520
155-159 157
24649
4
628 98596
160-164
162
26244
4
648 104976
165-169 167
27889
3
501 83667
170-174 172
29584
5
860 147920
175-179 177
31329
6
1062 187974
180-184 182
33124
3
546 99372
185-189
187
34969
6
1122 209814
190-194
192
36864
6
1152 221184
195-199 197
38809
2
394 77618
∑𝑓
= 50
∑ 𝑓𝑥
= 8550
∑ f x2 =
1474850
Variance=∑f x2
∑𝑓𝑥 - (∑𝑓𝑥
∑𝑓 )2
=1474850
50 − (8550
50 )2 =29497-29241=256
Variance=256
Standard deviation=√𝒗𝒂𝒓𝒊𝒂𝒏𝒄𝒆=√𝟐𝟓𝟔=16
iii) Construct an Ogive for the data. Use your Ogive to estimate how many students are
smaller than 160cm and how many are taller than 185cm.
Height(cm) Lower limits Frequency f Cumulative frequency
140-144 139.5 1 1
145-149 144.5 5 6
150-154 149.5 5 11
155-159 154.5 4 15
160-164 159.5 4 19
165-169 164.5 3 22
170-174 169.5 5 27
Paraphrase This Document
Need a fresh take? Get an instant paraphrase of this document with our AI Paraphraser

175-179 174.5 6 33
180-184 179.5 3 36
185-189 184.5 6 42
190-194 189.5 6 48
195-199 194.5 2 50
students smaller than 160cm=15
students taller than 185cm=50-36=14
Q 2(c)
For the following data answer the questions that follow.
Y X
32 61
25 54
40 74
35 65
43 77
29 60
38 68
44 70
36 63
29 57
34 59
48 77
30 54
32 61
45 82

27 40
(i) Draw a scatter plot for the data and comment on the plot.
Comment: The two variables have positive correlation. This means that as x increases then y
also increase.
ii) Calculate and interpret the correlation and regression coefficients.
X Y X2 Y2 XY
61 32 3721 1024 1952
54 25 2916 625 1350
74 40 5476 1600 2960
65 35 4225 1225 2275
77 43 5929 1849 3311
60 29 3600 841 1740
68 38 4624 1444 2584
70 44 4900 1936 3080
63 36 3969 1296 2268
57 29 3249 841 1653
59 34 3481 1156 2006
77 48 5929 2304 3696
0
10
20
30
40
50
60
0 20 40 60 80 100
Y
X
scatter plot of y against x
You're viewing a preview
Unlock full access by subscribing today!

Correlation coefficient
r= 𝑛 ∑𝑥𝑦−∑𝑥∑𝑦
√[𝑛∑𝑥2−(∑𝑥)2][𝑛∑𝑦2−(∑𝑦)2]
16(37217)−1022(567)
√[16(66980)−10222)][(16(20819)−(567)2 = 15998
17773.1
= 0.9001
Correlation coefficient r=0.9001
Interpretation: There exist a very strong positive correlation between x and y.
Regression coefficients
Gradient m= 𝑛 ∑𝑥𝑦−∑𝑥∑𝑦
𝑛 ∑𝑥2−(∑𝑥)2 = 16(37217)−1022(567)
16(66980)−10222 = 15998
27196= 0.5882
m=𝟎. 𝟓𝟖𝟖𝟐
b= ∑𝑦
𝑛 − 𝑚∑𝑥
𝑛 = 567
16 − 0.5882 (
1022
16 ) = −2.131
b== −𝟐. 𝟏𝟑𝟏
(iii)Calculate the coefficients of the linear regression line. Explain what each coefficient
means.
Gradient m= 𝑛 ∑𝑥𝑦−∑𝑥∑𝑦
𝑛 ∑𝑥2−(∑𝑥)2 == 16(37217)−1022(567)
16(66980)−10222 = 15998
27196= 0.5882
m=𝟎. 𝟓𝟖𝟖𝟐
b= ∑𝑦
𝑛 − 𝑚∑𝑥
𝑛 = 567
16 − 0.5882 (
1022
16 ) = −2.131
b== −𝟐. 𝟏𝟑𝟏
𝑦 ̂=mx+b
𝑻𝒉𝒆 𝒆𝒒𝒖𝒂𝒕𝒊𝒐𝒏 𝒐𝒇 𝒓𝒆𝒈𝒓𝒆𝒔𝒔𝒊𝒐𝒏 𝒍𝒊𝒏𝒆 𝒊𝒔 𝒚 ̂=0.5882x-2.131
m=𝟎. 𝟓𝟖𝟖𝟐(positive correlation)
This means that as x increases y also increases.
b=−𝟐. 𝟏𝟑𝟏(y-intercept)
This means that when x=0, y=-2.131
54 30 2916 900 1620
61 32 3721 1024 1952
82 45 6724 2025 3690
40 27 1600 729 1080
∑X
= 1022
∑Y
= 567
∑X 2
= 66980
∑Y 2
= 20819
∑XY
= 37217
Paraphrase This Document
Need a fresh take? Get an instant paraphrase of this document with our AI Paraphraser

Plot the line on the scatter diagram.
Q 3(a)
From a survey conducted to find out how long people spent on their mobile phones a
person was selected randomly. In the survey the number of hours were normally
distributed with a mean of 7 hours and a standard deviation of 1 hour.
i) Find the probability that the person spent less than 5 hours a week on the phone.
μ=7, σ=1 and x=5
z=x−μ
σ =5−7
1 =2
P(x<5) =P (z<2) =0.0228
ii) Students form study groups with the mean number in a group being 4. Find the probability
that in a randomly selected group there will be 3 students?
μ=4, σ=1 and x=4
Using Poisson distribution, P(x=X) =μXe−μ
𝑥!
P(x=3) =𝟒𝟑𝐞−𝟒
𝟑! =0.1954
(iii)A survey finds that 21% of women under the age of 25 actively play sport. You
randomly select 5 women under the age of 25 and ask them if they actively play sport.
y = 0.5882x - 2.1369
R² = 0.8102
0
10
20
30
40
50
60
0 20 40 60 80 100
Y
X
scatter plot with best line of fit

Find the probability that at least 2 of them play sport.
p=0.21
P (at least 2 play) = P (2 play) or P (3 play) or P (4 play) or P (5 play)
P (at least 2 play) = P (2 play) + P (3 play) + P (4 play) + P (5 play)
= 5C2(0.21)2(0.79)3+5C3(0.21)3(0.79)2+5C4(0.21)4(0.79)1+5C5(0.21)5(0.79)0
=0.217430+0.7167+0.007682+0.000408=0.94222
P (at least 2 play) = 0.94222
Q 3(b)
i) As more and more areas are going smoke free it was decided to survey students in DCU
as regards smoking. Previous researches on other campuses suggest that less than 25% are
smokers. From a random sample of 200 students 37 say they are smokers. Test the claim at
the 5% level.
N=200,
Proportion 𝑝 𝑜𝑓 𝑡ℎ𝑜𝑠𝑒 𝑠𝑚𝑜𝑘𝑖𝑛𝑔 =
37
200 = 0.185, q=1-p=0.815
At 95% confidence level=1.96
Standard error SP=√𝑝𝑞
𝑛 =√0.185×0.815
200 = 0.027457
Population proportion P=p± zSP
P=p± z SP=0.185±1.96 (0.027457)
P=0.185±1.96 (0.027457) =0.1312≤ 𝑃 ≤ 0.2388
0.1312≤ 𝑷 ≤ 𝟎. 𝟐𝟑𝟖𝟖
From the above calculation, the proportion of those smoking ranges from 13.12% and 23.88%.It
is therefore evident that less than 25% are smokers.It is correct to conclude that the claim is true.
ii)Two machines manufacture the same type of bolts. A random sample of 40 bolts is
selected from each machine and the lengths of the bolts are measured and the mean and
standard deviation are calculated. The standard deviation for both samples was 0.2cm and
the means are, Sample 1 mean = 16.2cm and Sample 2 mean = 15.9cm. Is there a difference
in the means at the 8% level?
Sample 1: n1=40, = x̄. 1=16.2, s1=0.2
Sample 2: n2=40, = x̄. 2=15.9, s2=0.2
Hypothesis H0:μ1= μ2 (there is no significant difference between the two means)
H1:μ1‡μ2 (there is significant difference between the two means)
z= 𝐱̄𝟏−𝐱̄𝟐
𝑠𝐱̄𝟏𝐱̄𝟐
𝑠𝐱̄𝟏𝐱̄𝟐 = √(𝐬𝟏
𝟐
𝐧𝟏
+ 𝐬𝟐
𝟐
𝐧𝟐
)=√(𝟎.𝟐𝟐
𝟒𝟎 + 𝟎.𝟐𝟐
𝟒𝟎)=0.044721
You're viewing a preview
Unlock full access by subscribing today!

z= 𝐱̄𝟏−𝐱̄𝟐
𝑠𝐱̄𝟏𝐱̄𝟐
= 16.2−15.9
0.044721= 6.708
At 8% level, P (1 - 0.08
2 )=0.96
When p=0.96, z=1.76
The calculated z value (6.708)is more the z value (1.76) from the table. We therefore reject the
null hypothesis and accept the alternative hypothesis.
Conclusion: There is significant difference between the two means.
Q 4(a)
If A = [
3 2 −2
5 3 1
−3 8 1
] 𝑎𝑛𝑑 𝐵 = [
2 4 6
−3 9 7
2 −5 3
] Find A x B
A x B=[
3 2 −2
5 3 1
−3 8 1
] [
2 4 6
−3 9 7
2 −5 3
]=[
−4 40 26
1 42 54
−28 55 41
]
A x B=[
−𝟒 𝟒𝟎 𝟐𝟔
𝟏 𝟒𝟐 𝟓𝟒
−𝟐𝟖 𝟓𝟓 𝟒𝟏
]
(ii) Solve the following equations using Gaussian Elimination and verify your solution:
x + y + z = 1
2x + 2y + 2z = 1
3x + 3y = 2
[
1 1 1
2 2 2
3 3 0
] [
𝑥
𝑦
𝑧
]=
1
1
2
x=
[1 1 1
1 2 2
2 3 0
]
[1 1 1
2 2 2
33 0]
= 7−10
0 = 0
y=
[1 1 1
2 1 2
3 2 0
]
[1 1 1
2 2 2
33 0
]
= 10−7
0 = 0
z=
[1 1 1
2 1 1
3 2 2
]
[1 1 1
2 2 2
33 0]
= 13−13
0 = 0
Paraphrase This Document
Need a fresh take? Get an instant paraphrase of this document with our AI Paraphraser

Q 4(b)
(i) Differentiate the following function
𝑓(𝑥) = (𝑥−1)(𝑥+2)
(𝑥−3)(𝑥+1)
Let u=(𝑥 − 1)(𝑥 + 2) = 𝑥2 + 𝑥 − 2
V=(𝑥 − 3)(𝑥 + 1) = 𝑥2 − 2𝑥 − 3
𝑑𝑢
𝑑𝑥 = 2𝑥 + 1.
𝑑𝑣
𝑑𝑥 = 2𝑥 − 2.
𝑓1(𝑥) =
𝑑𝑢
𝑑𝑥 (𝑣)−𝑢
𝑑𝑣
𝑑𝑥
𝑣2 =(2𝑥+1)(𝑥2−2𝑥−3)−(𝑥2+𝑥−2)(2𝑥−2)
(𝑥2−2𝑥−3)2
𝑓1(𝑥)=(2𝑥+1)(𝑥2−2𝑥−3)−(𝑥2+𝑥−2)(2𝑥−2)
(𝑥2−2𝑥−3)2 =2𝑥3−4𝑥2−6𝑥+𝑥2−2𝑥−3−(2𝑥3+2𝑥2−4𝑥−2𝑥2−2𝑥+4)
(𝑥2−2𝑥−3)2
𝒇𝟏(𝒙) = −𝟑𝒙𝟐−𝟐𝒙−𝟕
(𝒙𝟐−𝟐𝒙−𝟑)𝟐
Find all the Stationary Points of the function y = x3 – 9x2 + 15x +10 and sketch the curve.
y = x3 – 9x2 + 15x +10
At stationary point,𝑑𝑦
𝑑𝑥 = 0
𝒅𝒚
𝒅𝒙= 𝟑x2 − 18x + 15
𝟑x2 − 18x + 15 = 0
(3X-15)(X-1)=0
3x=15, x=5 OR
X-1=0, x=1
When x=1, y= (1)3 – 9(1)2 + 15(1) +10=17
Stationary point (1, 17)
x 0 1 2
𝒅𝒚
𝒅𝒙
15 0 -9
sign +ve 0 -Ve
The stationary point (1, 17) is maximum.
When x=5, y= (5)3 – 9(5)2 + 15(5) +10=-15
Stationary point (5,-15)
x 4 5 6

𝒅𝒚
𝒅𝒙
-9 0 15
sign -ve 0 +Ve
The stationary point (5,-15) is minimum.
y
17
x
0 1 2 3 4 5
-15
Q 4(c)
Integrate the following functions:
(i)
∫ 𝑥2(𝑥2 + 3𝑥)𝑑𝑥
=∫ 𝑥4 + 3𝑥3𝑑𝑥=𝒙𝟓
𝟓 + 𝟑𝒙𝟒
𝟒 +C
(ii)
∫ 1
√2𝑥−1𝑑𝑥=∫(2𝑥 − 1)−0.5𝑑𝑥
= 𝟐(𝟐𝒙 − 𝟏)𝟎.𝟓= 𝟐(√𝟐𝒙 − 𝟏) + 𝒄
𝒅𝒙
-9 0 15
sign -ve 0 +Ve
The stationary point (5,-15) is minimum.
y
17
x
0 1 2 3 4 5
-15
Q 4(c)
Integrate the following functions:
(i)
∫ 𝑥2(𝑥2 + 3𝑥)𝑑𝑥
=∫ 𝑥4 + 3𝑥3𝑑𝑥=𝒙𝟓
𝟓 + 𝟑𝒙𝟒
𝟒 +C
(ii)
∫ 1
√2𝑥−1𝑑𝑥=∫(2𝑥 − 1)−0.5𝑑𝑥
= 𝟐(𝟐𝒙 − 𝟏)𝟎.𝟓= 𝟐(√𝟐𝒙 − 𝟏) + 𝒄
You're viewing a preview
Unlock full access by subscribing today!
1 out of 15
Related Documents

Your All-in-One AI-Powered Toolkit for Academic Success.
+13062052269
info@desklib.com
Available 24*7 on WhatsApp / Email
Unlock your academic potential
© 2024 | Zucol Services PVT LTD | All rights reserved.