MATI3006 Numeracy 1 Autumn 2017 Coursework/Portfolio Assignment Brief
VerifiedAdded on 2020/06/06
|23
|4645
|91
Homework Assignment
AI Summary
This coursework/portfolio assignment for MATI3006 Numeracy 1, completed in Autumn 2017, assesses students' ability to apply numerical skills and interpret statistical values within business and academic contexts. The assignment is divided into four sections. Sections 1, 2, and 3, each worth 33% of the final mark, focus on skills audits, in-class activities, and online quizzes covering topics such as order of operations, fractions, decimals, percentages, index numbers, and basic statistics. Section 4, worth 67%, consists of 10 questions that require students to apply these concepts to solve real-world problems, including calculations involving the FTSE index, wealth percentages, and energy consumption analysis using a pie chart. Students are required to demonstrate understanding and application of numerical concepts. This assignment is a comprehensive assessment of numeracy skills.
MATI3006
Numeracy 1
Autumn 2017
Coursework/Portfolio Brief
Learning outcomes assessed:
• Apply numerical skills, concepts and techniques in a variety of business and academic
contexts.
• Demonstrate an ability to calculate and interpret statistical values.
• Be able to interpret and process mathematical problems in personal and professional
contexts.
This coursework is worth 100% of the total marks for this module.
Coursework Instructions
Please read carefully
• Carefully read the module handbook, the marking criteria and the grade
descriptors.
Academic Misconduct
You are responsible for ensuring you understand the policy and regulations about academic
misconduct. You must:
• Complete this work alone except where required or allowed by this assignment
briefing paper and ensure it has not been written or composed by or with the
assistance of any other person.
Paraphrase This Document
Need a fresh take? Get an instant paraphrase of this document with our AI Paraphraser
• Make sure all sentences or passages quoted from other people’s work in this
assignment (with or without trivial changes) are in quotation marks, and are
specifically acknowledged by reference to the author, work and page.
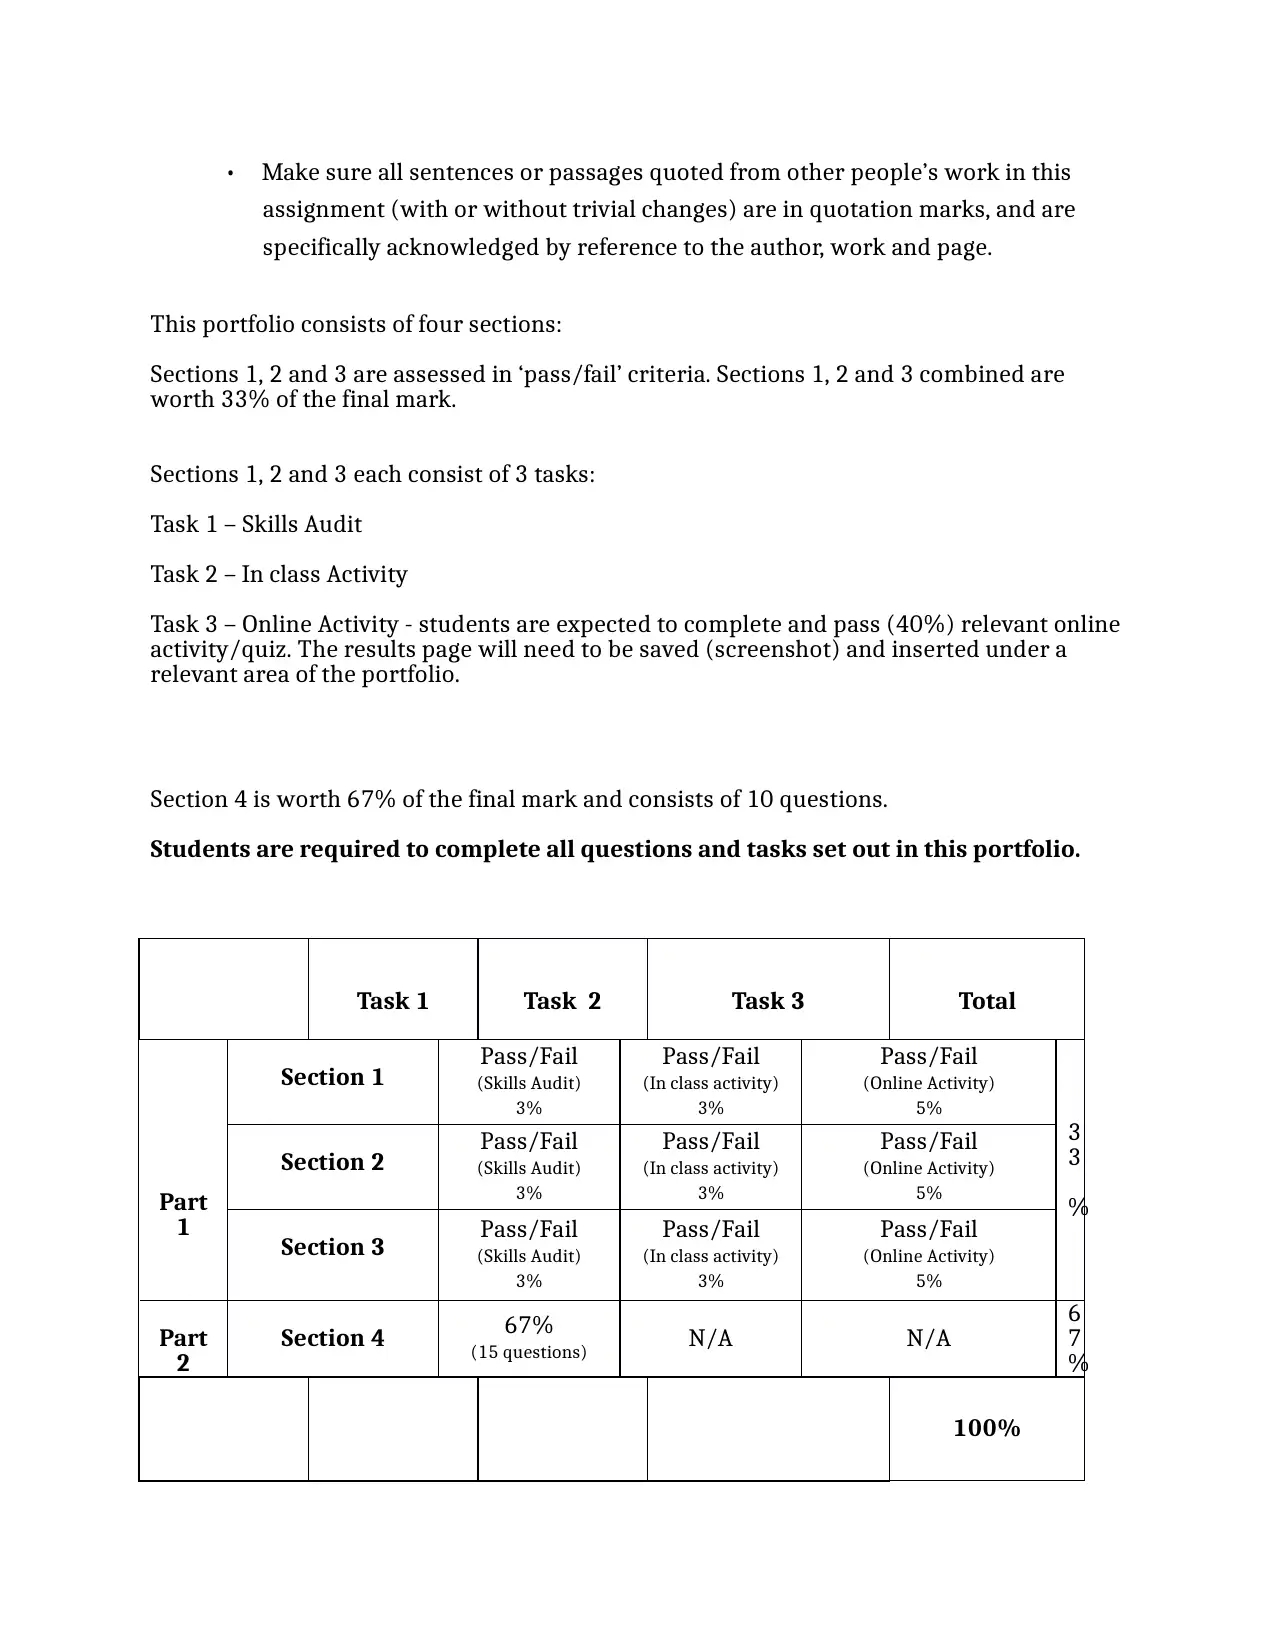
This portfolio consists of four sections:
Sections 1, 2 and 3 are assessed in ‘pass/fail’ criteria. Sections 1, 2 and 3 combined are
worth 33% of the final mark.
Sections 1, 2 and 3 each consist of 3 tasks:
Task 1 – Skills Audit
Task 2 – In class Activity
Task 3 – Online Activity - students are expected to complete and pass (40%) relevant online
activity/quiz. The results page will need to be saved (screenshot) and inserted under a
relevant area of the portfolio.
Section 4 is worth 67% of the final mark and consists of 10 questions.
Students are required to complete all questions and tasks set out in this portfolio.
Task 1 Task 2 Task 3 Total
Part
1
Section 1 Pass/Fail
(Skills Audit)
3%
Pass/Fail
(In class activity)
3%
Pass/Fail
(Online Activity)
5%
3
3
%
Section 2 Pass/Fail
(Skills Audit)
3%
Pass/Fail
(In class activity)
3%
Pass/Fail
(Online Activity)
5%
Section 3 Pass/Fail
(Skills Audit)
3%
Pass/Fail
(In class activity)
3%
Pass/Fail
(Online Activity)
5%
Part
2 Section 4 67%
(15 questions) N/A N/A 6
7
%
100%
assignment (with or without trivial changes) are in quotation marks, and are
specifically acknowledged by reference to the author, work and page.
This portfolio consists of four sections:
Sections 1, 2 and 3 are assessed in ‘pass/fail’ criteria. Sections 1, 2 and 3 combined are
worth 33% of the final mark.
Sections 1, 2 and 3 each consist of 3 tasks:
Task 1 – Skills Audit
Task 2 – In class Activity
Task 3 – Online Activity - students are expected to complete and pass (40%) relevant online
activity/quiz. The results page will need to be saved (screenshot) and inserted under a
relevant area of the portfolio.
Section 4 is worth 67% of the final mark and consists of 10 questions.
Students are required to complete all questions and tasks set out in this portfolio.
Task 1 Task 2 Task 3 Total
Part
1
Section 1 Pass/Fail
(Skills Audit)
3%
Pass/Fail
(In class activity)
3%
Pass/Fail
(Online Activity)
5%
3
3
%
Section 2 Pass/Fail
(Skills Audit)
3%
Pass/Fail
(In class activity)
3%
Pass/Fail
(Online Activity)
5%
Section 3 Pass/Fail
(Skills Audit)
3%
Pass/Fail
(In class activity)
3%
Pass/Fail
(Online Activity)
5%
Part
2 Section 4 67%
(15 questions) N/A N/A 6
7
%
100%
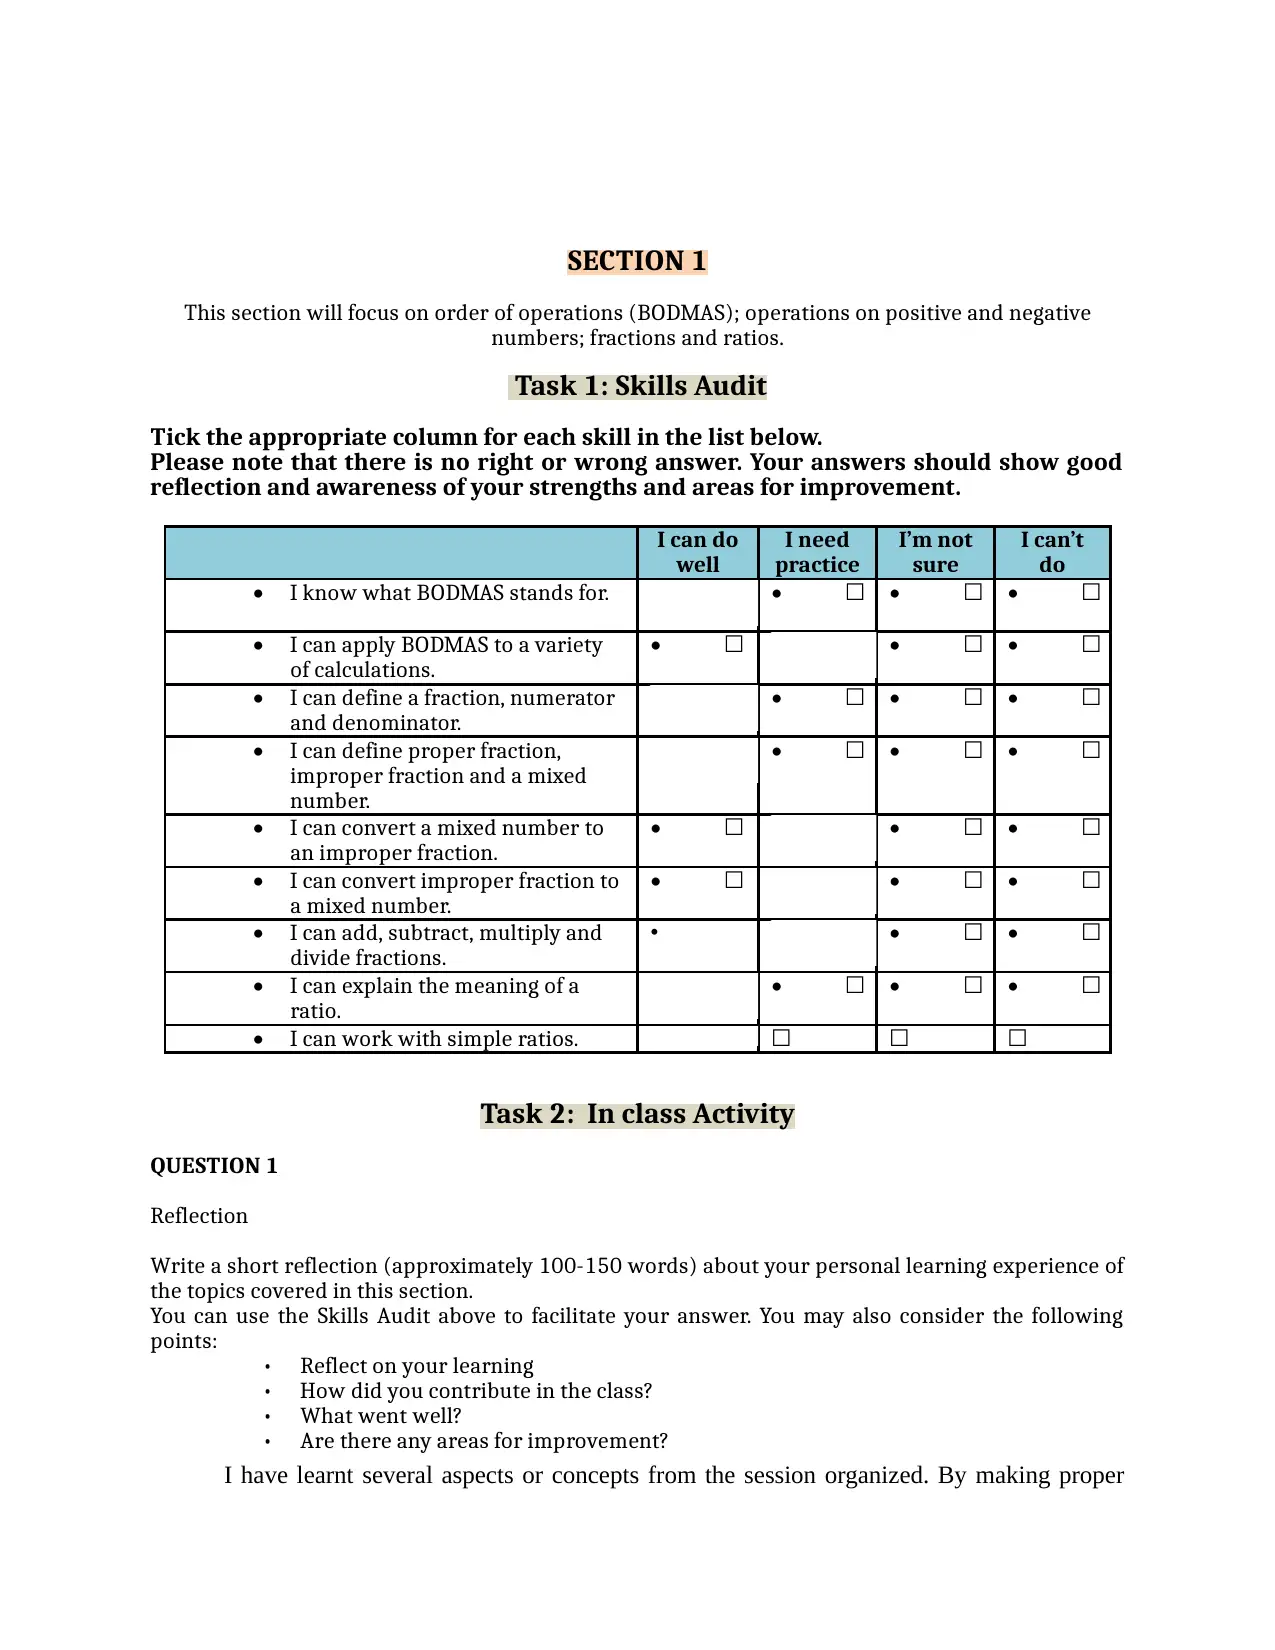
SECTION 1
This section will focus on order of operations (BODMAS); operations on positive and negative
numbers; fractions and ratios.
Task 1: Skills Audit
Tick the appropriate column for each skill in the list below.
Please note that there is no right or wrong answer. Your answers should show good
reflection and awareness of your strengths and areas for improvement.
I can do
well
I need
practice
I’m not
sure
I can’t
do
• I know what BODMAS stands for. • • ☐ • ☐ • ☐
• I can apply BODMAS to a variety
of calculations.
• ☐ • • ☐ • ☐
• I can define a fraction, numerator
and denominator.
• • ☐ • ☐ • ☐
• I can define proper fraction,
improper fraction and a mixed
number.
• • ☐ • ☐ • ☐
• I can convert a mixed number to
an improper fraction.
• ☐ • • ☐ • ☐
• I can convert improper fraction to
a mixed number.
• ☐ • • ☐ • ☐
• I can add, subtract, multiply and
divide fractions.
• • • ☐ • ☐
• I can explain the meaning of a
ratio.
• • ☐ • ☐ • ☐
• I can work with simple ratios. ☐ ☐ ☐
Task 2: In class Activity
QUESTION 1
Reflection
Write a short reflection (approximately 100-150 words) about your personal learning experience of
the topics covered in this section.
You can use the Skills Audit above to facilitate your answer. You may also consider the following
points:
• Reflect on your learning
• How did you contribute in the class?
• What went well?
• Are there any areas for improvement?
I have learnt several aspects or concepts from the session organized. By making proper
⊘ This is a preview!⊘
Do you want full access?
Subscribe today to unlock all pages.
Trusted by 1+ million students worldwide
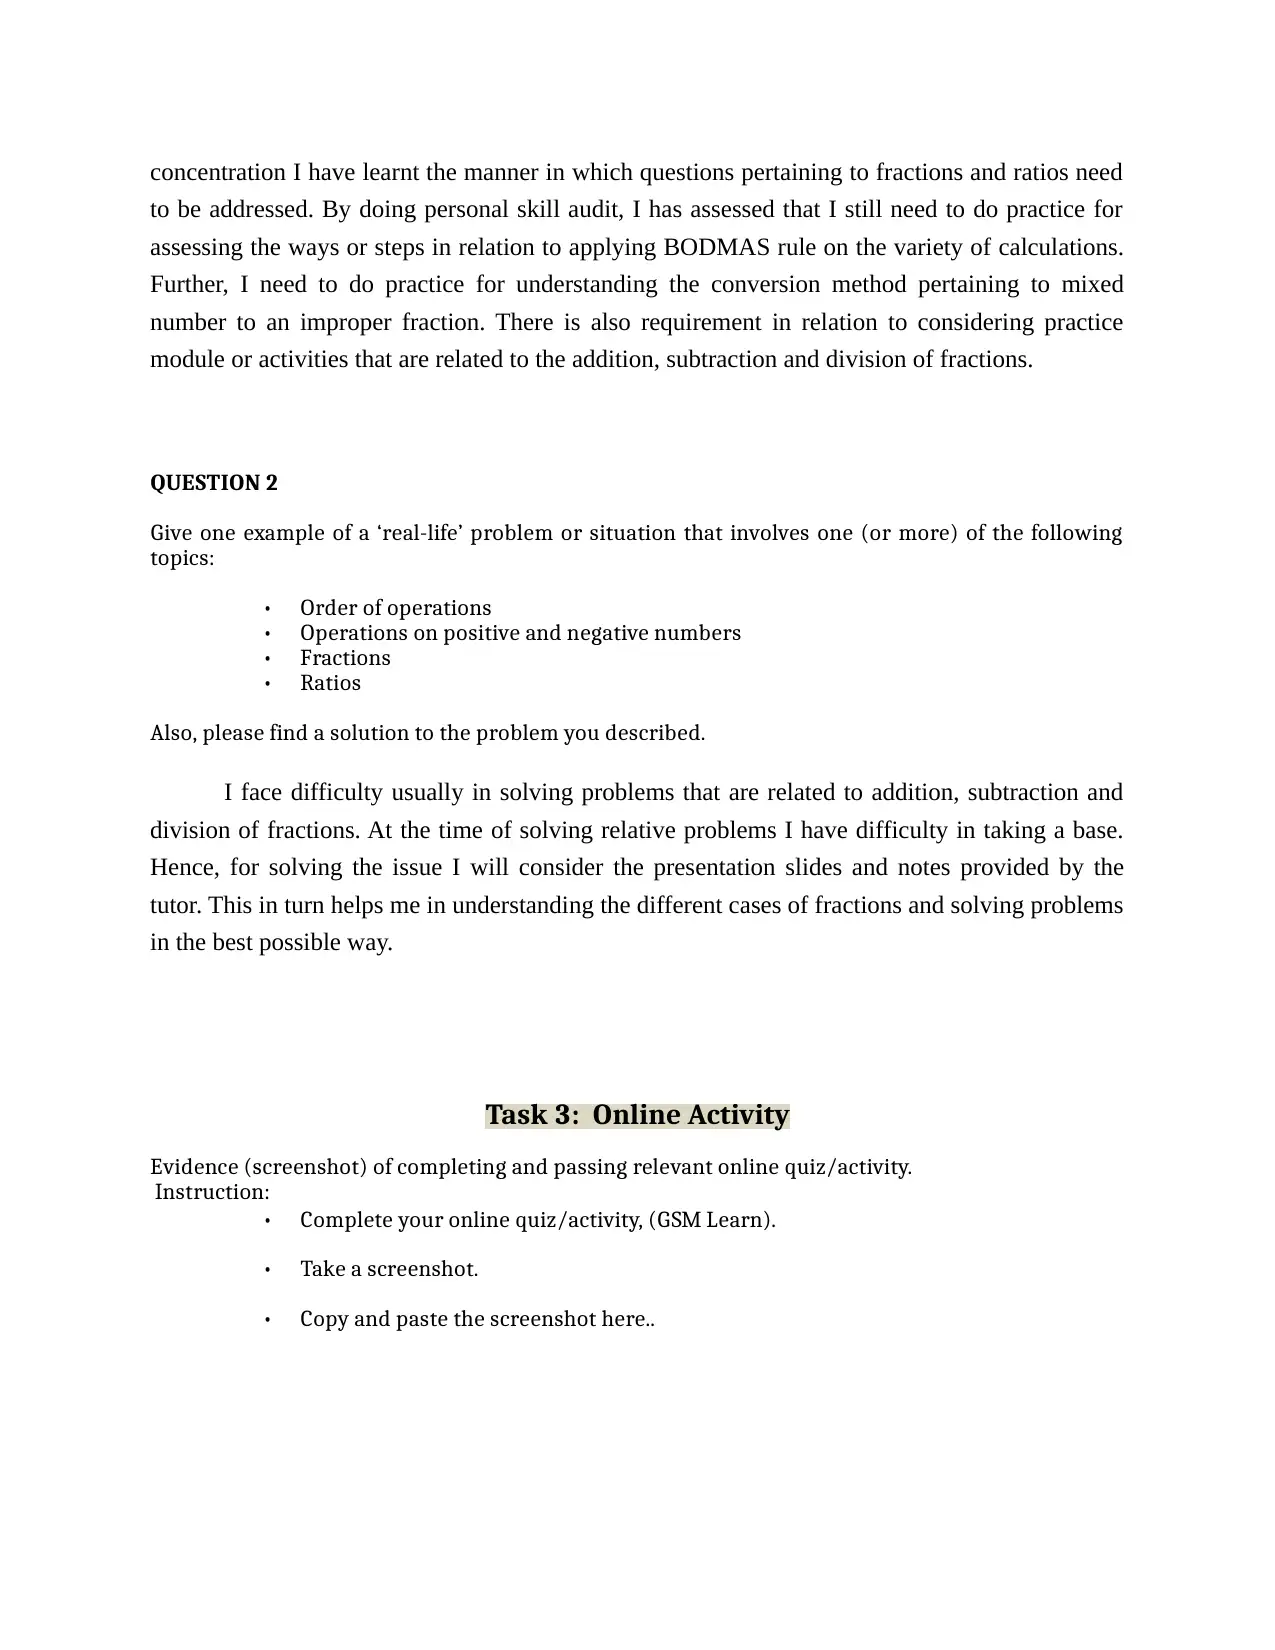
concentration I have learnt the manner in which questions pertaining to fractions and ratios need
to be addressed. By doing personal skill audit, I has assessed that I still need to do practice for
assessing the ways or steps in relation to applying BODMAS rule on the variety of calculations.
Further, I need to do practice for understanding the conversion method pertaining to mixed
number to an improper fraction. There is also requirement in relation to considering practice
module or activities that are related to the addition, subtraction and division of fractions.
QUESTION 2
Give one example of a ‘real-life’ problem or situation that involves one (or more) of the following
topics:
• Order of operations
• Operations on positive and negative numbers
• Fractions
• Ratios
Also, please find a solution to the problem you described.
I face difficulty usually in solving problems that are related to addition, subtraction and
division of fractions. At the time of solving relative problems I have difficulty in taking a base.
Hence, for solving the issue I will consider the presentation slides and notes provided by the
tutor. This in turn helps me in understanding the different cases of fractions and solving problems
in the best possible way.
Task 3: Online Activity
Evidence (screenshot) of completing and passing relevant online quiz/activity.
Instruction:
• Complete your online quiz/activity, (GSM Learn).
• Take a screenshot.
• Copy and paste the screenshot here..
Paraphrase This Document
Need a fresh take? Get an instant paraphrase of this document with our AI Paraphraser
SECTION 2
This section will focus on decimals, percentages and index numbers.
Task 1: Skills Audit
Tick the appropriate column for each skill in the list below.
Please note that there is no right or wrong answer. Your answers should show good
reflection and awareness of your strengths and areas for improvement.
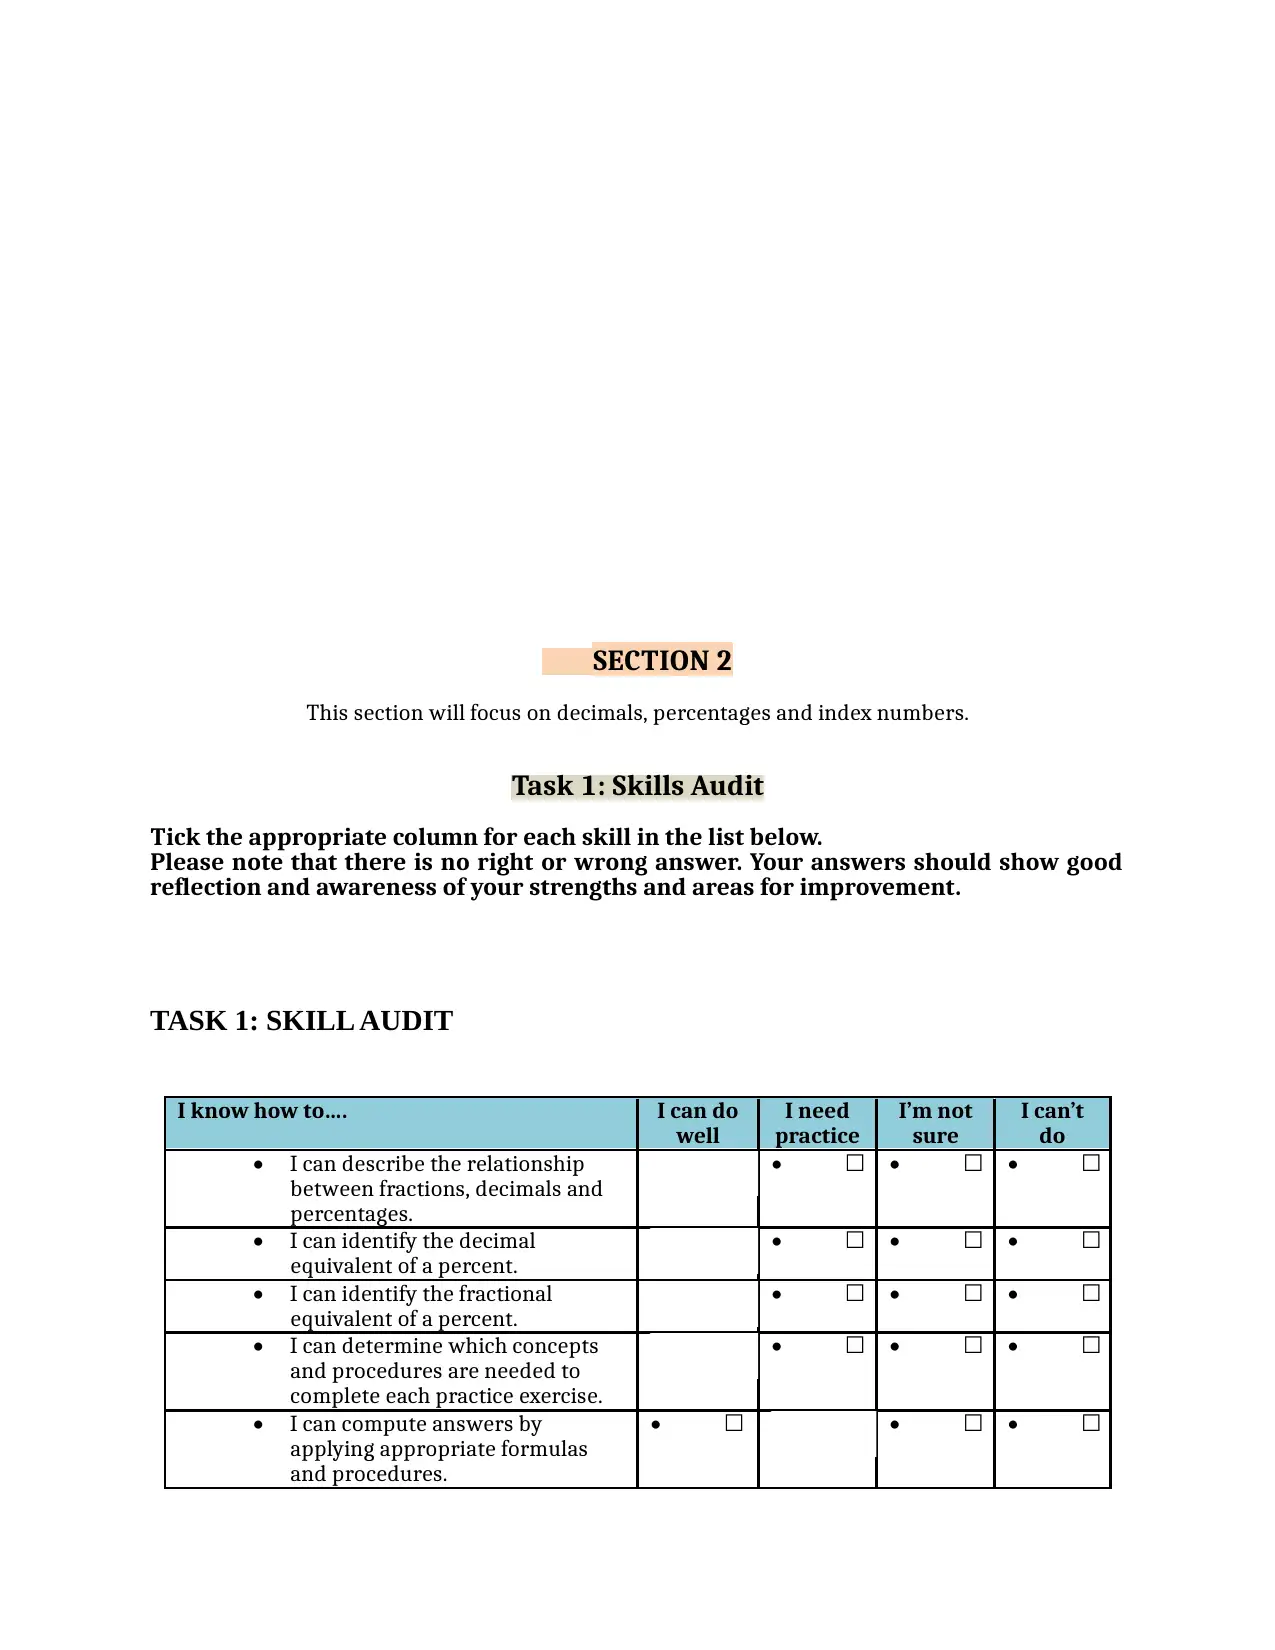
TASK 1: SKILL AUDIT
I know how to…. I can do
well
I need
practice
I’m not
sure
I can’t
do
• I can describe the relationship
between fractions, decimals and
percentages.
• • ☐ • ☐ • ☐
• I can identify the decimal
equivalent of a percent.
• • ☐ • ☐ • ☐
• I can identify the fractional
equivalent of a percent.
• • ☐ • ☐ • ☐
• I can determine which concepts
and procedures are needed to
complete each practice exercise.
• • ☐ • ☐ • ☐
• I can compute answers by
applying appropriate formulas
and procedures.
• ☐ • • ☐ • ☐
This section will focus on decimals, percentages and index numbers.
Task 1: Skills Audit
Tick the appropriate column for each skill in the list below.
Please note that there is no right or wrong answer. Your answers should show good
reflection and awareness of your strengths and areas for improvement.
TASK 1: SKILL AUDIT
I know how to…. I can do
well
I need
practice
I’m not
sure
I can’t
do
• I can describe the relationship
between fractions, decimals and
percentages.
• • ☐ • ☐ • ☐
• I can identify the decimal
equivalent of a percent.
• • ☐ • ☐ • ☐
• I can identify the fractional
equivalent of a percent.
• • ☐ • ☐ • ☐
• I can determine which concepts
and procedures are needed to
complete each practice exercise.
• • ☐ • ☐ • ☐
• I can compute answers by
applying appropriate formulas
and procedures.
• ☐ • • ☐ • ☐
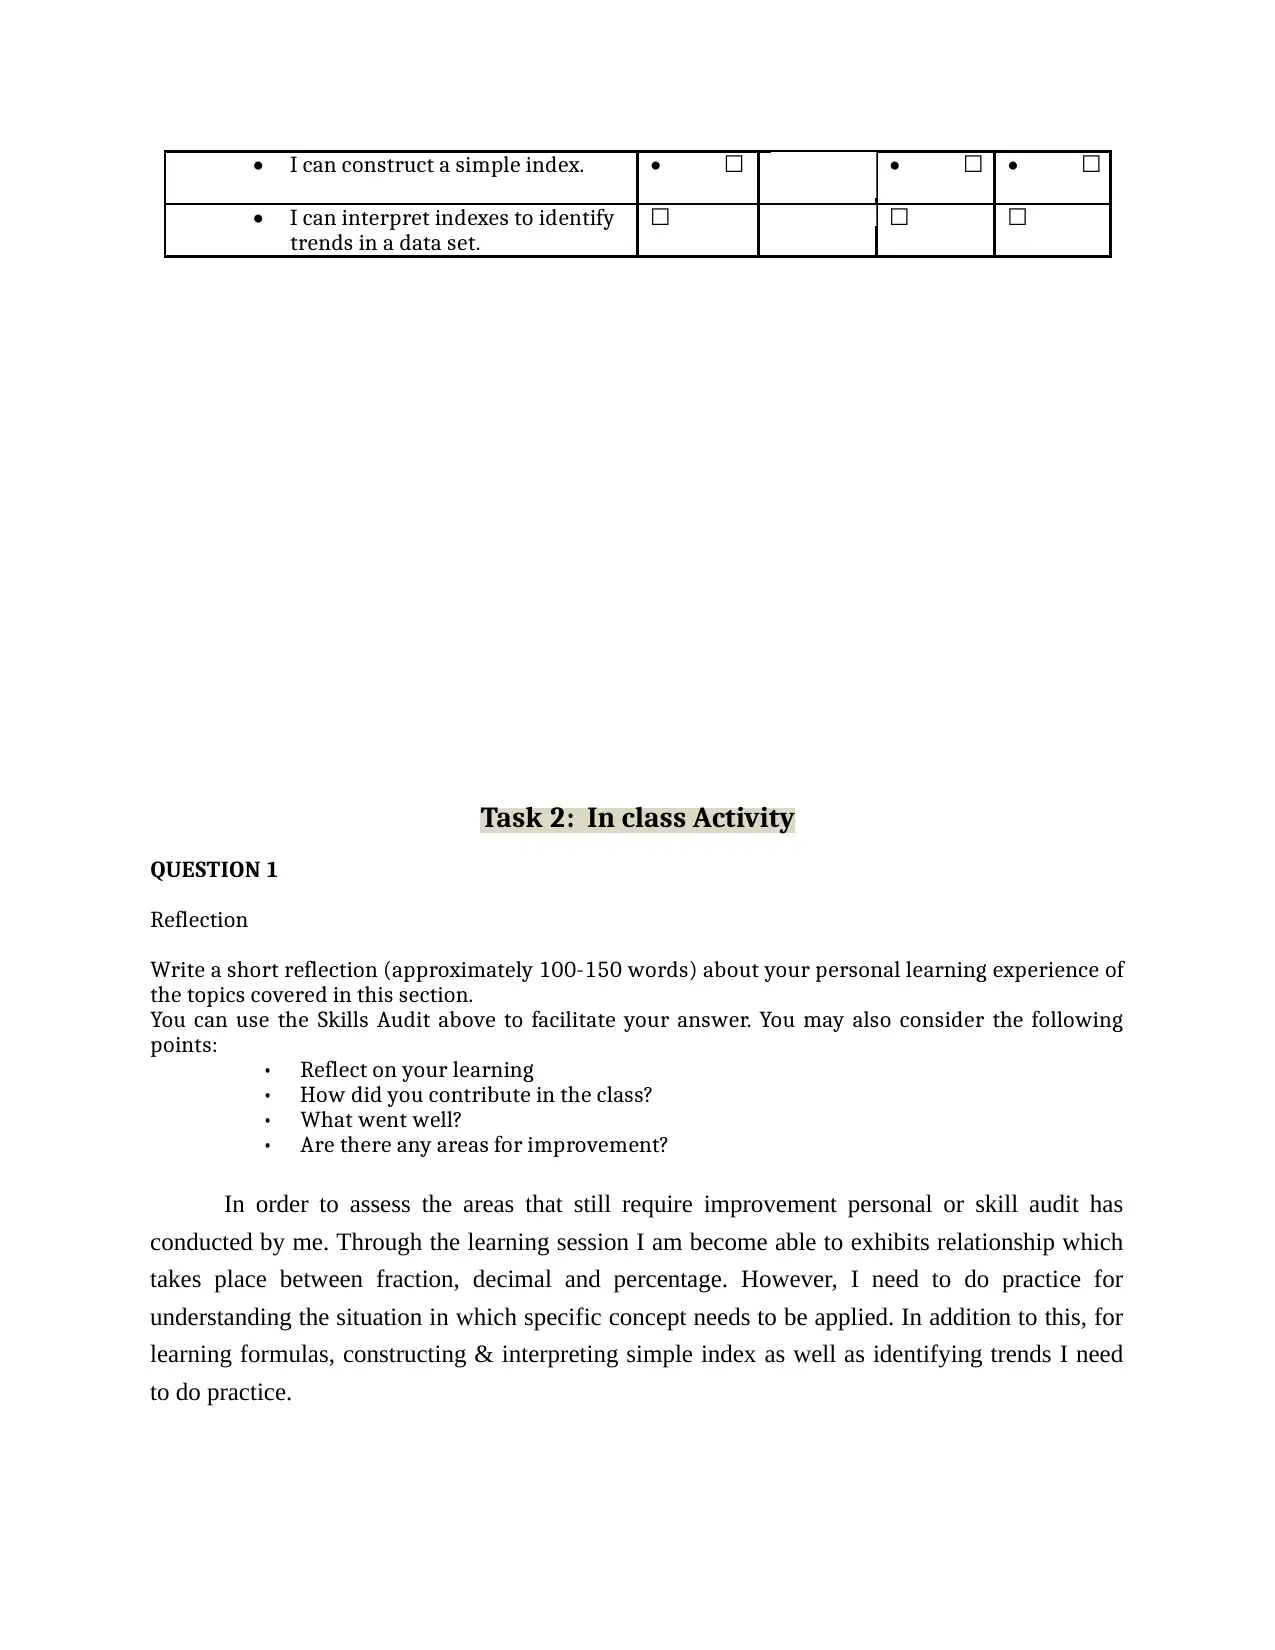
• I can construct a simple index. • ☐ • • ☐ • ☐
• I can interpret indexes to identify
trends in a data set.
☐ ☐ ☐
Task 2: In class Activity
QUESTION 1
Reflection
Write a short reflection (approximately 100-150 words) about your personal learning experience of
the topics covered in this section.
You can use the Skills Audit above to facilitate your answer. You may also consider the following
points:
• Reflect on your learning
• How did you contribute in the class?
• What went well?
• Are there any areas for improvement?
In order to assess the areas that still require improvement personal or skill audit has
conducted by me. Through the learning session I am become able to exhibits relationship which
takes place between fraction, decimal and percentage. However, I need to do practice for
understanding the situation in which specific concept needs to be applied. In addition to this, for
learning formulas, constructing & interpreting simple index as well as identifying trends I need
to do practice.
⊘ This is a preview!⊘
Do you want full access?
Subscribe today to unlock all pages.
Trusted by 1+ million students worldwide
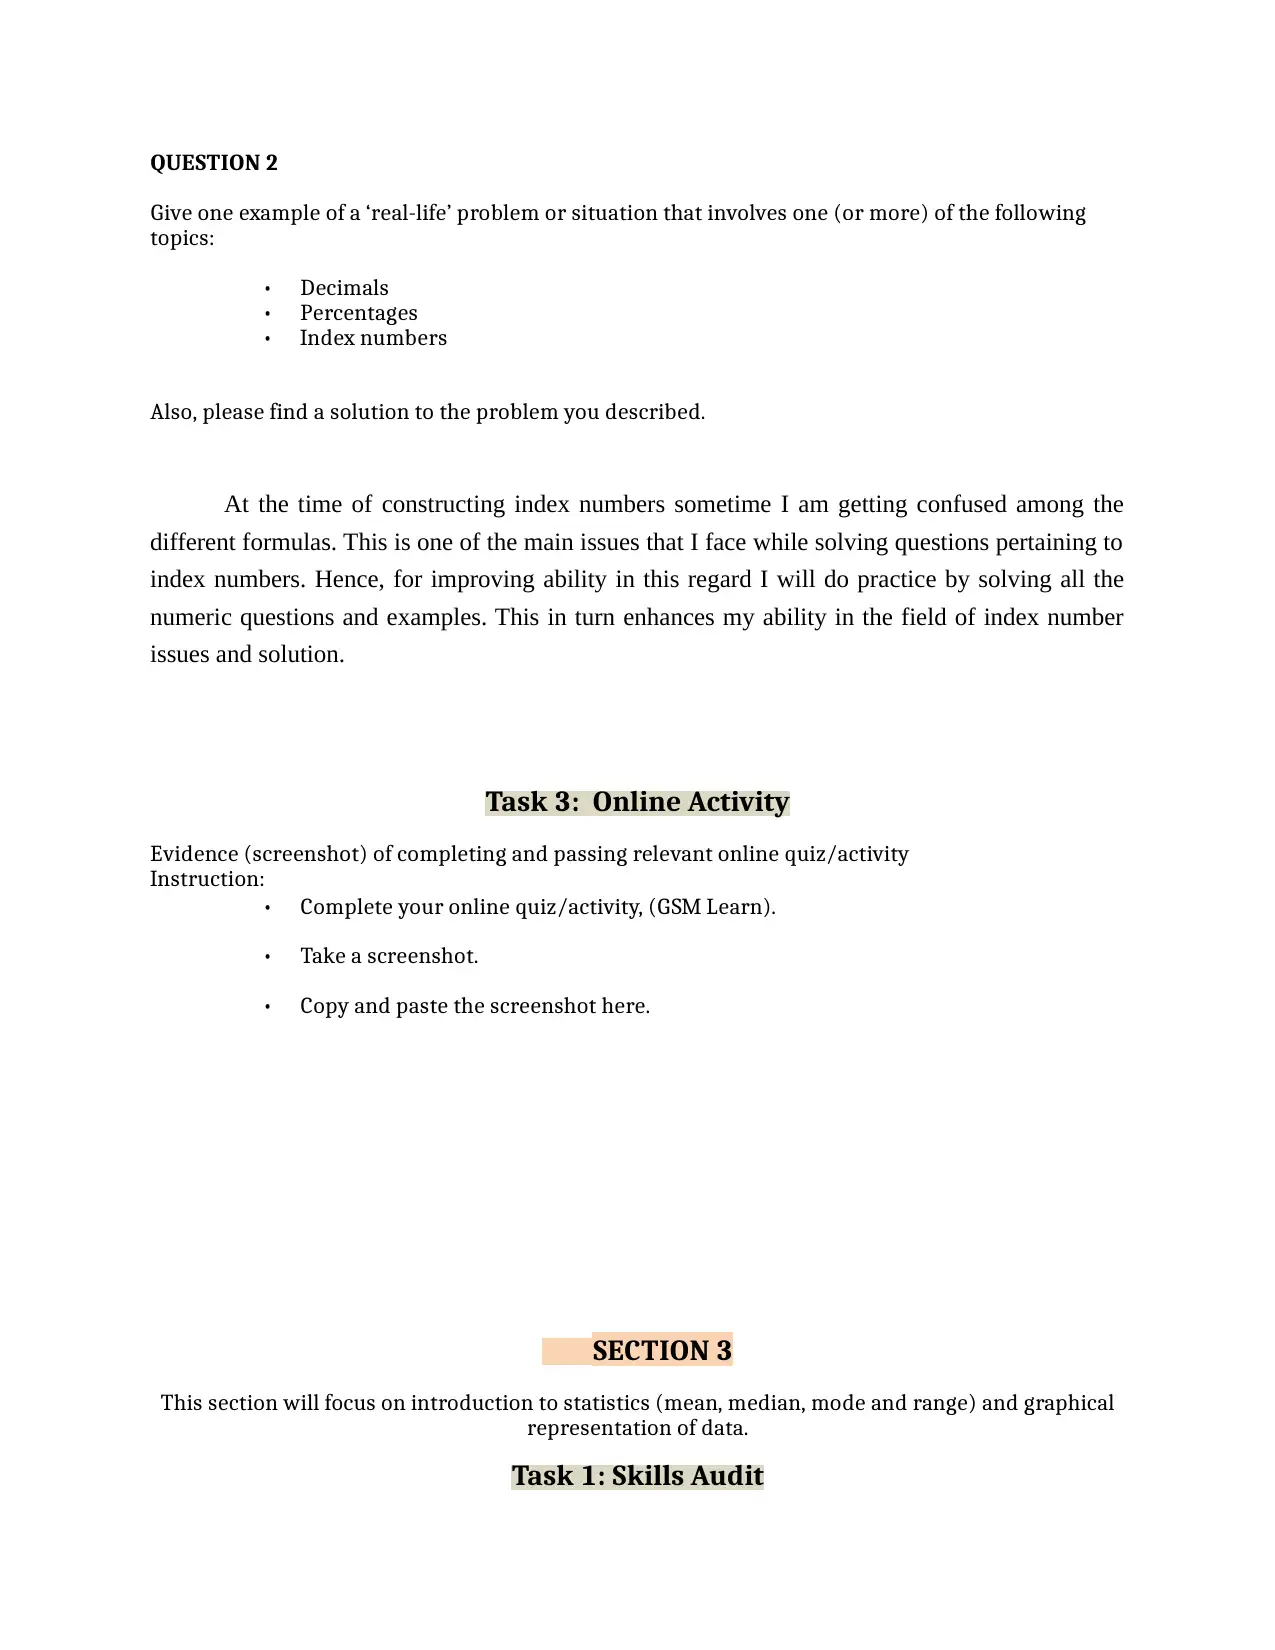
QUESTION 2
Give one example of a ‘real-life’ problem or situation that involves one (or more) of the following
topics:
• Decimals
• Percentages
• Index numbers
Also, please find a solution to the problem you described.
At the time of constructing index numbers sometime I am getting confused among the
different formulas. This is one of the main issues that I face while solving questions pertaining to
index numbers. Hence, for improving ability in this regard I will do practice by solving all the
numeric questions and examples. This in turn enhances my ability in the field of index number
issues and solution.
Task 3: Online Activity
Evidence (screenshot) of completing and passing relevant online quiz/activity
Instruction:
• Complete your online quiz/activity, (GSM Learn).
• Take a screenshot.
• Copy and paste the screenshot here.
SECTION 3
This section will focus on introduction to statistics (mean, median, mode and range) and graphical
representation of data.
Task 1: Skills Audit
Paraphrase This Document
Need a fresh take? Get an instant paraphrase of this document with our AI Paraphraser
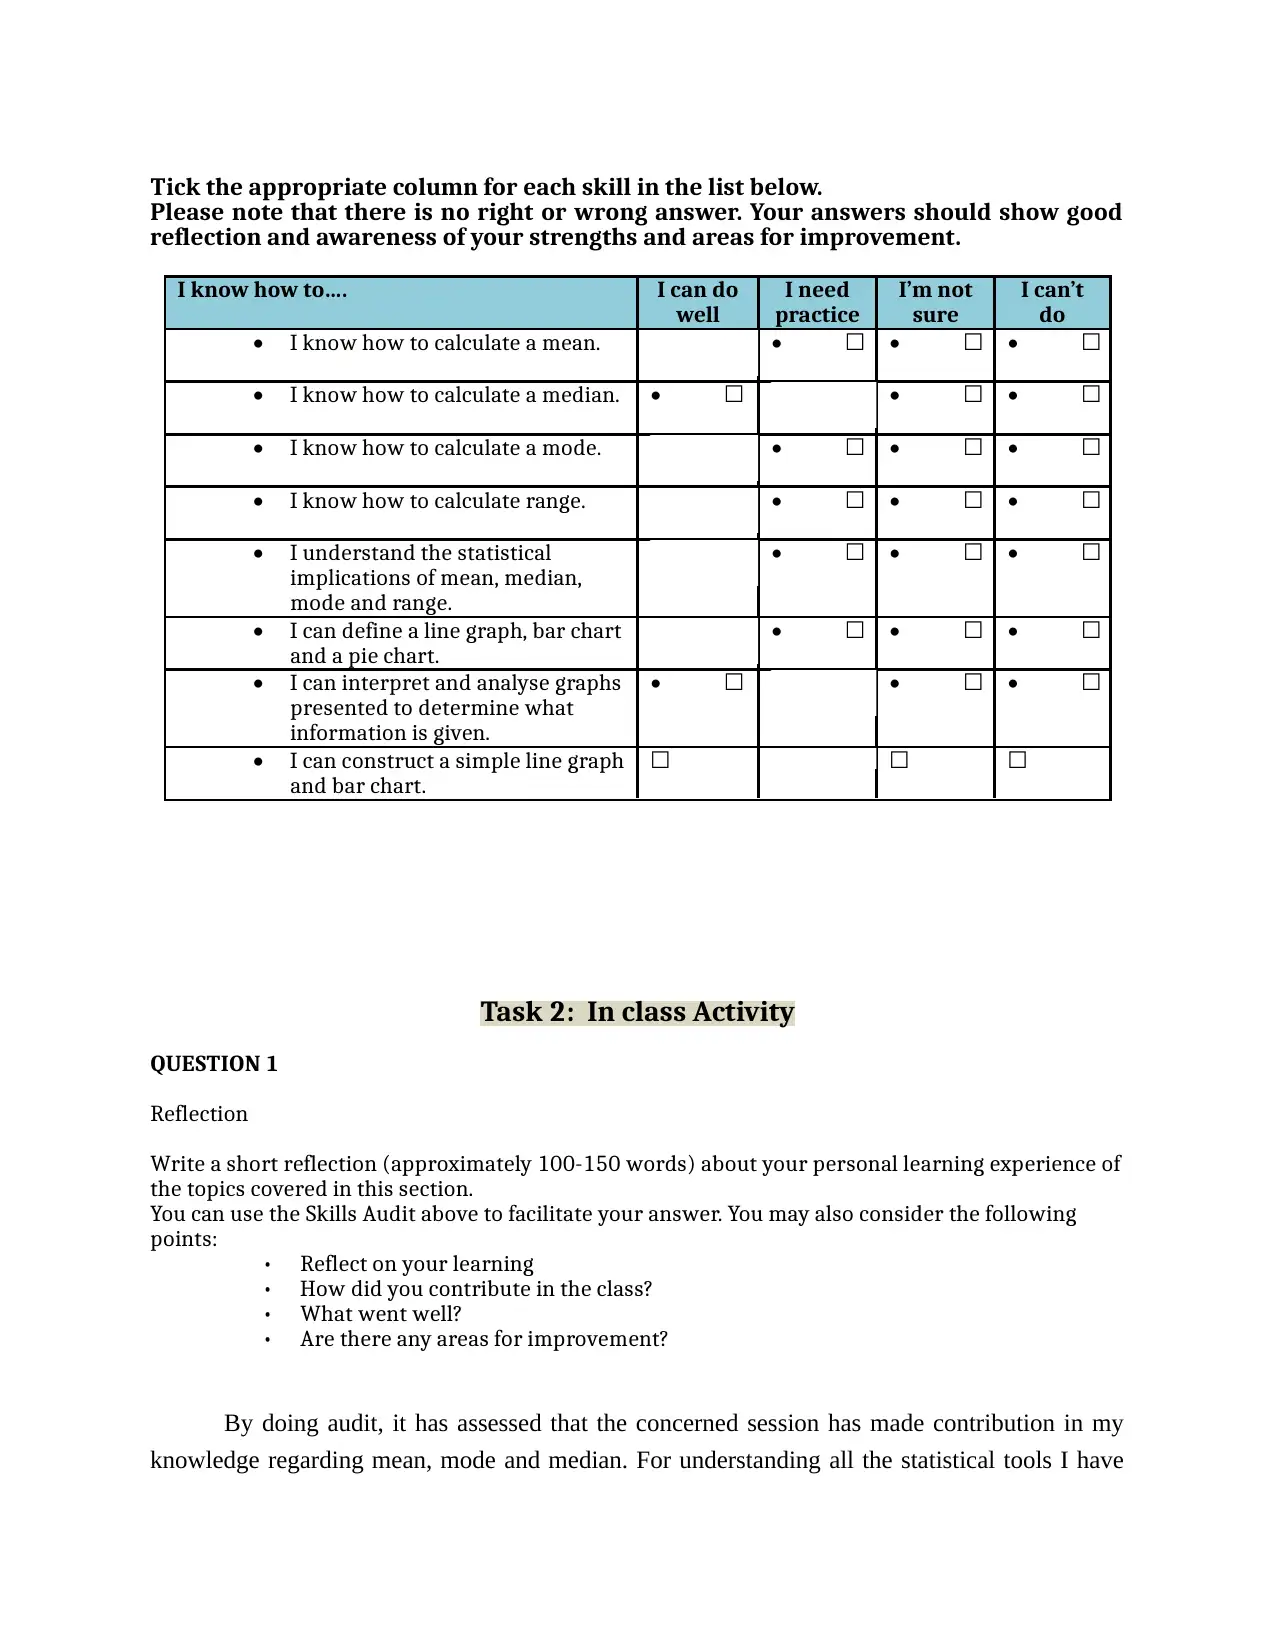
Tick the appropriate column for each skill in the list below.
Please note that there is no right or wrong answer. Your answers should show good
reflection and awareness of your strengths and areas for improvement.
I know how to…. I can do
well
I need
practice
I’m not
sure
I can’t
do
• I know how to calculate a mean. • • ☐ • ☐ • ☐
• I know how to calculate a median. • ☐ • • ☐ • ☐
• I know how to calculate a mode. • • ☐ • ☐ • ☐
• I know how to calculate range. • • ☐ • ☐ • ☐
• I understand the statistical
implications of mean, median,
mode and range.
• • ☐ • ☐ • ☐
• I can define a line graph, bar chart
and a pie chart.
• • ☐ • ☐ • ☐
• I can interpret and analyse graphs
presented to determine what
information is given.
• ☐ • • ☐ • ☐
• I can construct a simple line graph
and bar chart.
☐ ☐ ☐
Task 2: In class Activity
QUESTION 1
Reflection
Write a short reflection (approximately 100-150 words) about your personal learning experience of
the topics covered in this section.
You can use the Skills Audit above to facilitate your answer. You may also consider the following
points:
• Reflect on your learning
• How did you contribute in the class?
• What went well?
• Are there any areas for improvement?
By doing audit, it has assessed that the concerned session has made contribution in my
knowledge regarding mean, mode and median. For understanding all the statistical tools I have
made best efforts by doing regular practice. However, I face issue in constructing simple line
graph and bar chart. Further, through skill audit I have found that I am facing problems in
interpreting graphs and presenting data set in a structured way.
QUESTION 2
Give one example of a ‘real-life’ problem or situation that involves one (or more) of the following
topics:
• Introduction to statistics (mean, median, mode and range)
• Graphical representation of data
Also, please find a solution to the problem you described.
At the time of constructing index numbers sometime I am getting confused among the
different formulas. This is one of the main issues that I face while solving questions pertaining to
index numbers. Hence, for improving ability in this regard I will do practice by solving all the
numeric questions and examples. This in turn enhances my ability in the field of index number
issues and solution.
Task 3: Online Activity
Evidence (screenshot) of completing and passing relevant online quiz/activity.
Instruction:
• Complete your online quiz/activity, (GSM Learn).
• Take a screenshot.
• Copy and paste the screenshot here. .
SECTION 4
QUESTION. 1 [2 marks]
⊘ This is a preview!⊘
Do you want full access?
Subscribe today to unlock all pages.
Trusted by 1+ million students worldwide
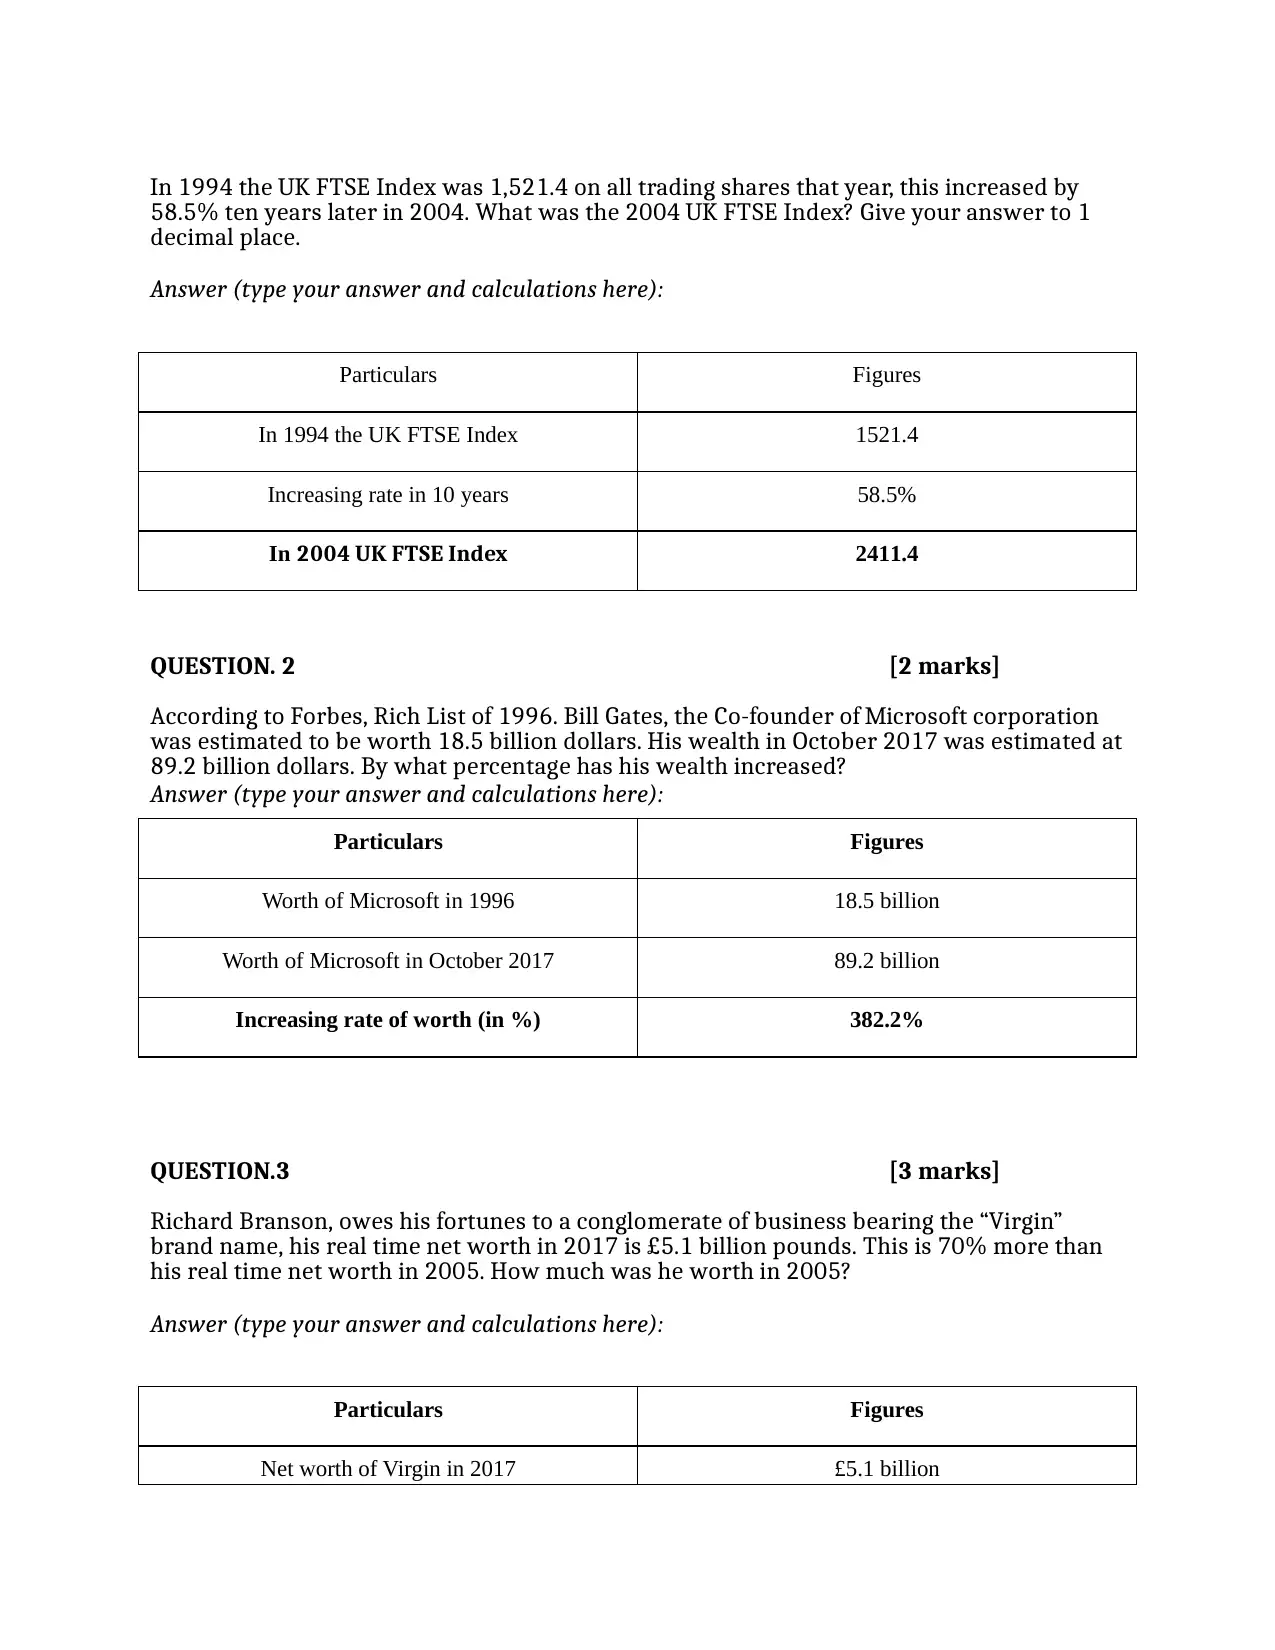
In 1994 the UK FTSE Index was 1,521.4 on all trading shares that year, this increased by
58.5% ten years later in 2004. What was the 2004 UK FTSE Index? Give your answer to 1
decimal place.
Answer (type your answer and calculations here):
Particulars Figures
In 1994 the UK FTSE Index 1521.4
Increasing rate in 10 years 58.5%
In 2004 UK FTSE Index 2411.4
QUESTION. 2 [2 marks]
According to Forbes, Rich List of 1996. Bill Gates, the Co-founder of Microsoft corporation
was estimated to be worth 18.5 billion dollars. His wealth in October 2017 was estimated at
89.2 billion dollars. By what percentage has his wealth increased?
Answer (type your answer and calculations here):
Particulars Figures
Worth of Microsoft in 1996 18.5 billion
Worth of Microsoft in October 2017 89.2 billion
Increasing rate of worth (in %) 382.2%
QUESTION.3 [3 marks]
Richard Branson, owes his fortunes to a conglomerate of business bearing the “Virgin”
brand name, his real time net worth in 2017 is £5.1 billion pounds. This is 70% more than
his real time net worth in 2005. How much was he worth in 2005?
Answer (type your answer and calculations here):
Particulars Figures
Net worth of Virgin in 2017 £5.1 billion
Paraphrase This Document
Need a fresh take? Get an instant paraphrase of this document with our AI Paraphraser
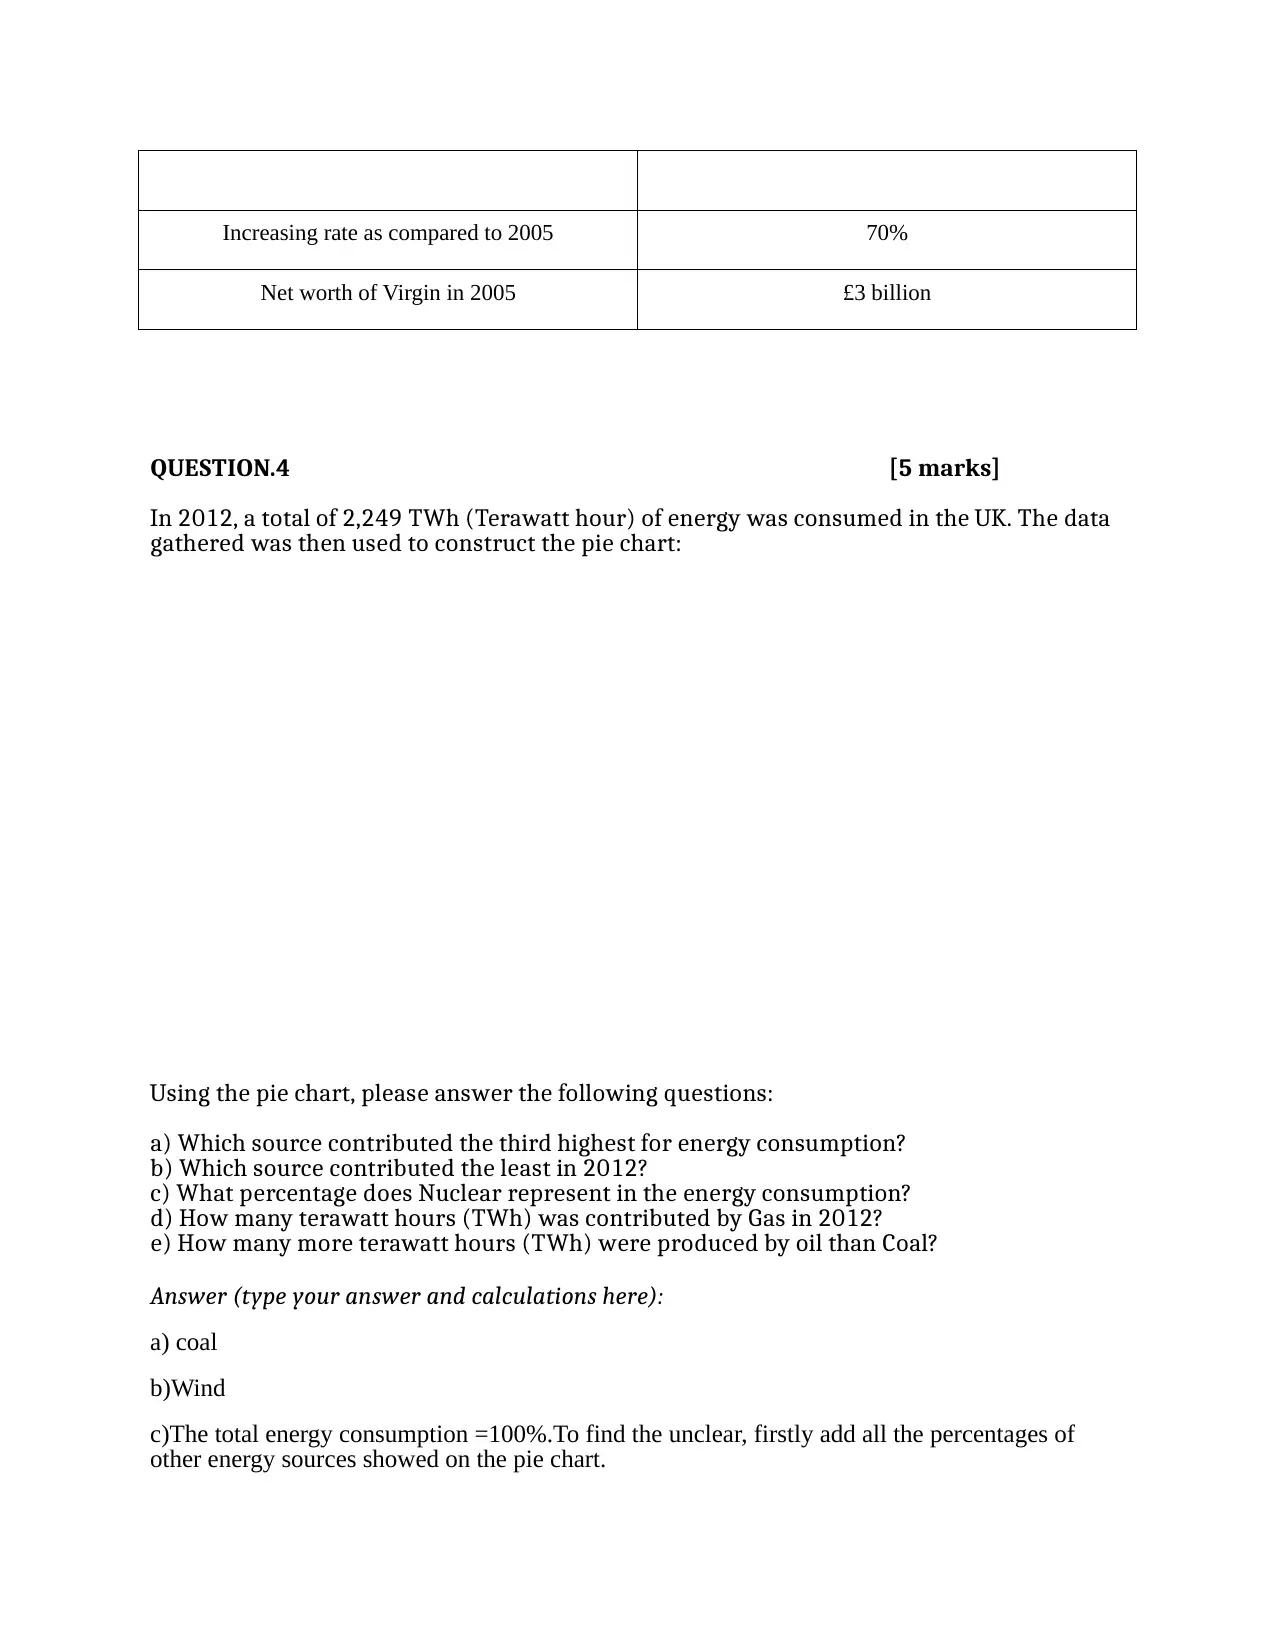
Increasing rate as compared to 2005 70%
Net worth of Virgin in 2005 £3 billion
QUESTION.4 [5 marks]
In 2012, a total of 2,249 TWh (Terawatt hour) of energy was consumed in the UK. The data
gathered was then used to construct the pie chart:
Using the pie chart, please answer the following questions:
a) Which source contributed the third highest for energy consumption?
b) Which source contributed the least in 2012?
c) What percentage does Nuclear represent in the energy consumption?
d) How many terawatt hours (TWh) was contributed by Gas in 2012?
e) How many more terawatt hours (TWh) were produced by oil than Coal?
Answer (type your answer and calculations here):
a) coal
b)Wind
c)The total energy consumption =100%.To find the unclear, firstly add all the percentages of
other energy sources showed on the pie chart.
=wind (2%)+coal(20%)+oil(34%)+gas(36%)=92%
Subtract the value from the answer.
100-92=8
The percentage of nuclear= 8%
d ) To find the terawatt hours of gas ,workout the percentage of gas represented from the total
amount of terawatt hours consumed.
=36% of 2,249
=0.36*2249=810 terawatt hours ( 809.64)
e) Calculation of terawatt hours of oil and coal.
Terawatt hours of oil=0.34%*2,249=765 (764.66)
Terawatt hours of coal =0.20%*2,249=449 (449.8)
Hence: 765-450=315 more terawatt hours.
QUESTION 5 [3 marks]
⊘ This is a preview!⊘
Do you want full access?
Subscribe today to unlock all pages.
Trusted by 1+ million students worldwide
1 out of 23
Related Documents


Your All-in-One AI-Powered Toolkit for Academic Success.
+13062052269
info@desklib.com
Available 24*7 on WhatsApp / Email
![[object Object]](/_next/static/media/star-bottom.7253800d.svg)
Unlock your academic potential
Copyright © 2020–2026 A2Z Services. All Rights Reserved. Developed and managed by ZUCOL.