Detailed Business Analysis Report: Maxis Bhd Telecommunications
VerifiedAdded on 2021/01/02
|13
|3676
|472
Report
AI Summary
This report delivers a comprehensive business analysis of Maxis Bhd, a Malaysian telecommunications company. It begins with an introduction outlining the company's strategic objectives and market position, followed by a strategic analysis that employs PESTEL framework to assess external factors impacting the company, and Porter's Five Forces to evaluate industry competition. Key Performance Indicators (KPIs) are then examined to assess Maxis Bhd's performance. The report further includes a financial analysis, comparing Maxis Bhd's performance with competitors DiGi Telecommunications and Celcom (Malaysia) Berhad using financial ratios such as current ratio, gross profit margin, net profit margin, and return on capital employed (ROCE). Limitations of the analysis are discussed before concluding with recommendations for future strategies. The report provides a detailed examination of Maxis Bhd's business operations and financial standing within the Malaysian telecommunications industry.
BUSINESS ANALYSIS PROJECT
Paraphrase This Document
Need a fresh take? Get an instant paraphrase of this document with our AI Paraphraser
Contents
INTRODUCTION...........................................................................................................................1
STRATEGIC ANALYSIS...............................................................................................................1
PESTEL.......................................................................................................................................1
Porter 5 Forces.............................................................................................................................2
Key Performance Indicators (KPI)..............................................................................................3
FINANCIAL ANALYSIS...............................................................................................................4
Current ratio.................................................................................................................................5
Gross profit margin......................................................................................................................5
Net profit margin.........................................................................................................................6
Return on capital employed (ROCE)...........................................................................................6
Industry specified performance...................................................................................................6
LIMITATION..................................................................................................................................8
Limitation of strategic analysis....................................................................................................8
Limitation of financial analysis...................................................................................................9
CONCLUSION................................................................................................................................9
RECOMMENDATION.................................................................................................................10
REFERNCES.................................................................................................................................11
1
INTRODUCTION
In order to reach out towards specified goal and long term objective of company senior
level management will be forming Business Strategies which will be leading to growth and
strong position of firm in market. The major focus will be on vision and mission of company and
gaining out market position for further growth or expansion planning. So this current report is
covering analysing and understanding critical strategy of business of Maxis Bhd which is
Malaysian Telecommunication Company founded in 1993. Report will also be comparing and
benchmarking company with their key competitors within industry like that of DiGi
Telecommunications and Celcom (Malaysia) Berhad.
STRATEGIC ANALYSIS
PESTEL
Maxis communication or Maxis Bhd is Malaysian Telecommunication Company
providing many different type of customer value added products and service to individual and
large consumers. Majority of shares of company is been owned by Ananda Krishnan and there
are 11 million customers till year 2015. Maxis Bhd is having its customers within areas like that
of Asia excluding Korea and Nepal and South America including Peru and Chile. So this current
part will be covering PESTEL which is determining external factors and how are they affecting
operations and working of company.
(P) Political
These factors would be the most which regulate and affect the operations of company that
is been working within country. Political factors would be those related to regulation issue
governed by ruling political party of that nation (JOSEPH. PHILLIPS, CBAP and PMP, 2018).
In case of telecommunication industry factors such as Wi-Fi and Internet is now been regarded to
as essential human right or need of all individuals. In the current stage where net neutrality is
impacting to treat all data onto internet as equal and not discriminating with any other based on
content, website or method of communication. So customers of Malaysian telecommunication
industry are demanding that government must be treating all internet provider equal which is
preventing from data speed and throttling of interne
(E) Economic
2
⊘ This is a preview!⊘
Do you want full access?
Subscribe today to unlock all pages.
Trusted by 1+ million students worldwide
All factors which is regulating demand and supply or price of products within country
will be counted under economic one. These elements will be including like that of interest rates,
inflation, GDP rate, employment and taxes which are affecting Malaysian telecommunication
industry. As if there are increased number of telecommunication companies with country this
would be calling for more educated and qualified personals thus improving employment rate
within industry. Inflation within country is also likely to impact customers of Maxis Bhd as they
will be avoiding spending higher level of their income on service providers if inflation is hitting
Malaysia. Thus causing company to lower down their price of products to attract more customers
or changing their plans.
(S) Social
There is no further scope for telecommunication business to get expanded within area
which is regarded as rural within one country (Nicholas and Steyn, 2017). There is no wide range
of products and service which are offered to customers so they are having very less option at
time of buying internet plan. Almost all telecommunication business will be having monopoly
over markets so they end up charging for both internet and mobile handset.
(T) Technological
This is the most important and effecting factor among all as there is technological
changes which are taking place on very regular level especially in telecommunication industry.
Maxis Bhd will be installing fibre wire instead of copper one, landline is now converted into
mobile which are now becoming more compact embedded with lots of features.
(E) Environmental
There are many changes in terms of global warming and climatic modifications which
surly is affecting telecommunication industry. Customers are also becoming more and more
environment concerns which are making them feel that companies must be focusing onto
manufacturing products concerning environment as well.
(L) Legal
Legislative issues and problems will also be affecting telecommunication sector and their
companies on wider aspect (Erl, Merson and Stoffers, 2017). Factors like that of monopolies,
customers and governments as Maxis is importing and exporting telecom products they are
allowed to do so.
3
Paraphrase This Document
Need a fresh take? Get an instant paraphrase of this document with our AI Paraphraser
Porter 5 Forces
These are force which is driving industrial analysis that of telecommunication sector of
Malaysia and is able to explain as to who the competitors are and how company could be
analysing its customers. In year 1985 Michael Porter introduced this model which is enabling
company within industry to identify customers, rivals, suppliers and substitutes.
Competitive rivalry-
Competitions in markets will be playing important role as price of products and service
will be factor causing tough rivalry among them all. Difference between firms will be competing
within same market and industry in other to gain share of customers within market. Maxis Bhd
within market is lowering down price so that customer of company could be increased.
Threat to substitutes-
Telecommunication industry or products will not be having any available substitute
within market as threat of having substitutes will be low (Weimer and Vining, 2017). There is no
other industry which is offering customers with products like that of mobile or internet services
or even similar feature product is also not certainly available.
Entry barriers-
There is very less chance of entry on any new company or entrance within
telecommunication industry as it required huge cost of capital for investment purpose. Even if
they are willing to come they are to face many barriers for their entry including legal and
political problems depending upon different countries.
Bargaining power of suppliers-
There are huge numbers of suppliers within this industry but the raw materials which are
available in small amount. So this will be giving suppliers to increase in their bargaining power
for companies imposing conditions on manufacturers by charging higher cost to raw materials.
Bargaining power of buyers-
Although there are not more in number of companies selling products and service related
to telecommunication then also customers will be having more bargaining power. They are
having higher level of information in regard to telecommunication industry but they are also very
much price sensitive and their switching will be affecting competitor as well.
4
Key Performance Indicators (KPI)
KPI is the process under which it would be including how company is able to achieve
their main objectives of business and this is helping in evaluating success of Maxis Bhd. There is
many other key performance indicators of telecommunication will be like that of:
Average return per user-
This is amount of money or capital which Maxis Bhd is generating for each of the person
or customer of company. This will be evaluating success and failure of company as Maxis is
having higher user base which is forming ARPU as higher.
Subscriber acquisition cost-
This is cost which is associated with acquiring of customers of telecom company like all
money or capital which is spend on promotion or advertising of products of company (McLean,
2018). If Maxis Bhd is able to identify this SAC then they will be able to take out all cost to
company.
Churn
Churn rate or user turnover is the rate at which users or customers of particular company
is been leaving its services and products over certain period of time (Prochaska and Norcross,
2018). Higher level of churn rate within firm will be meaning that products or service are not
impressing customer and they are not been able to continue with this same telecommunication
company.
Network operating cost-
This network for telecom industry is the most strong point of success if they are
providing faster and smoother network to their customers then it is known that customers are
indulging to use more of that network only.
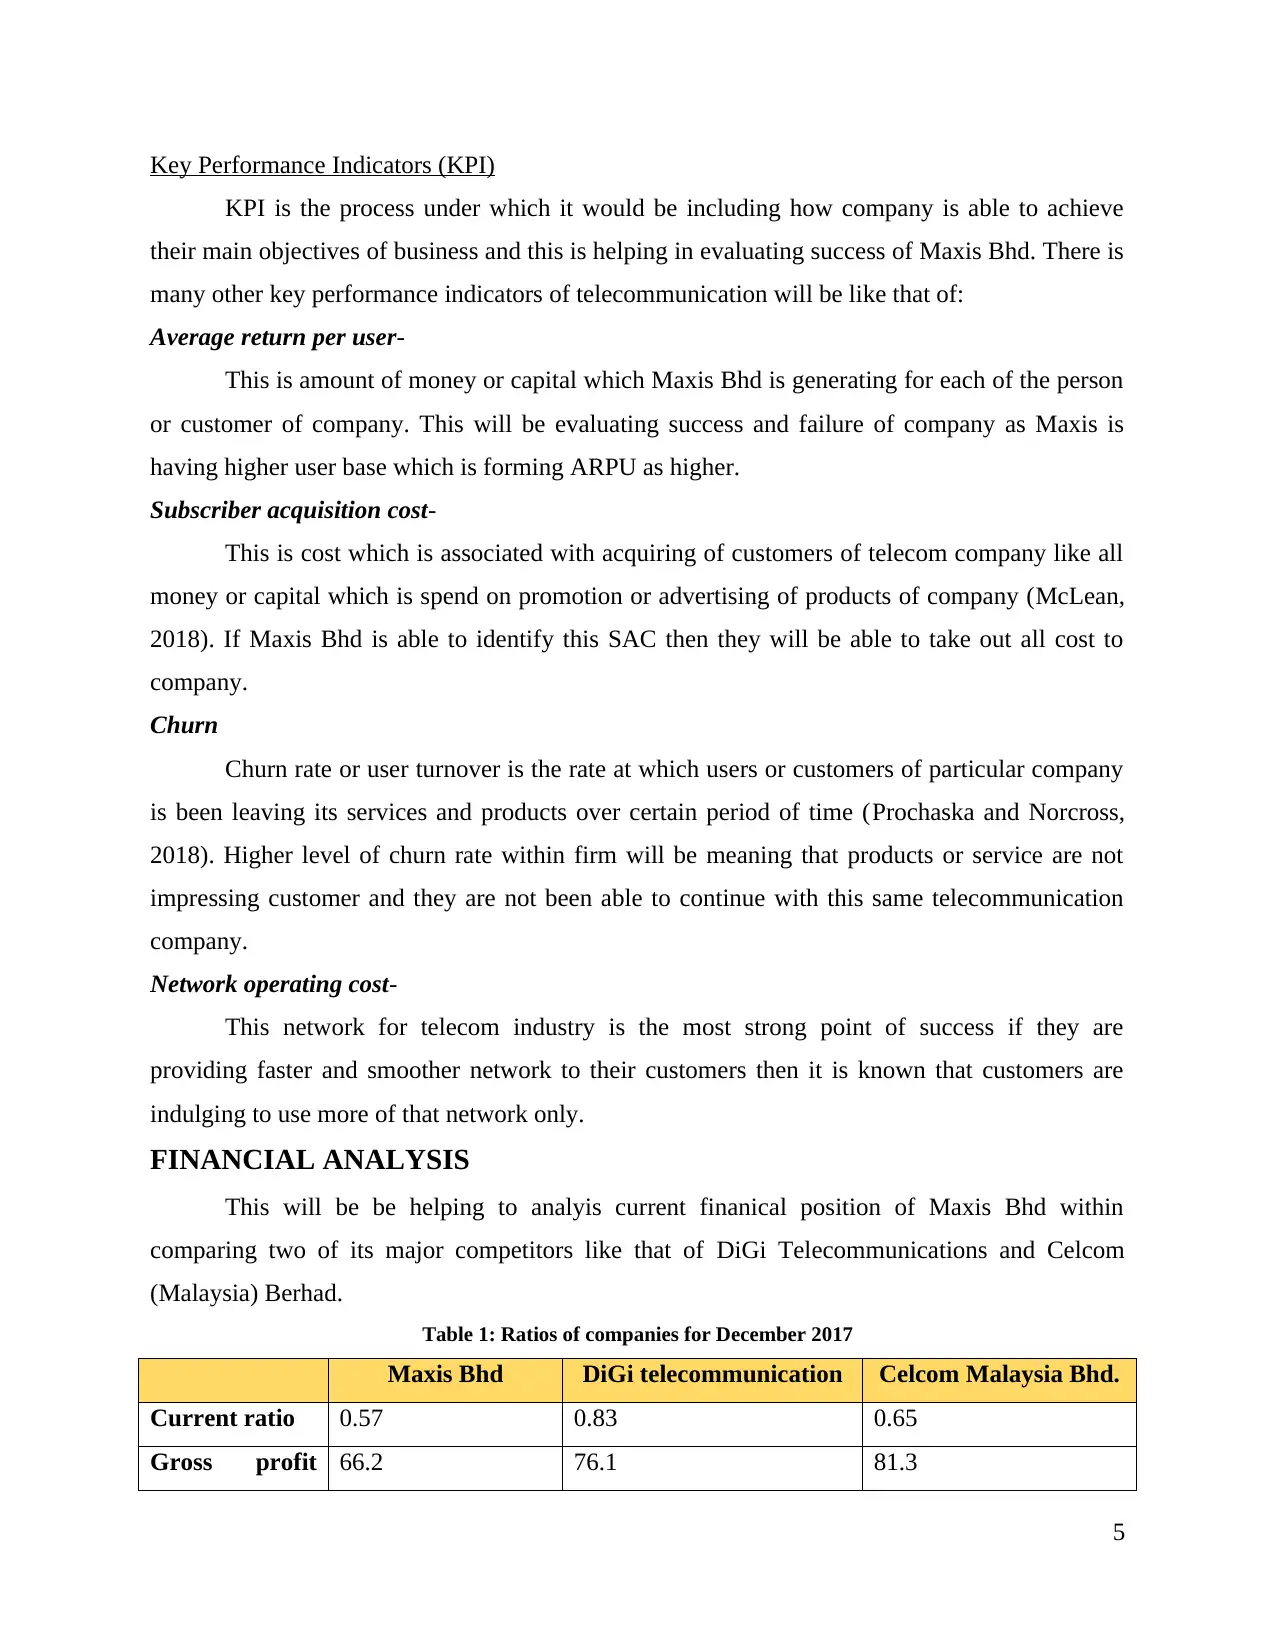
FINANCIAL ANALYSIS
This will be be helping to analyis current finanical position of Maxis Bhd within
comparing two of its major competitors like that of DiGi Telecommunications and Celcom
(Malaysia) Berhad.
Table 1: Ratios of companies for December 2017
Maxis Bhd DiGi telecommunication Celcom Malaysia Bhd.
Current ratio 0.57 0.83 0.65
Gross profit 66.2 76.1 81.3
5
KPI is the process under which it would be including how company is able to achieve
their main objectives of business and this is helping in evaluating success of Maxis Bhd. There is
many other key performance indicators of telecommunication will be like that of:
Average return per user-
This is amount of money or capital which Maxis Bhd is generating for each of the person
or customer of company. This will be evaluating success and failure of company as Maxis is
having higher user base which is forming ARPU as higher.
Subscriber acquisition cost-
This is cost which is associated with acquiring of customers of telecom company like all
money or capital which is spend on promotion or advertising of products of company (McLean,
2018). If Maxis Bhd is able to identify this SAC then they will be able to take out all cost to
company.
Churn
Churn rate or user turnover is the rate at which users or customers of particular company
is been leaving its services and products over certain period of time (Prochaska and Norcross,
2018). Higher level of churn rate within firm will be meaning that products or service are not
impressing customer and they are not been able to continue with this same telecommunication
company.
Network operating cost-
This network for telecom industry is the most strong point of success if they are
providing faster and smoother network to their customers then it is known that customers are
indulging to use more of that network only.
FINANCIAL ANALYSIS
This will be be helping to analyis current finanical position of Maxis Bhd within
comparing two of its major competitors like that of DiGi Telecommunications and Celcom
(Malaysia) Berhad.
Table 1: Ratios of companies for December 2017
Maxis Bhd DiGi telecommunication Celcom Malaysia Bhd.
Current ratio 0.57 0.83 0.65
Gross profit 66.2 76.1 81.3
5
⊘ This is a preview!⊘
Do you want full access?
Subscribe today to unlock all pages.
Trusted by 1+ million students worldwide
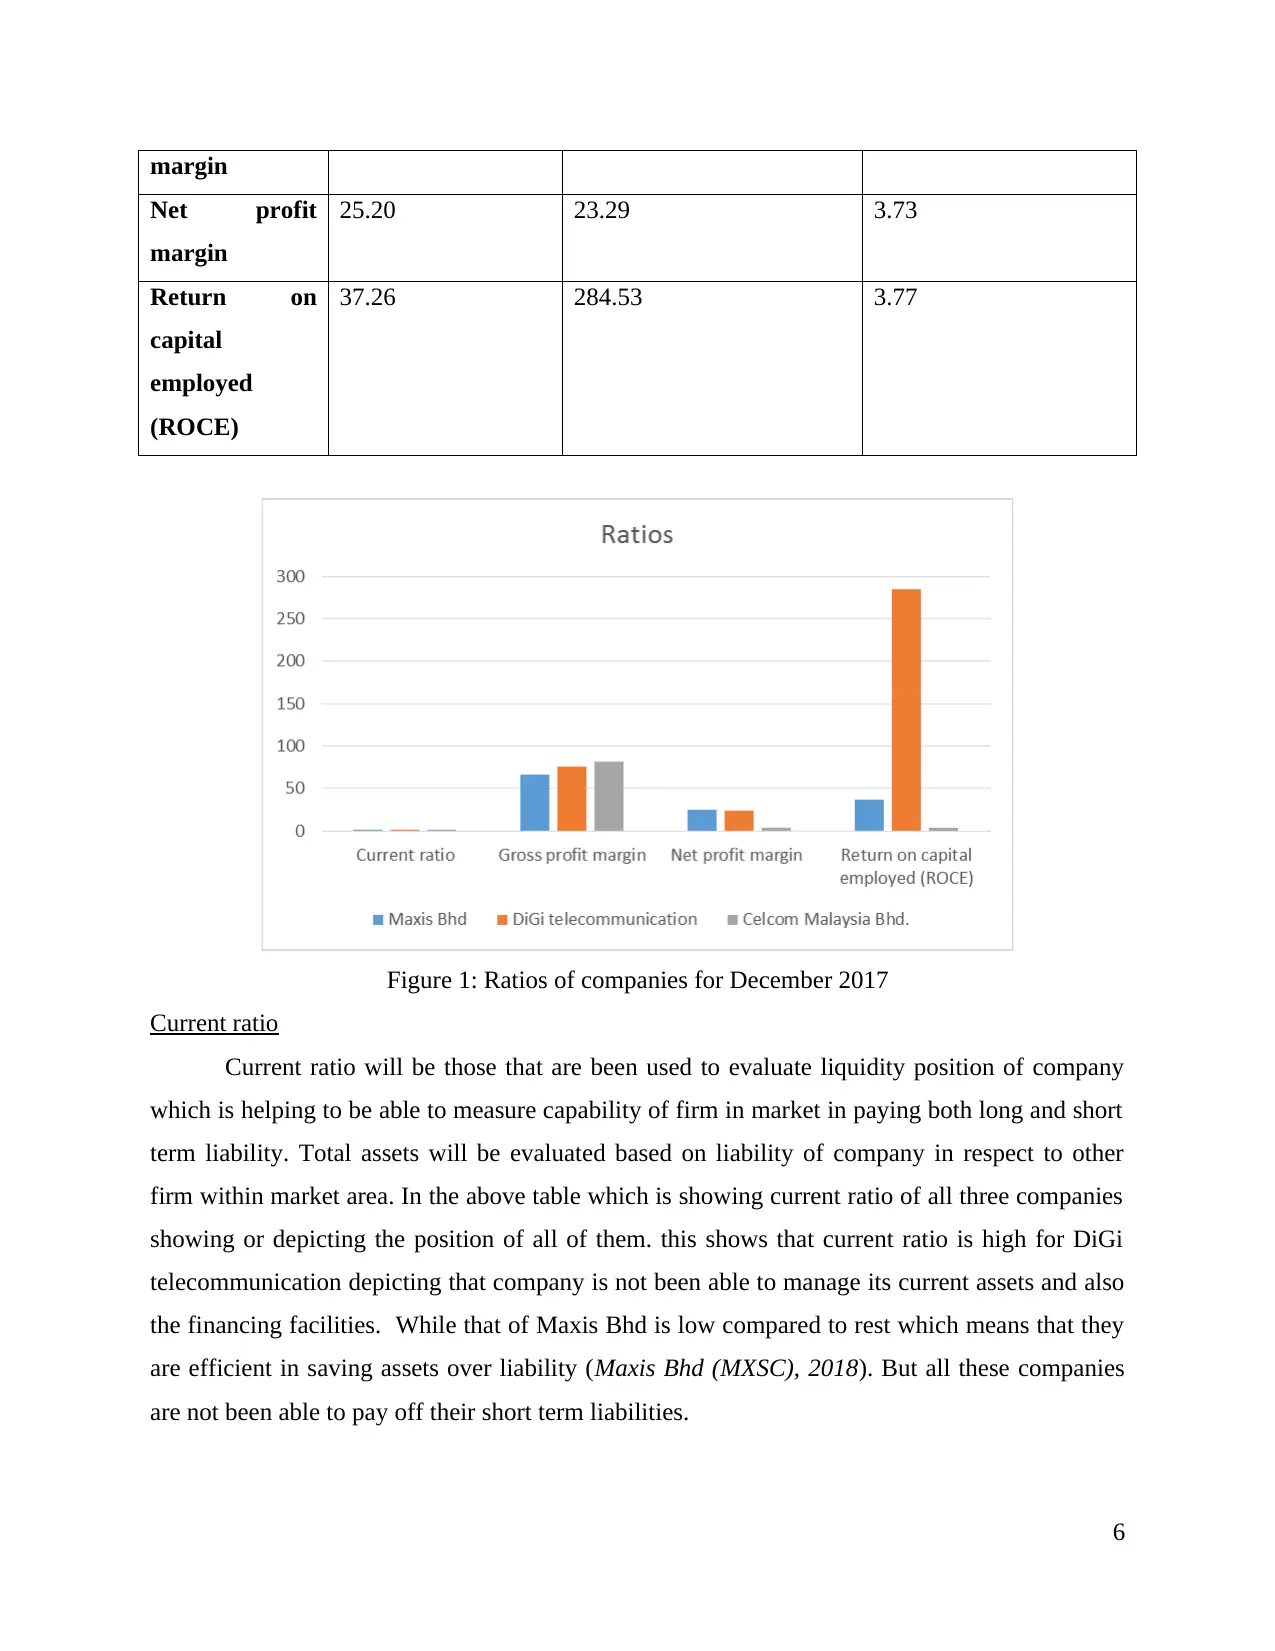
margin
Net profit
margin
25.20 23.29 3.73
Return on
capital
employed
(ROCE)
37.26 284.53 3.77
Figure 1: Ratios of companies for December 2017
Current ratio
Current ratio will be those that are been used to evaluate liquidity position of company
which is helping to be able to measure capability of firm in market in paying both long and short
term liability. Total assets will be evaluated based on liability of company in respect to other
firm within market area. In the above table which is showing current ratio of all three companies
showing or depicting the position of all of them. this shows that current ratio is high for DiGi
telecommunication depicting that company is not been able to manage its current assets and also
the financing facilities. While that of Maxis Bhd is low compared to rest which means that they
are efficient in saving assets over liability (Maxis Bhd (MXSC), 2018). But all these companies
are not been able to pay off their short term liabilities.
6
Paraphrase This Document
Need a fresh take? Get an instant paraphrase of this document with our AI Paraphraser
Gross profit margin
This ratio will be showing the financial health of company in order to reveal which
amount would be left after all accounting of COGS. Gross profit margin ratio will also showing
how efficiently company is distributing and manufacturing products and services. The above
table which is including GP margin ratio of all three companies shows that who is able to
perform better than that of other (Carfì, 2017). So Celcom Malaysia is having better than all
others which are about 81.3 this will be showing that it is performing well than other 2. While
Maxis Bhd is having GP ratio of about 66.2 presenting that it is lowest in terms of performance
and health of company. Lower margin will be depicting that company is under-pricing of their
shares into market and not been able to perform good enough.
Net profit margin
This will be telling what actual profit is of after taking out all taxes, cost which is related
to production, financing and administration so that income could be evaluated. This will be
revealing that what is the amount of profits after taking out other expenses from total amount of
goods sold. As the net profit will be equating with gross which is then subtracted by all
allowance of sales. In the above table which is showing net profit of all three companies which
present that Maxis Bhd is having highest among all three. This will be meaning that Maxis Bhd
is having good profits which are left after taking out all taxes and expenses as well. Further that
of Celcom telecommunication is lowest identifying that they are not having good amount of
profits which are left after taking out taxes and expenses so they must be lowering down their
expenses.
Return on capital employed (ROCE)
On what amount or level capital of firm is been employed in such a way that is could be
easy for firm to measure their profitability and efficiency. Return on capital employed will also
be comparing two or more firm in same industry in terms of their efficiency of employing capital
and how much return would be yielded by it. All three companies which are been compared in
above table would be showing ROCE of them DiGi telecommunication is having the highest
amount of capital employed which is about 284.53 (Digi.com Bhd 694, 2018). While that of
Celcom Malaysia is having lowest which is about 3.77 which is very much low as compared to
other. Celcom should be increasing their profitability and efficiency by using many modern and
innovative methods and techniques.
7
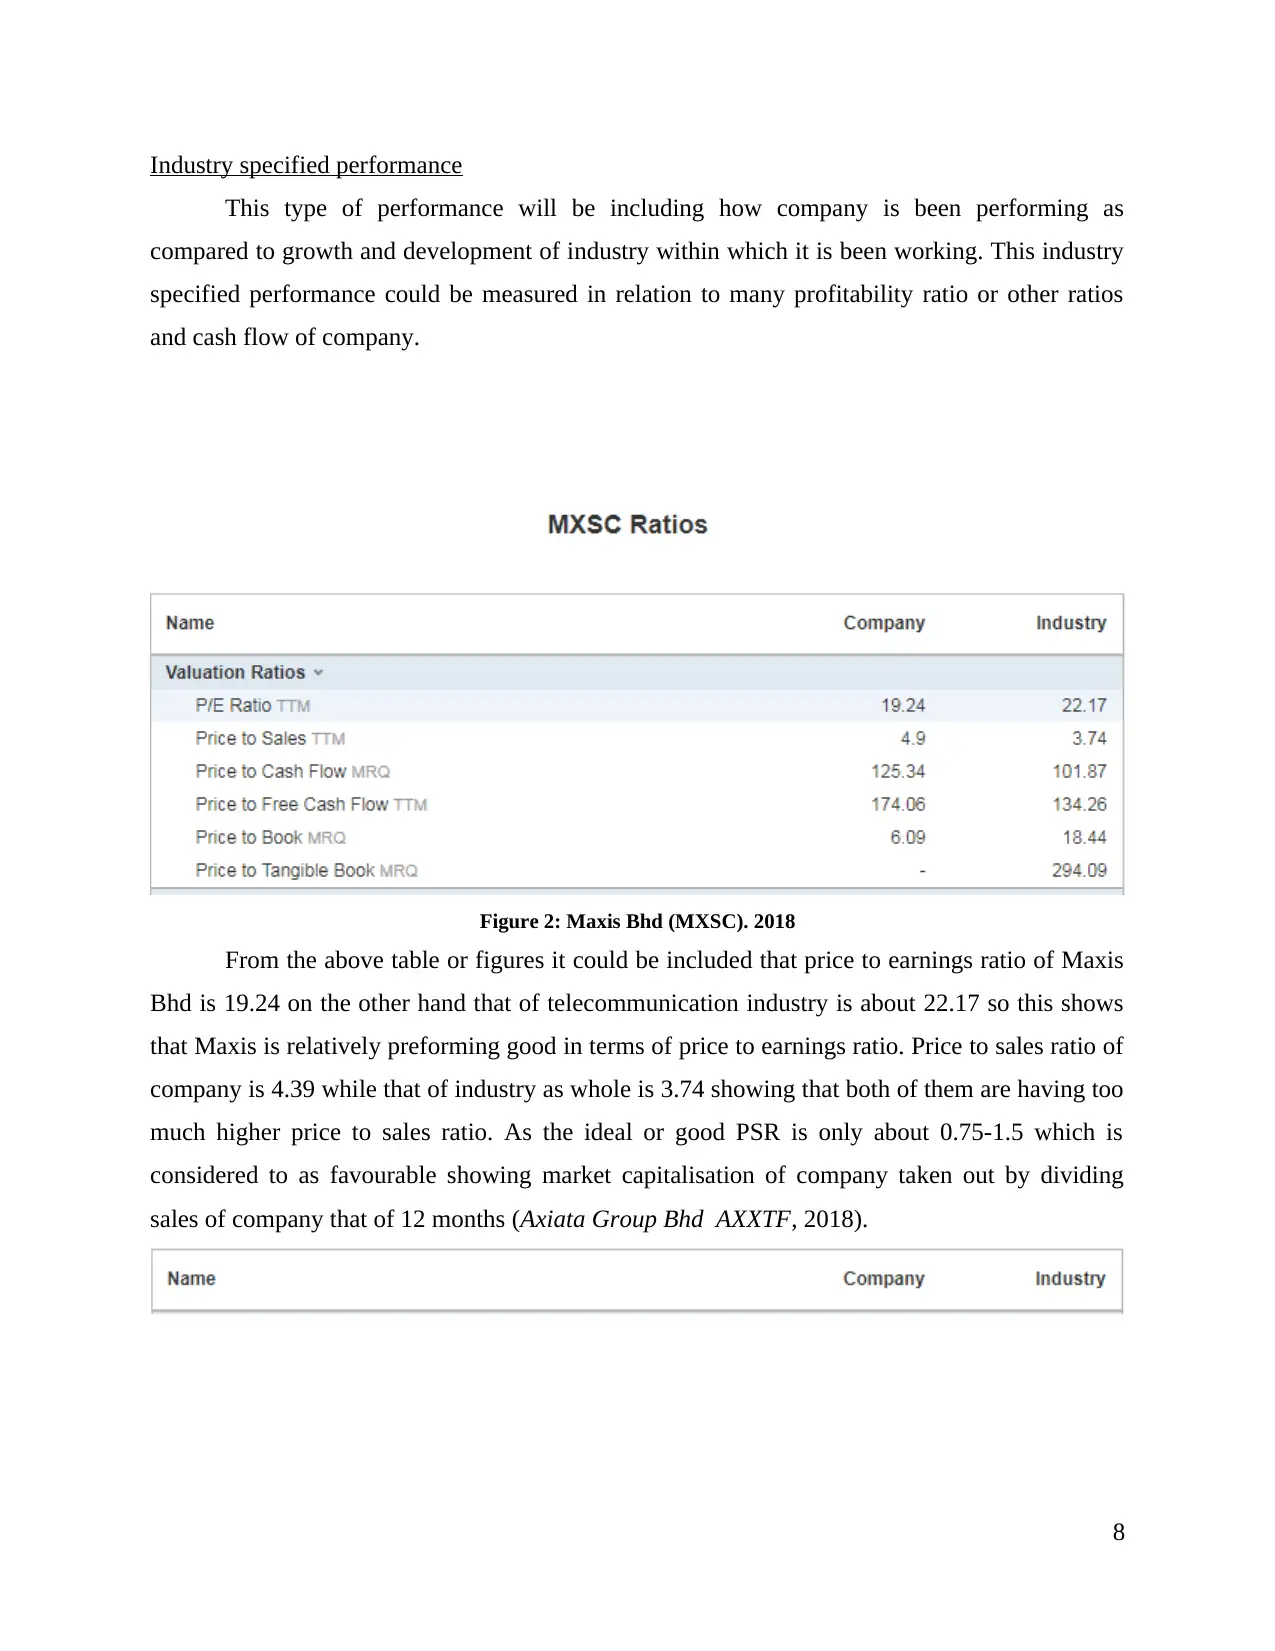
Industry specified performance
This type of performance will be including how company is been performing as
compared to growth and development of industry within which it is been working. This industry
specified performance could be measured in relation to many profitability ratio or other ratios
and cash flow of company.
Figure 2: Maxis Bhd (MXSC). 2018
From the above table or figures it could be included that price to earnings ratio of Maxis
Bhd is 19.24 on the other hand that of telecommunication industry is about 22.17 so this shows
that Maxis is relatively preforming good in terms of price to earnings ratio. Price to sales ratio of
company is 4.39 while that of industry as whole is 3.74 showing that both of them are having too
much higher price to sales ratio. As the ideal or good PSR is only about 0.75-1.5 which is
considered to as favourable showing market capitalisation of company taken out by dividing
sales of company that of 12 months (Axiata Group Bhd AXXTF, 2018).
8
⊘ This is a preview!⊘
Do you want full access?
Subscribe today to unlock all pages.
Trusted by 1+ million students worldwide
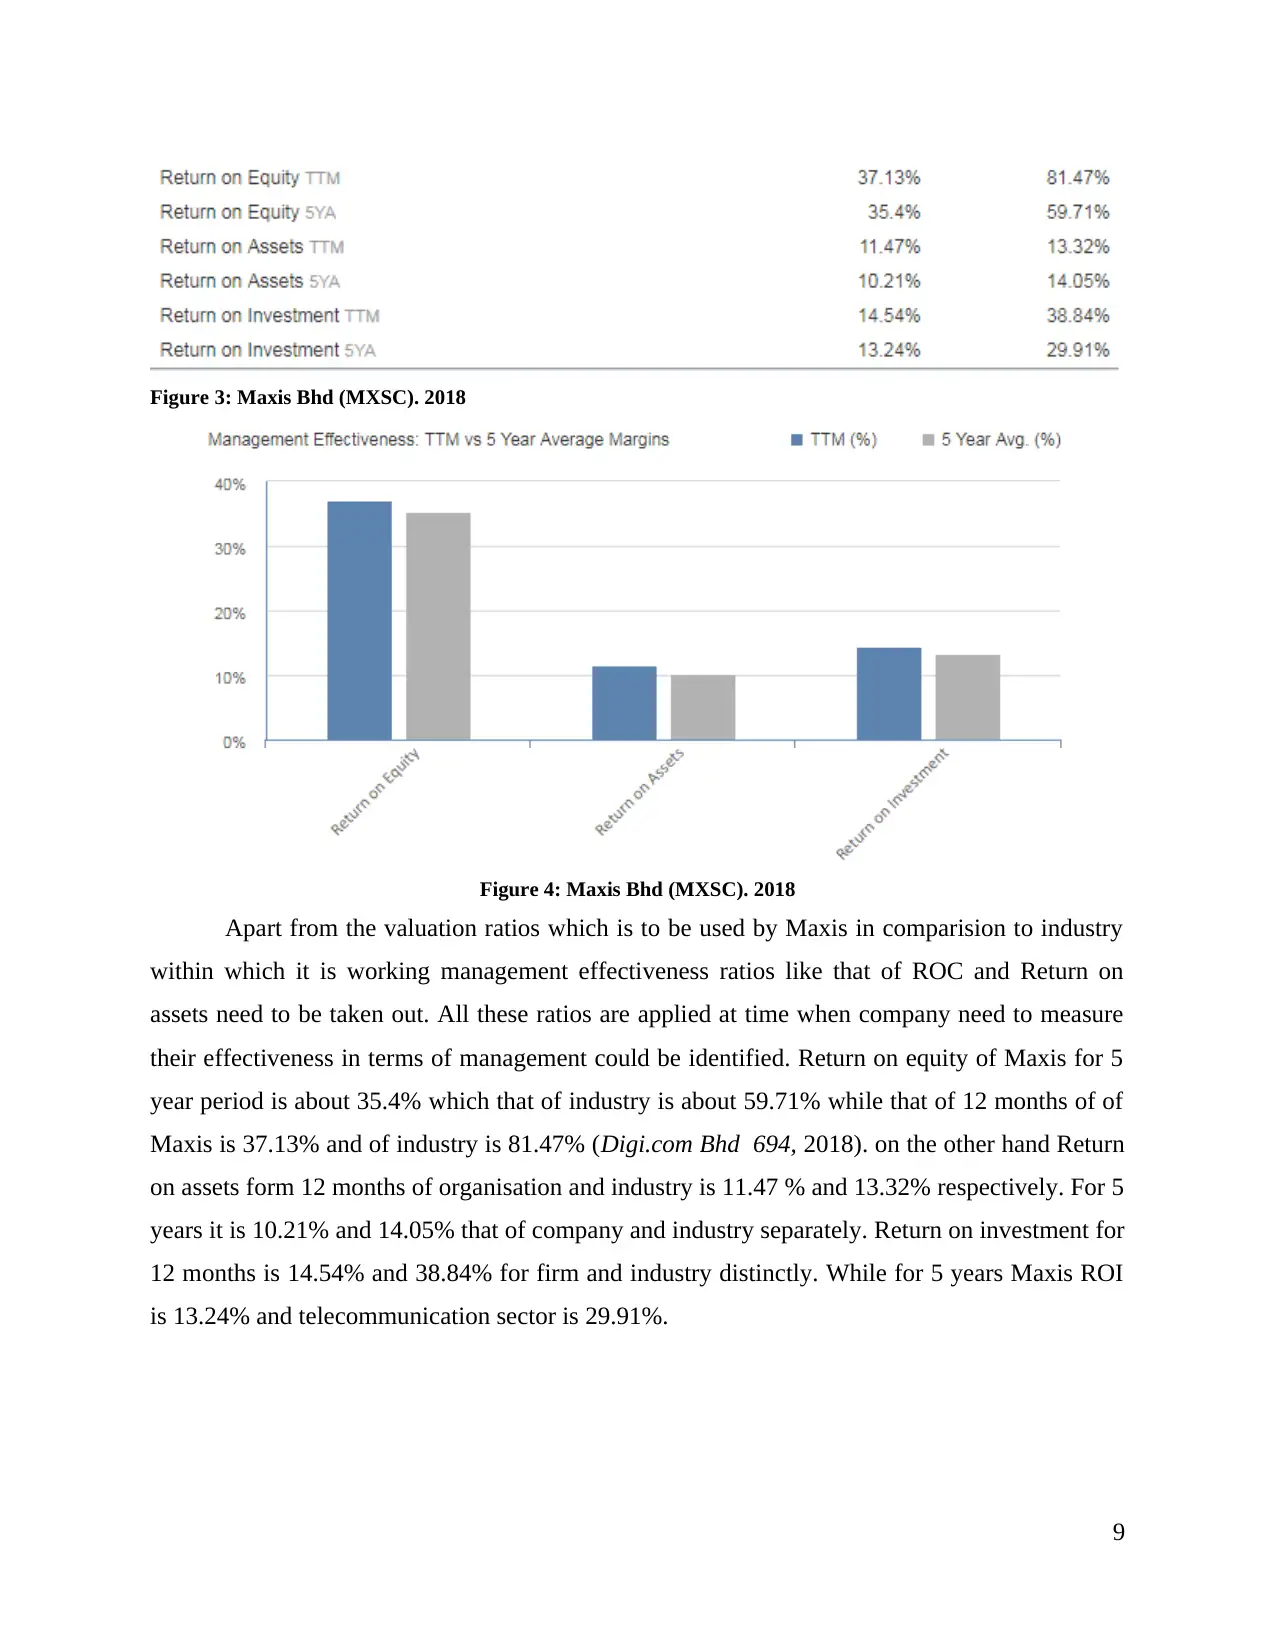
Figure 3: Maxis Bhd (MXSC). 2018
Figure 4: Maxis Bhd (MXSC). 2018
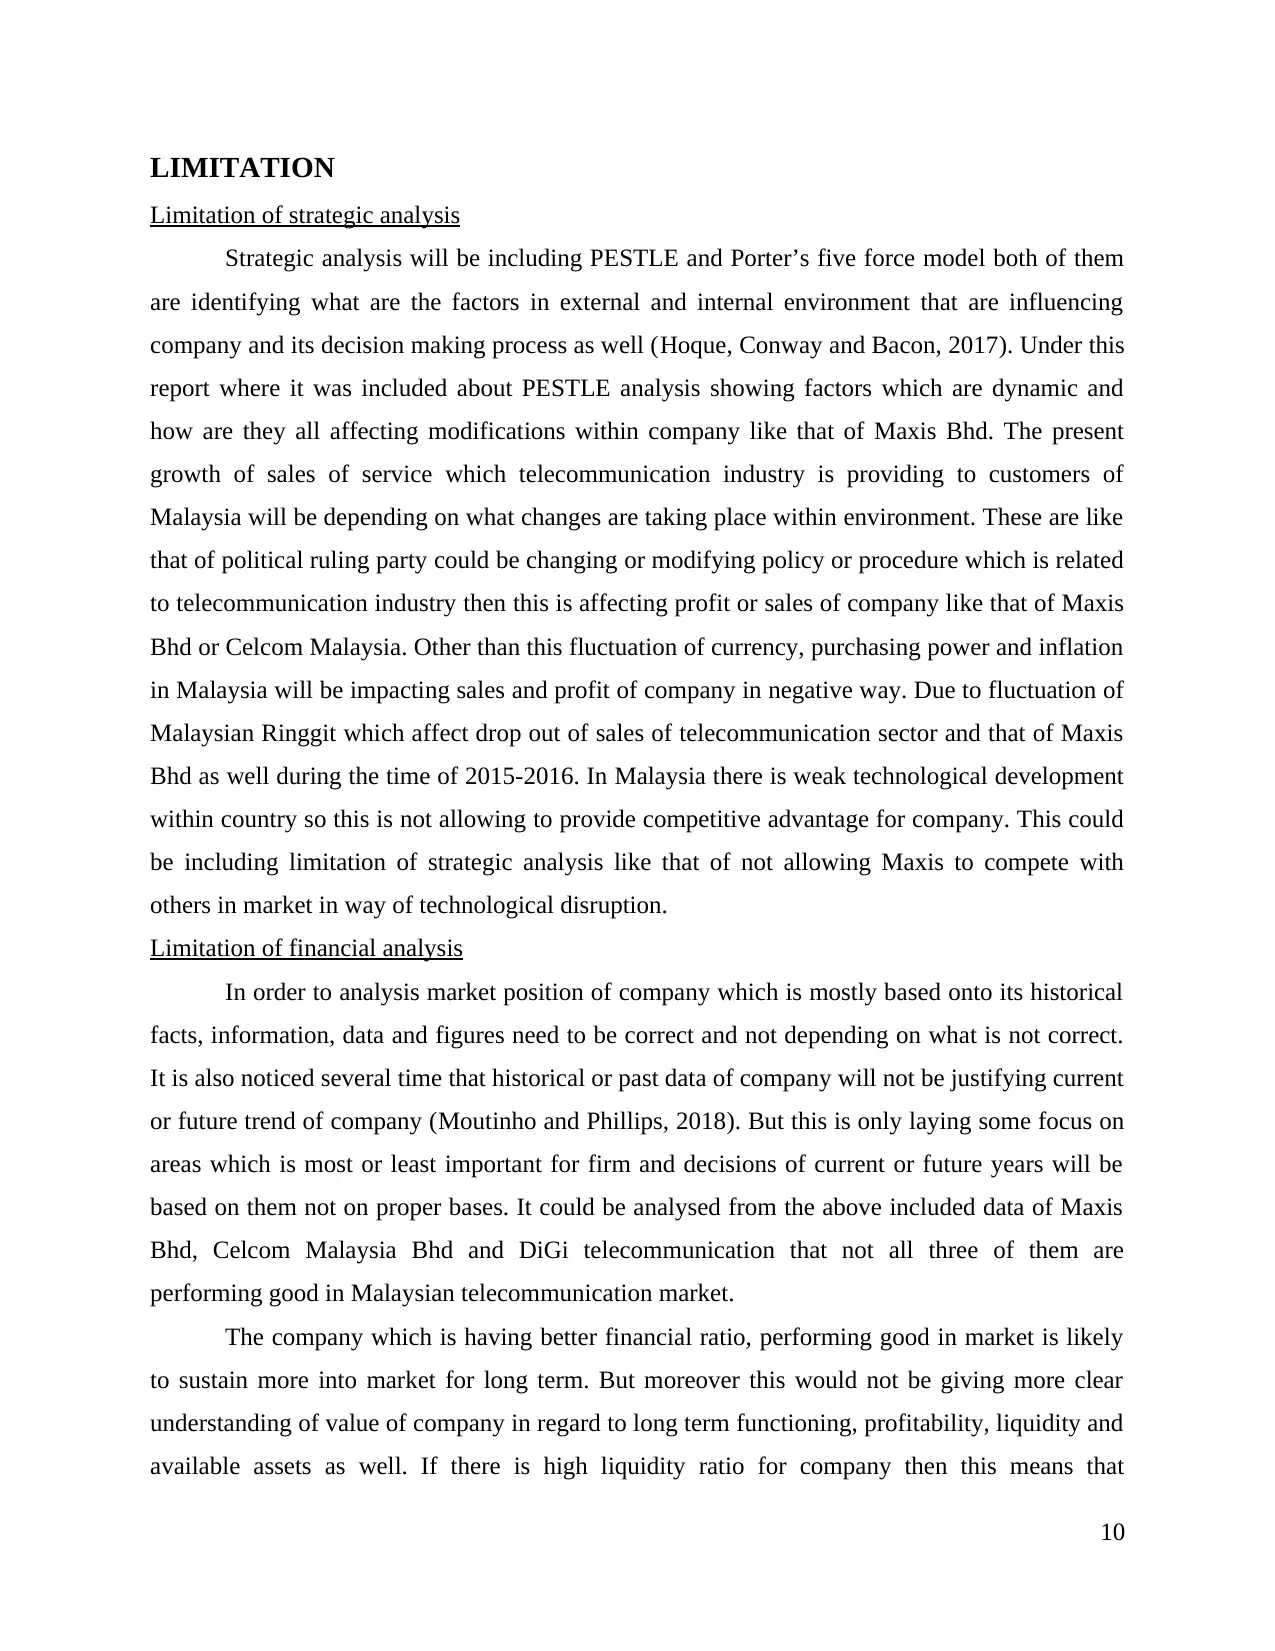
Apart from the valuation ratios which is to be used by Maxis in comparision to industry
within which it is working management effectiveness ratios like that of ROC and Return on
assets need to be taken out. All these ratios are applied at time when company need to measure
their effectiveness in terms of management could be identified. Return on equity of Maxis for 5
year period is about 35.4% which that of industry is about 59.71% while that of 12 months of of
Maxis is 37.13% and of industry is 81.47% (Digi.com Bhd 694, 2018). on the other hand Return
on assets form 12 months of organisation and industry is 11.47 % and 13.32% respectively. For 5
years it is 10.21% and 14.05% that of company and industry separately. Return on investment for
12 months is 14.54% and 38.84% for firm and industry distinctly. While for 5 years Maxis ROI
is 13.24% and telecommunication sector is 29.91%.
9
Figure 4: Maxis Bhd (MXSC). 2018
Apart from the valuation ratios which is to be used by Maxis in comparision to industry
within which it is working management effectiveness ratios like that of ROC and Return on
assets need to be taken out. All these ratios are applied at time when company need to measure
their effectiveness in terms of management could be identified. Return on equity of Maxis for 5
year period is about 35.4% which that of industry is about 59.71% while that of 12 months of of
Maxis is 37.13% and of industry is 81.47% (Digi.com Bhd 694, 2018). on the other hand Return
on assets form 12 months of organisation and industry is 11.47 % and 13.32% respectively. For 5
years it is 10.21% and 14.05% that of company and industry separately. Return on investment for
12 months is 14.54% and 38.84% for firm and industry distinctly. While for 5 years Maxis ROI
is 13.24% and telecommunication sector is 29.91%.
9
Paraphrase This Document
Need a fresh take? Get an instant paraphrase of this document with our AI Paraphraser
LIMITATION
Limitation of strategic analysis
Strategic analysis will be including PESTLE and Porter’s five force model both of them
are identifying what are the factors in external and internal environment that are influencing
company and its decision making process as well (Hoque, Conway and Bacon, 2017). Under this
report where it was included about PESTLE analysis showing factors which are dynamic and
how are they all affecting modifications within company like that of Maxis Bhd. The present
growth of sales of service which telecommunication industry is providing to customers of
Malaysia will be depending on what changes are taking place within environment. These are like
that of political ruling party could be changing or modifying policy or procedure which is related
to telecommunication industry then this is affecting profit or sales of company like that of Maxis
Bhd or Celcom Malaysia. Other than this fluctuation of currency, purchasing power and inflation
in Malaysia will be impacting sales and profit of company in negative way. Due to fluctuation of
Malaysian Ringgit which affect drop out of sales of telecommunication sector and that of Maxis
Bhd as well during the time of 2015-2016. In Malaysia there is weak technological development
within country so this is not allowing to provide competitive advantage for company. This could
be including limitation of strategic analysis like that of not allowing Maxis to compete with
others in market in way of technological disruption.
Limitation of financial analysis
In order to analysis market position of company which is mostly based onto its historical
facts, information, data and figures need to be correct and not depending on what is not correct.
It is also noticed several time that historical or past data of company will not be justifying current
or future trend of company (Moutinho and Phillips, 2018). But this is only laying some focus on
areas which is most or least important for firm and decisions of current or future years will be
based on them not on proper bases. It could be analysed from the above included data of Maxis
Bhd, Celcom Malaysia Bhd and DiGi telecommunication that not all three of them are
performing good in Malaysian telecommunication market.
The company which is having better financial ratio, performing good in market is likely
to sustain more into market for long term. But moreover this would not be giving more clear
understanding of value of company in regard to long term functioning, profitability, liquidity and
available assets as well. If there is high liquidity ratio for company then this means that
10
management is been able to perform obligations related to cash or meeting out cash requirement
as well. So the current ratio of Maxis is ideal and good as compared to other companies which
includes that it is having much higher reserves of cash which are all important for them to pay
off their debts (Kaffash and Marra, 2017). Net profits ratio which is representing the actual
profits of Maxis after taking out all kind of expenses and taxes which they need mandatory.
CONCLUSION
All the ratios and growth or profitability of Maxis Bhd shows that company is heading
towards development and they are also having good marketability into industry. Maxis Bhd is
having key issues that would be affecting their profitability, sales and growth of firm with given
opportunities as well. The external environment analysis which is indicating rising cost of living
and poor economic situation affecting buying power of customers. There is also higher level of
competition within market there is also competition in respect to price of products and service
which they are providing to their customers. Into the recent survey it could be included that
Maxis Bhd is dropping out in quality and service to customer which is one of the main reason of
company not been able to perform good over latest years.
RECOMMENDATION
Apart from all conclusions which are made there are also some recommendations which
company should be keeping in mind so that they could be able to grow into market. in order to
evaluateb suitablity and acceptablity of company within market they could be using Hybrid
strategy showen in Bowman Strategy Clock. Thus this hybrid strategy will be able to balance all
need for low price in order to give money and allowing Maxis Bhd to offer differentiation with
use of innovations.
11
⊘ This is a preview!⊘
Do you want full access?
Subscribe today to unlock all pages.
Trusted by 1+ million students worldwide
1 out of 13
Related Documents


Your All-in-One AI-Powered Toolkit for Academic Success.
+13062052269
info@desklib.com
Available 24*7 on WhatsApp / Email
![[object Object]](/_next/static/media/star-bottom.7253800d.svg)
Unlock your academic potential
Copyright © 2020–2026 A2Z Services. All Rights Reserved. Developed and managed by ZUCOL.