Comparative Financial Ratio Analysis of MAXIS and DIGI
VerifiedAdded on 2021/07/20
|16
|6264
|63
Report
AI Summary
This report presents a comprehensive financial ratio analysis comparing MAXIS and DIGI companies from 2014 to 2018. The analysis covers key financial areas including liquidity, asset management, profitability, and debt ratios. The liquidity section examines operating cycles, working capital, current ratios, quick ratios, and cash ratios, highlighting the firms' abilities to meet short-term obligations. Asset management is assessed through accounts receivable turnover, inventory turnover, and total asset turnover, revealing how efficiently each company utilizes its assets. Profitability is evaluated using gross profit margin, operating profit margin, net profit margin, and return ratios, providing insights into the companies' earning capabilities. Debt ratios, such as total debt ratio and debt-to-equity ratio, are analyzed to assess the companies' financial leverage and risk. The report highlights the financial strengths and weaknesses of both companies over the five-year period, providing a comparative view of their performance and financial health, and a comparison between MAXIS and DIGI in terms of their financial performance.
MAXIS and DIGI company ratio analysis
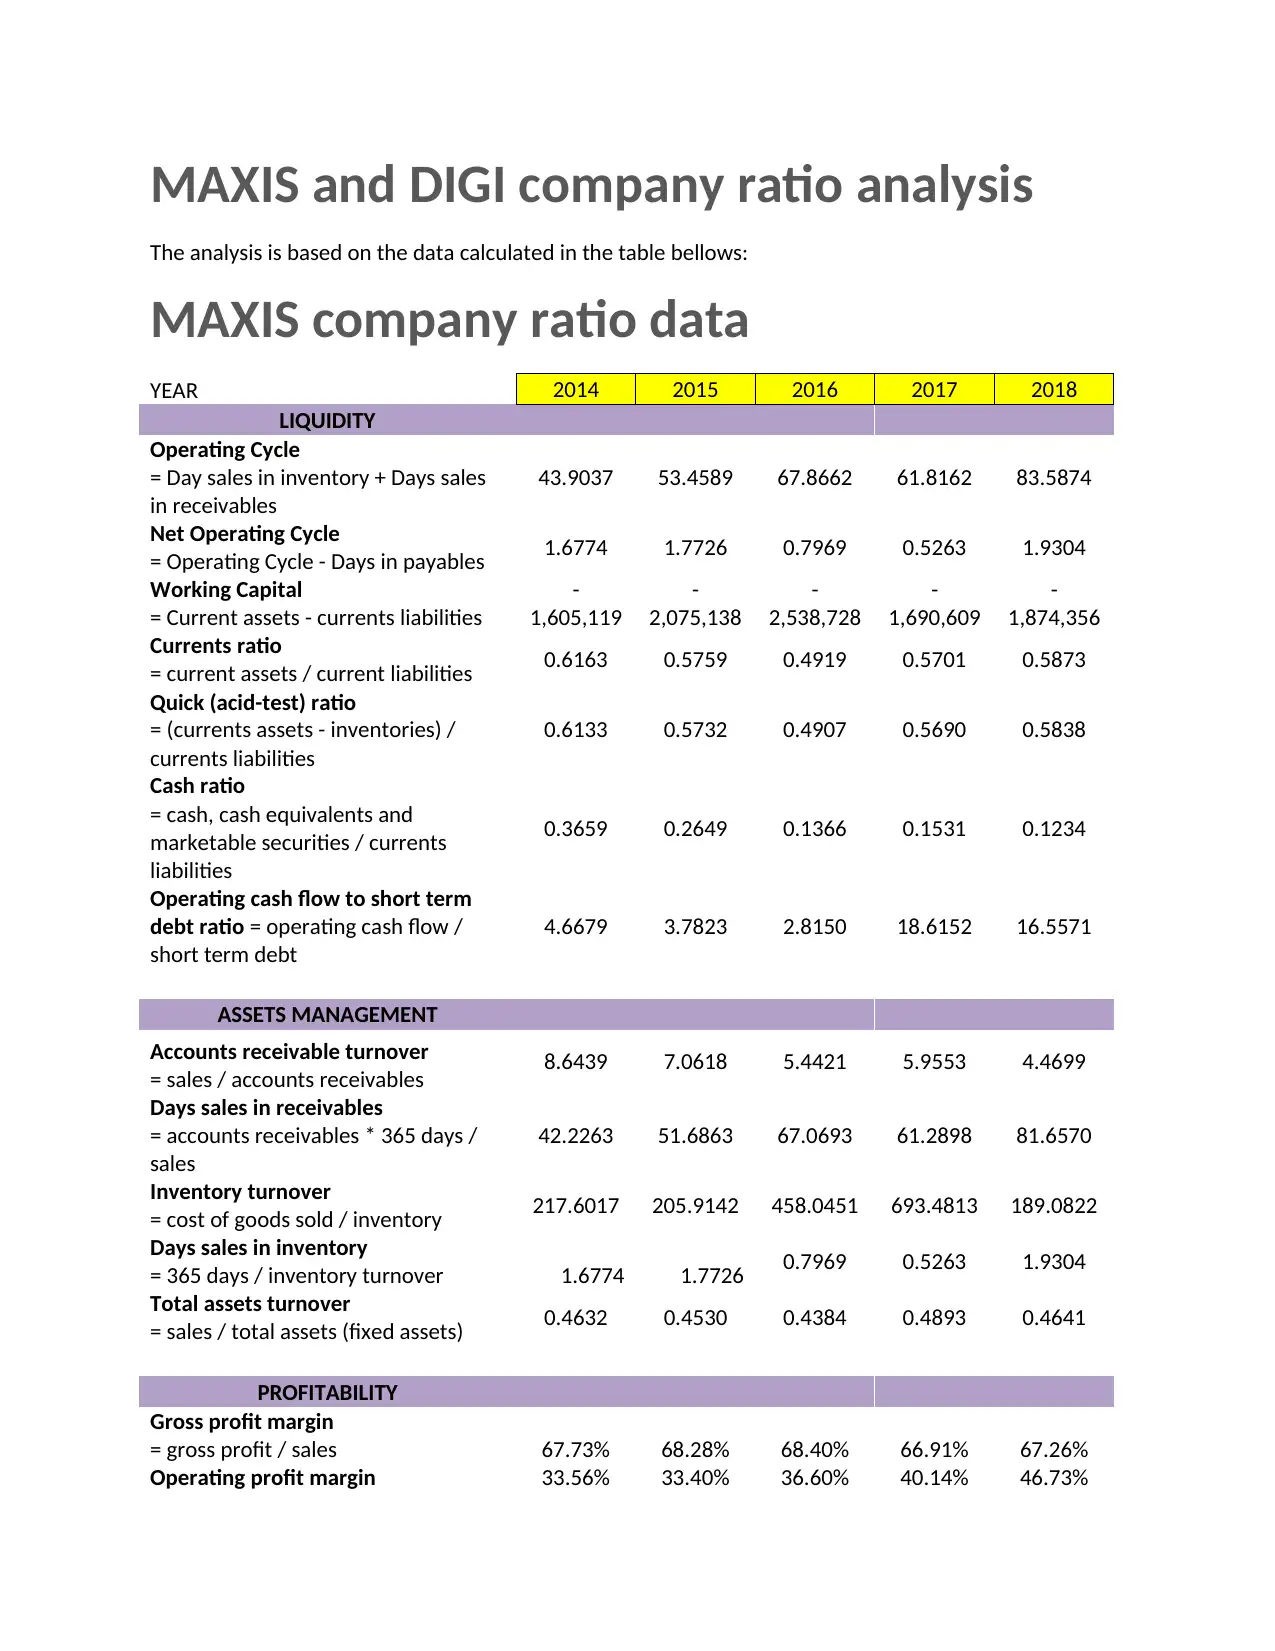
The analysis is based on the data calculated in the table bellows:
MAXIS company ratio data
YEAR 2014 2015 2016 2017 2018
LIQUIDITY
Operating Cycle
= Day sales in inventory + Days sales
in receivables
43.9037 53.4589 67.8662 61.8162 83.5874
Net Operating Cycle
= Operating Cycle - Days in payables 1.6774 1.7726 0.7969 0.5263 1.9304
Working Capital
= Current assets - currents liabilities
-
1,605,119
-
2,075,138
-
2,538,728
-
1,690,609
-
1,874,356
Currents ratio
= current assets / current liabilities 0.6163 0.5759 0.4919 0.5701 0.5873
Quick (acid-test) ratio
= (currents assets - inventories) /
currents liabilities
0.6133 0.5732 0.4907 0.5690 0.5838
Cash ratio
= cash, cash equivalents and
marketable securities / currents
liabilities
0.3659 0.2649 0.1366 0.1531 0.1234
Operating cash flow to short term
debt ratio = operating cash flow /
short term debt
4.6679 3.7823 2.8150 18.6152 16.5571
ASSETS MANAGEMENT
Accounts receivable turnover
= sales / accounts receivables 8.6439 7.0618 5.4421 5.9553 4.4699
Days sales in receivables
= accounts receivables * 365 days /
sales
42.2263 51.6863 67.0693 61.2898 81.6570
Inventory turnover
= cost of goods sold / inventory 217.6017 205.9142 458.0451 693.4813 189.0822
Days sales in inventory
= 365 days / inventory turnover 1.6774 1.7726 0.7969 0.5263 1.9304
Total assets turnover
= sales / total assets (fixed assets) 0.4632 0.4530 0.4384 0.4893 0.4641
PROFITABILITY
Gross profit margin
= gross profit / sales 67.73% 68.28% 68.40% 66.91% 67.26%
Operating profit margin 33.56% 33.40% 36.60% 40.14% 46.73%
Paraphrase This Document
Need a fresh take? Get an instant paraphrase of this document with our AI Paraphraser
= operating profit before tax / sales
Net profit margin
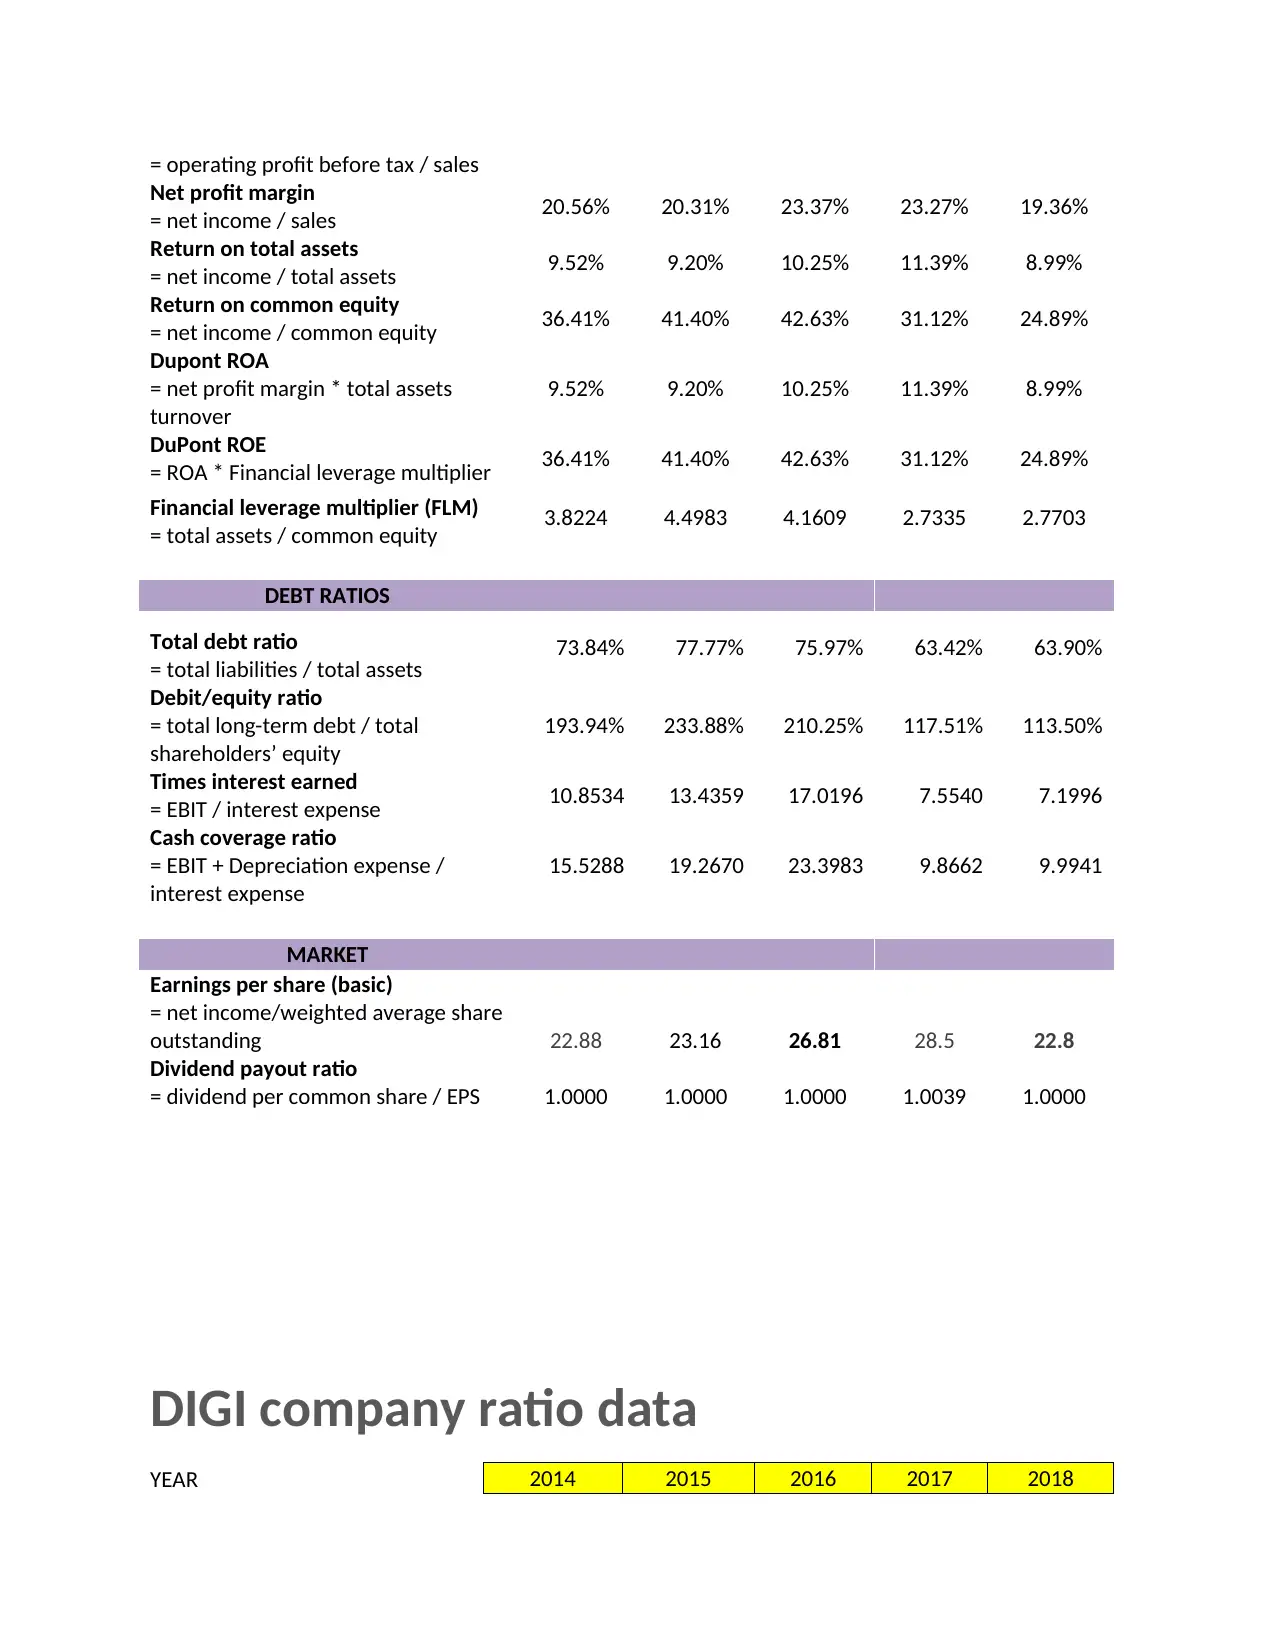
= net income / sales 20.56% 20.31% 23.37% 23.27% 19.36%
Return on total assets
= net income / total assets 9.52% 9.20% 10.25% 11.39% 8.99%
Return on common equity
= net income / common equity 36.41% 41.40% 42.63% 31.12% 24.89%
Dupont ROA
= net profit margin * total assets
turnover
9.52% 9.20% 10.25% 11.39% 8.99%
DuPont ROE
= ROA * Financial leverage multiplier 36.41% 41.40% 42.63% 31.12% 24.89%
Financial leverage multiplier (FLM)
= total assets / common equity 3.8224 4.4983 4.1609 2.7335 2.7703
DEBT RATIOS
Total debt ratio
= total liabilities / total assets 73.84% 77.77% 75.97% 63.42% 63.90%
Debit/equity ratio
= total long-term debt / total
shareholders’ equity
193.94% 233.88% 210.25% 117.51% 113.50%
Times interest earned
= EBIT / interest expense 10.8534 13.4359 17.0196 7.5540 7.1996
Cash coverage ratio
= EBIT + Depreciation expense /
interest expense
15.5288 19.2670 23.3983 9.8662 9.9941
MARKET
Earnings per share (basic)
= net income/weighted average share
outstanding 22.88 23.16 26.81 28.5 22.8
Dividend payout ratio
= dividend per common share / EPS 1.0000 1.0000 1.0000 1.0039 1.0000
DIGI company ratio data
YEAR 2014 2015 2016 2017 2018
Net profit margin
= net income / sales 20.56% 20.31% 23.37% 23.27% 19.36%
Return on total assets
= net income / total assets 9.52% 9.20% 10.25% 11.39% 8.99%
Return on common equity
= net income / common equity 36.41% 41.40% 42.63% 31.12% 24.89%
Dupont ROA
= net profit margin * total assets
turnover
9.52% 9.20% 10.25% 11.39% 8.99%
DuPont ROE
= ROA * Financial leverage multiplier 36.41% 41.40% 42.63% 31.12% 24.89%
Financial leverage multiplier (FLM)
= total assets / common equity 3.8224 4.4983 4.1609 2.7335 2.7703
DEBT RATIOS
Total debt ratio
= total liabilities / total assets 73.84% 77.77% 75.97% 63.42% 63.90%
Debit/equity ratio
= total long-term debt / total
shareholders’ equity
193.94% 233.88% 210.25% 117.51% 113.50%
Times interest earned
= EBIT / interest expense 10.8534 13.4359 17.0196 7.5540 7.1996
Cash coverage ratio
= EBIT + Depreciation expense /
interest expense
15.5288 19.2670 23.3983 9.8662 9.9941
MARKET
Earnings per share (basic)
= net income/weighted average share
outstanding 22.88 23.16 26.81 28.5 22.8
Dividend payout ratio
= dividend per common share / EPS 1.0000 1.0000 1.0000 1.0039 1.0000
DIGI company ratio data
YEAR 2014 2015 2016 2017 2018
LIQUIDITY
Operating Cycle
= Day sales in inventory + Days
sales in receivables
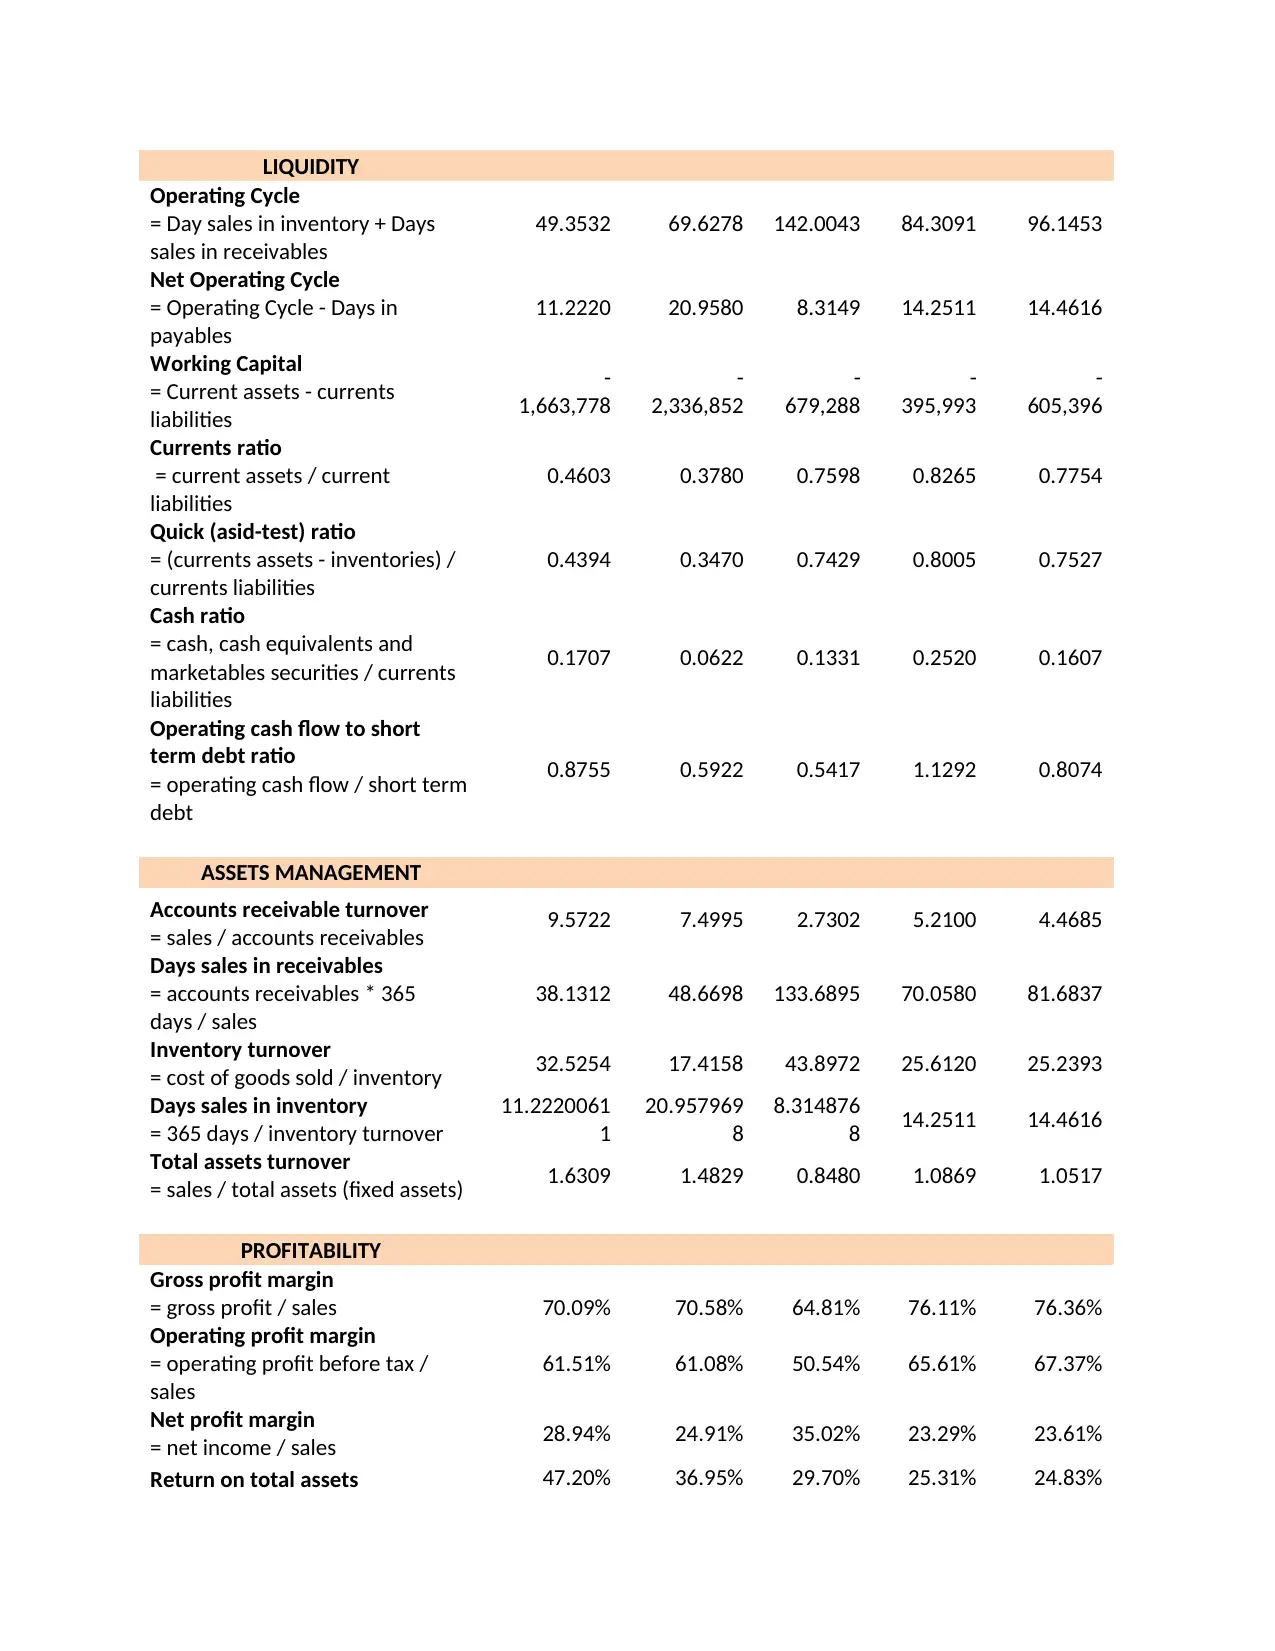
49.3532 69.6278 142.0043 84.3091 96.1453
Net Operating Cycle
= Operating Cycle - Days in
payables
11.2220 20.9580 8.3149 14.2511 14.4616
Working Capital
= Current assets - currents
liabilities
-
1,663,778
-
2,336,852
-
679,288
-
395,993
-
605,396
Currents ratio
= current assets / current
liabilities
0.4603 0.3780 0.7598 0.8265 0.7754
Quick (asid-test) ratio
= (currents assets - inventories) /
currents liabilities
0.4394 0.3470 0.7429 0.8005 0.7527
Cash ratio
= cash, cash equivalents and
marketables securities / currents
liabilities
0.1707 0.0622 0.1331 0.2520 0.1607
Operating cash flow to short
term debt ratio
= operating cash flow / short term
debt
0.8755 0.5922 0.5417 1.1292 0.8074
ASSETS MANAGEMENT
Accounts receivable turnover
= sales / accounts receivables 9.5722 7.4995 2.7302 5.2100 4.4685
Days sales in receivables
= accounts receivables * 365
days / sales
38.1312 48.6698 133.6895 70.0580 81.6837
Inventory turnover
= cost of goods sold / inventory 32.5254 17.4158 43.8972 25.6120 25.2393
Days sales in inventory
= 365 days / inventory turnover
11.2220061
1
20.957969
8
8.314876
8 14.2511 14.4616
Total assets turnover
= sales / total assets (fixed assets) 1.6309 1.4829 0.8480 1.0869 1.0517
PROFITABILITY
Gross profit margin
= gross profit / sales 70.09% 70.58% 64.81% 76.11% 76.36%
Operating profit margin
= operating profit before tax /
sales
61.51% 61.08% 50.54% 65.61% 67.37%
Net profit margin
= net income / sales 28.94% 24.91% 35.02% 23.29% 23.61%
Return on total assets 47.20% 36.95% 29.70% 25.31% 24.83%
Operating Cycle
= Day sales in inventory + Days
sales in receivables
49.3532 69.6278 142.0043 84.3091 96.1453
Net Operating Cycle
= Operating Cycle - Days in
payables
11.2220 20.9580 8.3149 14.2511 14.4616
Working Capital
= Current assets - currents
liabilities
-
1,663,778
-
2,336,852
-
679,288
-
395,993
-
605,396
Currents ratio
= current assets / current
liabilities
0.4603 0.3780 0.7598 0.8265 0.7754
Quick (asid-test) ratio
= (currents assets - inventories) /
currents liabilities
0.4394 0.3470 0.7429 0.8005 0.7527
Cash ratio
= cash, cash equivalents and
marketables securities / currents
liabilities
0.1707 0.0622 0.1331 0.2520 0.1607
Operating cash flow to short
term debt ratio
= operating cash flow / short term
debt
0.8755 0.5922 0.5417 1.1292 0.8074
ASSETS MANAGEMENT
Accounts receivable turnover
= sales / accounts receivables 9.5722 7.4995 2.7302 5.2100 4.4685
Days sales in receivables
= accounts receivables * 365
days / sales
38.1312 48.6698 133.6895 70.0580 81.6837
Inventory turnover
= cost of goods sold / inventory 32.5254 17.4158 43.8972 25.6120 25.2393
Days sales in inventory
= 365 days / inventory turnover
11.2220061
1
20.957969
8
8.314876
8 14.2511 14.4616
Total assets turnover
= sales / total assets (fixed assets) 1.6309 1.4829 0.8480 1.0869 1.0517
PROFITABILITY
Gross profit margin
= gross profit / sales 70.09% 70.58% 64.81% 76.11% 76.36%
Operating profit margin
= operating profit before tax /
sales
61.51% 61.08% 50.54% 65.61% 67.37%
Net profit margin
= net income / sales 28.94% 24.91% 35.02% 23.29% 23.61%
Return on total assets 47.20% 36.95% 29.70% 25.31% 24.83%
⊘ This is a preview!⊘
Do you want full access?
Subscribe today to unlock all pages.
Trusted by 1+ million students worldwide
= net income / total assets
Return on common equity
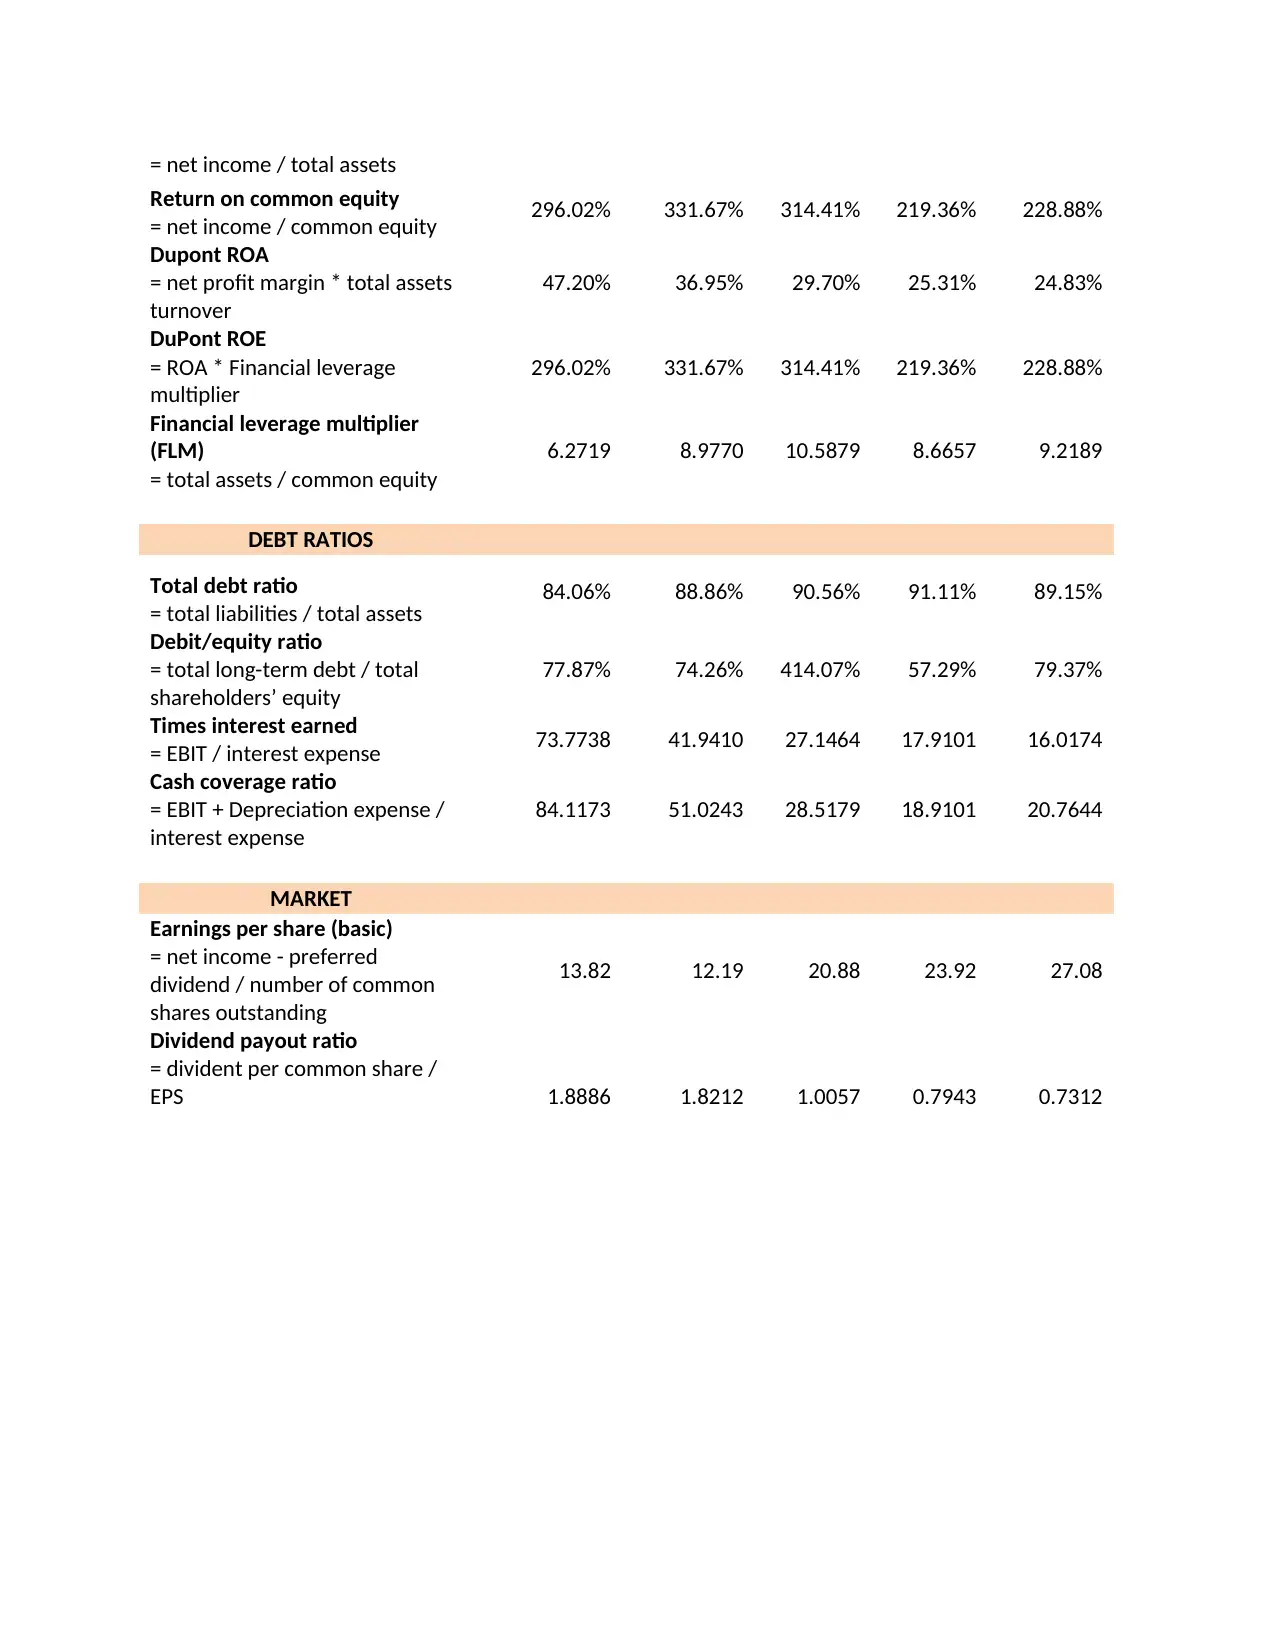
= net income / common equity 296.02% 331.67% 314.41% 219.36% 228.88%
Dupont ROA
= net profit margin * total assets
turnover
47.20% 36.95% 29.70% 25.31% 24.83%
DuPont ROE
= ROA * Financial leverage
multiplier
296.02% 331.67% 314.41% 219.36% 228.88%
Financial leverage multiplier
(FLM)
= total assets / common equity
6.2719 8.9770 10.5879 8.6657 9.2189
DEBT RATIOS
Total debt ratio
= total liabilities / total assets 84.06% 88.86% 90.56% 91.11% 89.15%
Debit/equity ratio
= total long-term debt / total
shareholders’ equity
77.87% 74.26% 414.07% 57.29% 79.37%
Times interest earned
= EBIT / interest expense 73.7738 41.9410 27.1464 17.9101 16.0174
Cash coverage ratio
= EBIT + Depreciation expense /
interest expense
84.1173 51.0243 28.5179 18.9101 20.7644
MARKET
Earnings per share (basic)
= net income - preferred
dividend / number of common
shares outstanding
13.82 12.19 20.88 23.92 27.08
Dividend payout ratio
= divident per common share /
EPS 1.8886 1.8212 1.0057 0.7943 0.7312
Return on common equity
= net income / common equity 296.02% 331.67% 314.41% 219.36% 228.88%
Dupont ROA
= net profit margin * total assets
turnover
47.20% 36.95% 29.70% 25.31% 24.83%
DuPont ROE
= ROA * Financial leverage
multiplier
296.02% 331.67% 314.41% 219.36% 228.88%
Financial leverage multiplier
(FLM)
= total assets / common equity
6.2719 8.9770 10.5879 8.6657 9.2189
DEBT RATIOS
Total debt ratio
= total liabilities / total assets 84.06% 88.86% 90.56% 91.11% 89.15%
Debit/equity ratio
= total long-term debt / total
shareholders’ equity
77.87% 74.26% 414.07% 57.29% 79.37%
Times interest earned
= EBIT / interest expense 73.7738 41.9410 27.1464 17.9101 16.0174
Cash coverage ratio
= EBIT + Depreciation expense /
interest expense
84.1173 51.0243 28.5179 18.9101 20.7644
MARKET
Earnings per share (basic)
= net income - preferred
dividend / number of common
shares outstanding
13.82 12.19 20.88 23.92 27.08
Dividend payout ratio
= divident per common share /
EPS 1.8886 1.8212 1.0057 0.7943 0.7312
Paraphrase This Document
Need a fresh take? Get an instant paraphrase of this document with our AI Paraphraser
Ratio Analysis of MAXIS and DIGI company
The analysis takes into account of data obtained from the calculation of the annual report of MAXIS and
DIGI company start from 2014 to 2018 and focus mainly on the result shows in latest year which is in
2018.
Liquidity ratios
Is to measure the ability of a firm to pay short-term obligations as they fall due and to meet unexpected
needs for cash. There are three common measures of liquidity are working capital,
current ratio and quick (acid-test) ratio. The liquidity ratio focus on the operating activities of the firm
and become an indicator of the firm’s abilities to pay its short-term obligation than profitability. Poor
liquidity position may cause a firm to default in dept payment and can lead to insolvency. From the
company chosen which are Maxis and Digi company, the comparison of liquidity of the two companies is
based ratio computed:
Operating Cycle Ratio
Operating Cycle Ratio it is refers to the time period between the purchases of raw materials or goods
and the receipt of cash from sale of the final products and subsequent collection. The ratio can be
computed as follows:
Operating Cycle = Day sales in inventory + Days sales in receivables
Generally, the data analysis of the Maxis company shows that they are increasing from year to year is
the time required for a company's cash to be put into its operations and then return to the company's
cash account.
Working capital
Working capital is the excess of current assets over current liabilities. Generally, current liabilities will be
paid with the cash generated from current assets. The ratio can be computed as follows:
Working Capital = Current assets - currents liabilities
Based on the data obtained of Maxis and Digi company. The comparison in 2018, Maxis had a positive
working capital in which the current assets were greater than the current liabilities. It did not have any
problems in meeting current obligations as they became due during the year. While the data of DIGI
company show the negative value with meant the current liability is higher than current assets. The DIGI
company might face the problem in meeting current obligations as they became due.
Current ratio
Current ratio is to measures the ability of the firm to pay its short-term financial obligations when they
become due. The ratio can be computed as follows:
Currents ratio = current assets / current liabilities
A frequently applied rules-of-thumb for analyzing current ratio is 2:1 or higher. A lower ratio can
indicate the liquidity risk. A ratio of 2:1 is simply meaning that the firm has RM2 current assets to pay for
every RM1 current Liabilities.
Form the date calculated we can see every year MAXIS and DIGI company has a strong indicator that
there will be liquidity problems in the future. This is because the current ratio is below 1.
In 2018 alone, MAXIS have RM0.5873 in current assets for every RM1 in current liabilities
or we could say that MAXIS had its current liabilities covered 0.5873 times over. While DIGI have
RM0.7754 in current assets for every RM1 which is higher than Maxis. This mean that DIGI company is
more in liquidity in covering the obligations than MAXIS, however the value is still low than 1 and the
company might face the problem in dealing with the company debt though.
Quick (Acid-Test) Ratio
Quick (Acid-Test) Ratio is similar to current ratio but it only takes into account the highly liquid current
assets that can be converted to cash fairly quickly. This ratio excludes inventory due to its least liquid
nature. The ratio can be computed as below:
Quick (acid-test) ratio = (currents assets - inventories) / currents liabilities
A general rule is that companies with the ability to repurchase liabilities require a longer term
each year. Acid-test ratio of MAXIS in 2018 was 0.5838, lower than current ratio due to a large
proportion of inventories in its current assets. Inventories are the least liquid current assets. Applying
the rule-of thumb analysis, MAXIS's acid-test ratio is lower than the cut-off ratio which is lower than 1,
which indicates its lower liquid current assets could cover the current liabilities 0.5838 times over. Same
goes to the DIGI which has a value of 0.7527 which still indicate the lower value to cover the current
liability. Both companies have less liquidity which shows lower rate of the ability of a firm to pay short-
term obligations
⊘ This is a preview!⊘
Do you want full access?
Subscribe today to unlock all pages.
Trusted by 1+ million students worldwide
Cash Ratio
Cash Ratio is the most conservative measure of liquidity is cash ratio, which considers cash, cash
equivalents and marketable securities only relative to current liabilities. This ratio is useful if an analyst
suspects that the firm may have poor quality accounts receivable and inventory or pledged them for
short-term credit. But this ratio may be impractical for most firms because they rarely have sufficient
cash, cash equivalents and marketable securities to cover liabilities. Cash ratio can be computed as
follows:
Cash ratio = cash, cash equivalents and marketable securities / currents liabilities
Need to be noted that ratio of the year below 1 means that a company will not be able to pay off its
current liabilities with cash and cash equivalents, and have funds leftover.
DIGI and MAXIS had insufficient cash coverage for its current liabilities 2014-2018 as evidenced by the
cash ratio less than 1. Its cash, cash equivalents and short-term investments were just enough to cover
its current liabilities.
Operating Cash Flow to Short-term Debt
The liquidity position of a firm can be viewed from its ability to generate cash from its current or
continuing operations to pay short-term debt obligations. A higher operating cash flow to short-term
debt ratio indicates higher liquidity
The operating cash flow of MAXIS shows the higher in cash ratio in every year started from 2014-2018
could cover its short-term debt, which indicated that it had adequate operating cash flow to meet its
short-term debt obligations. Inversely for DIGI, only in 2017 that shows the value of the ratio above 1
which means that in that year only that DIGI can cover its short-term debt obligations for one time.
While the other years, the values are below than 1. It shows the less liquidity of the company in dealing
with their debt payment.
Asset Management or Efficiency Ratios
Asset management or efficiency ratios measure the ability of a firm to convert its assets into sales or
cash. This analysis focuses on the current and fixed assets, inventory, accounts receivable and payable.
Firms invest in fixed assets and in turn use them for productive purposes to generate sales
and ultimately contribute to their profitability.
In addition, the management needs to move out inventory from storage or warehouse as fast as
possible by selling them to generate sales. Holding too much inventory signals a poor inventory
management, which leads to cash tied up in inventories that limits the firm's ability to generate cash
and ultimately affects liquidity adversely. On the other hand, holding too little inventory is also
Paraphrase This Document
Need a fresh take? Get an instant paraphrase of this document with our AI Paraphraser
problematic because firms may not be able to fulfil customers' demand. Thus, in this section some ratio
will be analyze such as account receivable turn over, Days' sales in receivables, Inventory Turnover, days'
Sales in Inventory and Total Assets Turnover
Accounts Receivable Turnover
Accounts receivable turnover ratio is to measures the speed at which a firm collects credit sales from its
customers. It is a good indicator of the quality of accounts receivable and the efficiency of the
collections. Quality refers to the chance of collection without loss. Firms need to collect payments from
their customers as quickly as possible to minimize the uncollected payments. The Account Receivable
Turnover can be calculated by using formula as stated as below:
Accounts receivable turnover = sales / accounts receivables
This ratio indicates how often a firm received and collected its receivables, on average, during duration
in one year. A higher ratio indicates faster collections in a year.
We compute MAXIS and DIGI accounts receivable turnover. As a result,
The number of times that a MAXIS company collects its average accounts receivable are decrease from
year to year, from 8.64 in 2014 to 4.46 in 2018, it is because the sum of acc receivable are increase from
year to year. While DIGI show the fluctuated throughout the years. The ratio decreases from 2014 until
scientifically from 9.57 in 2014 to 2.73 in 2016 and begin to rise back in 2017 and slightly decrease in
2018.
This result shows the unstable in ability of the companies in collecting credit sales from its customers. It
also shows that the companies have an inefficiency in the collections of account receivable.
Days' sales in receivables
Days' sales in receivables or average collection period is the ratio that measure the accounts receivable
turnover in days, which can be compared against the credit terms that the firm extends to its customers.
The compute days' sales in receivables is to determine the number of days it takes on average to collect
accounts receivable based on the year-end balance in accounts receivable. The formula of the ratio as
below:
Days sales in receivables = accounts receivables * 365 days / sales
The result of the calculation shows that the MAXIS take a long time to collect its account receivable in
2014 and begin to get longer during the next year until 2018. The company takes more than 1 month in
order to collect payments form customers and take more than 80 days in 2018 to finish its collections.
while DIGI company also show the result in the same way as it takes about 1 months and more to do its
collection and, in the end of 2018, the company take longer time about 81 days in collecting customers’
payments.
It can be said that both companies show poor result in collecting payment from account receivable. in
the other point of view, it can be said that there is an improvement in acc receivable this company need
more time to collect the company's accounts receivable during it past year
Inventory Turnover
Inventory turnover ratio measures how quickly a firm sells its goods. This ratio shows the relationship
between the volume of goods sold and inventory. In some cases, excessive inventories tie up funds that
can be used to pay bills or invest in other profitable ventures. Inventories is viewed as the least liquid
current assets. The ratio can be computed as follows:
Inventory turnover = cost of goods sold / inventory
The inventory turns over of DIGI company shows the good result of increasing in the ratio value from
year to year. This means that the company have a higher ability to sell entirely goods many times during
the year, 38.1312 times in 2014 to 81.6837 in 2018. Meanwhile, MAXIS result in fluctuated from 2014 to
2017 and decrease significantly in from 693.4813 in 2017 to 189.0822 in 2018. One of the reasons is that
in the year 2017 this company have a lot number of times a company sells and replaces its stock of
goods it is because this year this company make a lot of sale with a little amount on inventory.
However, in this section, MAXIS show higher rate of selling its goods higher than DIGI which is 189.0822
times in 2018 compared to 25.2393 times. This shows that DIGI has a lower rate of sale in the inventory
compared to MAXIS.
Days' Sales in Inventory
Days' sales in inventory are useful in analyzing a firm's purchasing and production policy. This measure
relates the amount of inventory to the average daily cost of goods sold.
We can identify how long a firm takes to use up the inventory through sales. Alternatively, this measure
tells us the average age of inventory. It can be computed as follows:
Days sales in inventory = 365 days / inventory turnover
In the year 2016 and 2017 of MAXIS is the lower number of days the company takes for inventory to
turn into sales. in is because the inventory that year are not more that 10 Million while other year are
more that 10Million so the other year need more time to transfer inventory to sale.
In 2018, the latest year of the analysis data of DIGI company shows that the inventory of the company
takes about 14 to 15 days for the inventory to be turned over. Alternatively, the inventory stays only 15
days on average before it was sold. Compared to MAXIS company which takes only 1 to 2 days for the
inventory to be turned over. Faster than DIGI company. This is because both companies provide goods
mostly in the form of services and digital or intangible product such as internet and etc. that being
⊘ This is a preview!⊘
Do you want full access?
Subscribe today to unlock all pages.
Trusted by 1+ million students worldwide
wisely use in daily basis of the market. Thus, it is normal for this type of company to have a low ratio in
days sale in inventory compared to food or cloth industry which take much longer time.
in this section we can determine the operating cycle of both company by using ratio in previous section
which are the days’ sales in receivables (collection period) and days' sales in inventory,
For MAXIS company the days' sales in inventory in 2018 is 81.6570 and the days’ sales receivables in the
same year is 1.9304. Thus, the operating cycle can be computed as follow:
the operating cycle = days' sales in inventory + days’ sales in receivables
Operating cycle of MAXIS = 81.6570 days + 1.9304 days = 83.58737708 days
While DIGI operating cycle can be computed as follows;
Operating cycle of DIGI = 81.6837 days + 14.4616 days = 96.1453 days
As a conclusion, the MAXIS company takes about 84 days to buy the merchandise from its suppliers and
sell them to customers and collect the cash from them while DIGI takes 97 days to complete the whole
cycle.
Total Assets Turnover
The total assets turnover indicates the efficiency with which a firm utilizes its assets to generate sales .
To be noted that, A higher ratio indicates greater efficiency in using the total or fixed assets to
generate sales, the ratio can be computed as below:
Total assets turnover = sales / total assets (fixed assets)
The ability of the company to generate sale from asset of MAXIS is maintain around 0.4 every year.
In 2018, the MAXIS ratio indicates that in every RM1 in total assets, MAXIS generated RM 0.4641 in sales
while DIGI can be generated RM 1.0517 in sales. The result shows that the DIGI shows the more
efficiency in utilizing its assets to generate sales.
Profitability Ratio
Profitability simply means the ability of a firm to generate earnings for a given level of sales, assets and
owners' investment. Profitability analysis, therefore, focuses on the relationship between operating
results and the resources available to a firm.
profitability is an indicator of their skills, effectiveness, motivation and resourcefulness in mobilizing the
resources of the firm that require them to make operating, investing and financing decisions.
Paraphrase This Document
Need a fresh take? Get an instant paraphrase of this document with our AI Paraphraser
Gross Profit Margin
The gross profit margin measures the percentage of each sales ringgit remaining after paying the cost of
goods in a particular year. A higher gross profit margin indicates lower cost of goods sold.
Gross profit margin = gross profit / sales
From the ratio calculated, MAXIS company shows that companies are able to generate good revenue by
up to 60% of all years after considering the costs involved in producing products and services. While,
DIGI company result in fluctuated result which the data started with slightly above 70% in 2014 dan fall
to 64% in 2016, then start to rise back to 76.36% in 2018.
In 2018, the ratio of 67.26% can tell us that MAXIS can generate 67 Sen in gross profit after
deducting cost of goods sold for every RM1 in sales. Meanwhile, DIGI can generate higher in 76 Sen. It
can be seen clearly that DIGI can generate more gross profit toward their sale.
The operating profit margins
The operating profit margin is a measure of profitability that represents the percentage of each sales
Ringgit remaining after deducting all costs and operating expenses excluding interest and taxes.The
operating profit margin can be computed as follows:
Operating profit margin = operating profit before tax / sales
DIGI shows the increasing in operating profit ratio start from 50.54% in 2016 to 67.37% in 2018, while
MAXIS also increase their ratio value from 36.60% in 2016 to 46.73% in 2018.
This ratio indicates that DIGI generated 67 Sen in 2018 in operating profit after deducting cost of goods
sold and operating expenses for every RM1 in sales, which is higher than MAXIS, 46 Sen in the same
year.
Net Profit Margin
The net profit margin is to measure the percentage of sales ringgit remaining after deducting all costs,
operating expenses, interest and taxes.
Alternatively, this ratio represents the net income ringgit generated by each ringgit of sales. As we wish
to analyze the net income from the normal operations of the firm, we need to exclude other incomes
and expenses that are not attributable to its normal operations. A higher ratio indicates the firm has
good cost control that contributes to higher net income relative to net sales. Net profit margin can be
computed as follows:
Net profit margin = net income / sales
From the data obtained MAXIS can maintain in growth in net profit margin from 20.56% stated in 2014 to
23.27% in 2017 and then dropped to 19.36% in 2018. On the other side, DIGI can generate highest net profit in 2016
with the value of 35.02% and maintain at about 23% of the ratio for both 2017 and 2018.
The data tells us that DIGI can generated 23 Sen in profit after deducting all expenses, interest cost and
income tax for every RM1 in sales. Which is higher value than 19.36 Sen of MAXIS net profit generated in
2018.
The return on total assets
The return on total assets (ROA) is to measure the management's effectiveness in utilizing all the assets
of the firm to create profits. The ROA can be computed as follows:
Return on total assets = net income / total assets
In this section DIGI company shows the decreasing in ROA from 2014 to 2018 with the value of 47.20%
to 24.83%, respectively. While MAXIS show the percentages in 2016 and 2017 were highest and this
shows that companies used their assets a lot during the year to generate revenue which are 10.25% and
11.39% respectively.
In final year of analysis, 2018, the ratio tells us that DIGI can earn 24.83 Sen while MAXIS can earn only
11 Sen in profit for every RM1 of assets utilized. DIGI company are more effective in utilizing their assets
to generate income.
The return on common equity
The return on common equity is to measure the return to the common shareholders for investing to the
firm. The ROE can be computed as:
Return on common equity = net income / common equity
The ratio of MAXIS company increases from 2014 to 2016 with 36.41% to 42.63%, then drop continuously
to 24.89% in 2018. In addition, the percentages in 2015 and 2016 were the highest and this shows that
companies used a lot of equity that year to generate revenue. Whereas in 2018 the percentage of equity
is less. While DIGI decrease from 331.67% in 2015 to 228.88% in the final year. The value of DIGI
company higher than MAXIS is because of the different number of total equities of both companies. In
2018 alone, DIGI has RM673,188,000 while MAXIS consist of RM7,149,731,000 in total Equity.
Based on the result in 2018, the ratio indicate that DIGI earned about RM2.28 in profits on each RM1 of
the common stock equity compared to Maxis with only 24 Sen in the selected year.
⊘ This is a preview!⊘
Do you want full access?
Subscribe today to unlock all pages.
Trusted by 1+ million students worldwide
1 out of 16
Related Documents


Your All-in-One AI-Powered Toolkit for Academic Success.
+13062052269
info@desklib.com
Available 24*7 on WhatsApp / Email
![[object Object]](/_next/static/media/star-bottom.7253800d.svg)
Unlock your academic potential
Copyright © 2020–2026 A2Z Services. All Rights Reserved. Developed and managed by ZUCOL.