MBA 5002 Case Study: Analyzing Australia Post Using Financial Ratios
VerifiedAdded on 2023/06/18
|12
|2920
|72
Case Study
AI Summary
This case study provides a financial analysis of Australia Post, focusing on its balance sheet, income statement, and key financial ratios. The analysis covers profitability, liquidity, and solvency, utilizing data from 2018 to 2020. The report examines trends in interest income, expenses, and earnings per share (EPS), highlighting the impact of factors like interest rates and the COVID-19 pandemic. Profitability is assessed through return on assets and equity, while liquidity is evaluated using current and quick ratios. The study also touches on solvency ratios and turnover analysis to provide a comprehensive view of Australia Post's financial health and its ability to meet obligations and generate returns for shareholders. Desklib provides a platform for students to access similar solved assignments and past papers.

Australia post
Paraphrase This Document
Need a fresh take? Get an instant paraphrase of this document with our AI Paraphraser
TABLE OF CONTENTS:
Introduction.....................................................................................................................................3
Balance sheet:..................................................................................................................................3
Income statement.............................................................................................................................5
Profitability analysis....................................................................................................................7
Solvency ratio..............................................................................................................................8
Turnover analysis........................................................................................................................9
Conclusion ....................................................................................................................................10
References.....................................................................................................................................11
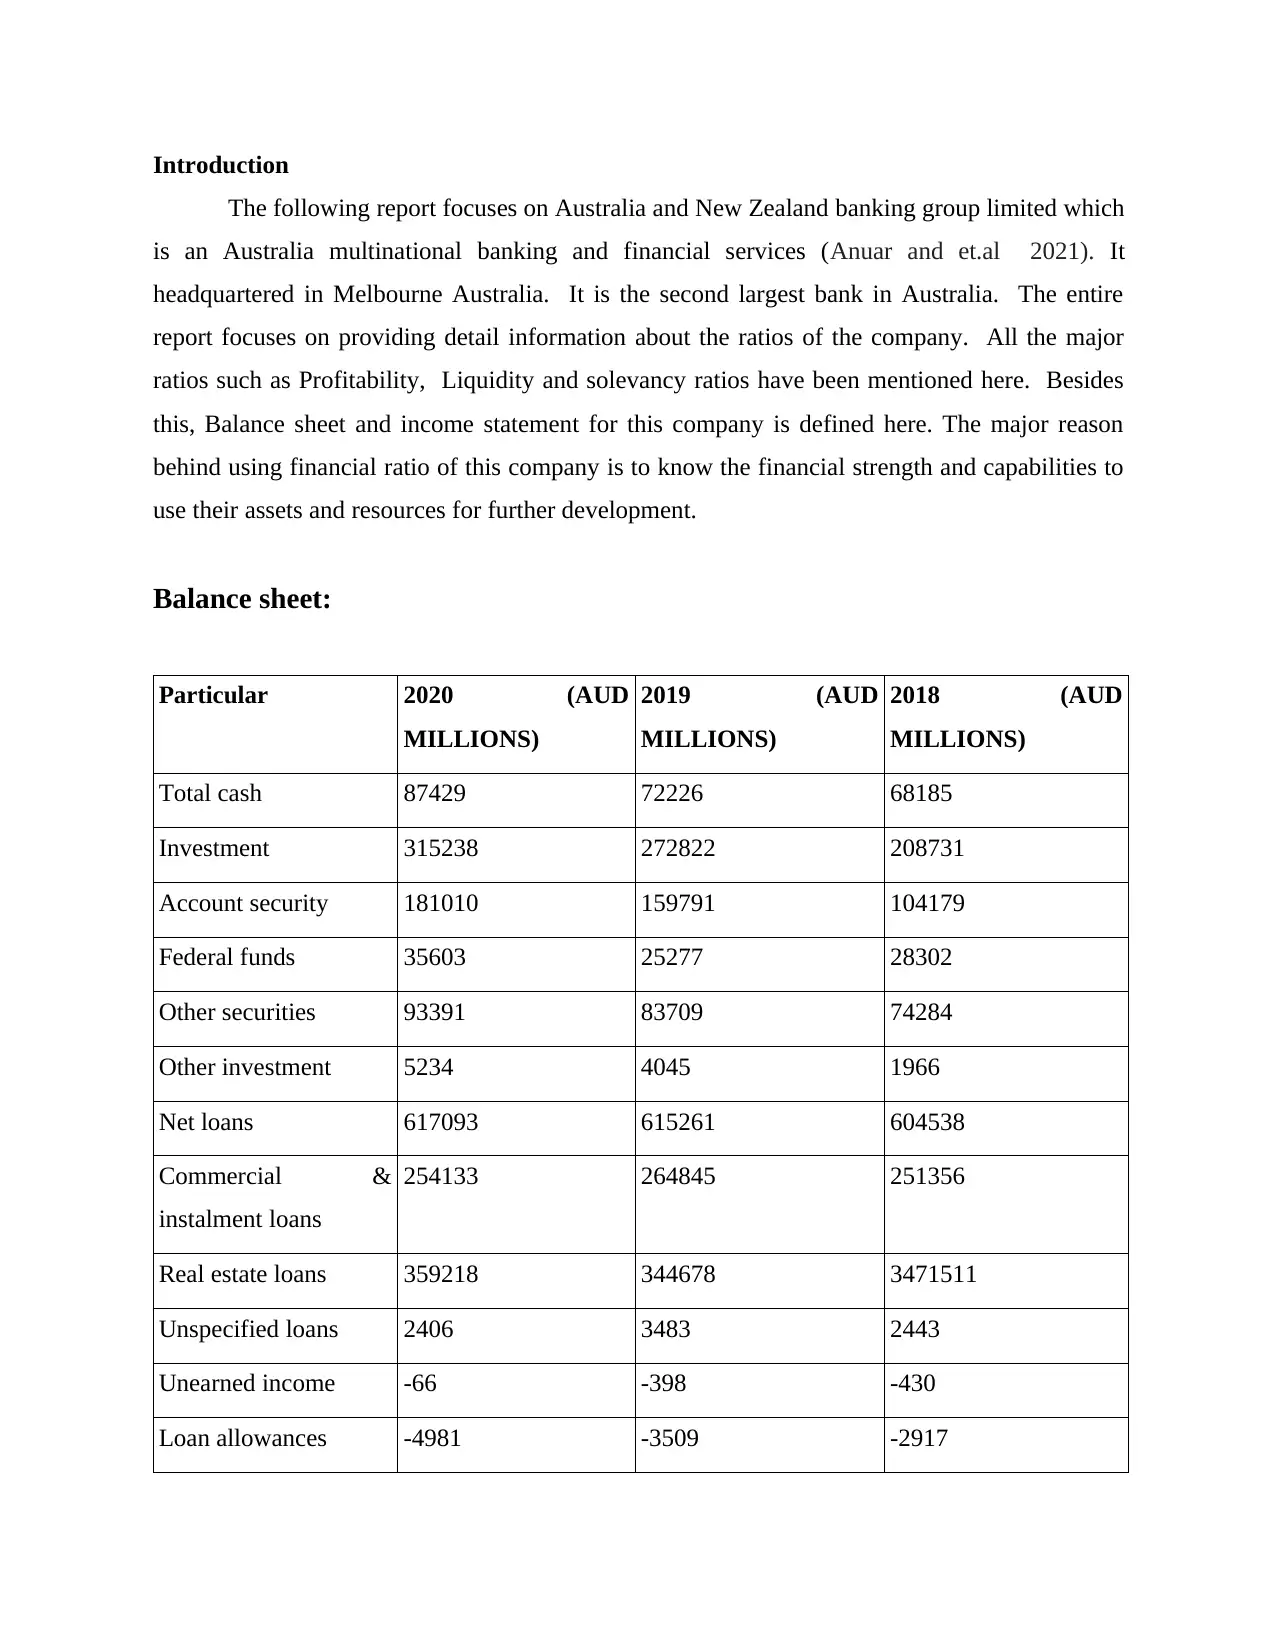
Introduction
The following report focuses on Australia and New Zealand banking group limited which
is an Australia multinational banking and financial services (Anuar and et.al 2021). It
headquartered in Melbourne Australia. It is the second largest bank in Australia. The entire
report focuses on providing detail information about the ratios of the company. All the major
ratios such as Profitability, Liquidity and solevancy ratios have been mentioned here. Besides
this, Balance sheet and income statement for this company is defined here. The major reason
behind using financial ratio of this company is to know the financial strength and capabilities to
use their assets and resources for further development.
Balance sheet:
Particular 2020 (AUD
MILLIONS)
2019 (AUD
MILLIONS)
2018 (AUD
MILLIONS)
Total cash 87429 72226 68185
Investment 315238 272822 208731
Account security 181010 159791 104179
Federal funds 35603 25277 28302
Other securities 93391 83709 74284
Other investment 5234 4045 1966
Net loans 617093 615261 604538
Commercial &
instalment loans
254133 264845 251356
Real estate loans 359218 344678 3471511
Unspecified loans 2406 3483 2443
Unearned income -66 -398 -430
Loan allowances -4981 -3509 -2917
⊘ This is a preview!⊘
Do you want full access?
Subscribe today to unlock all pages.
Trusted by 1+ million students worldwide
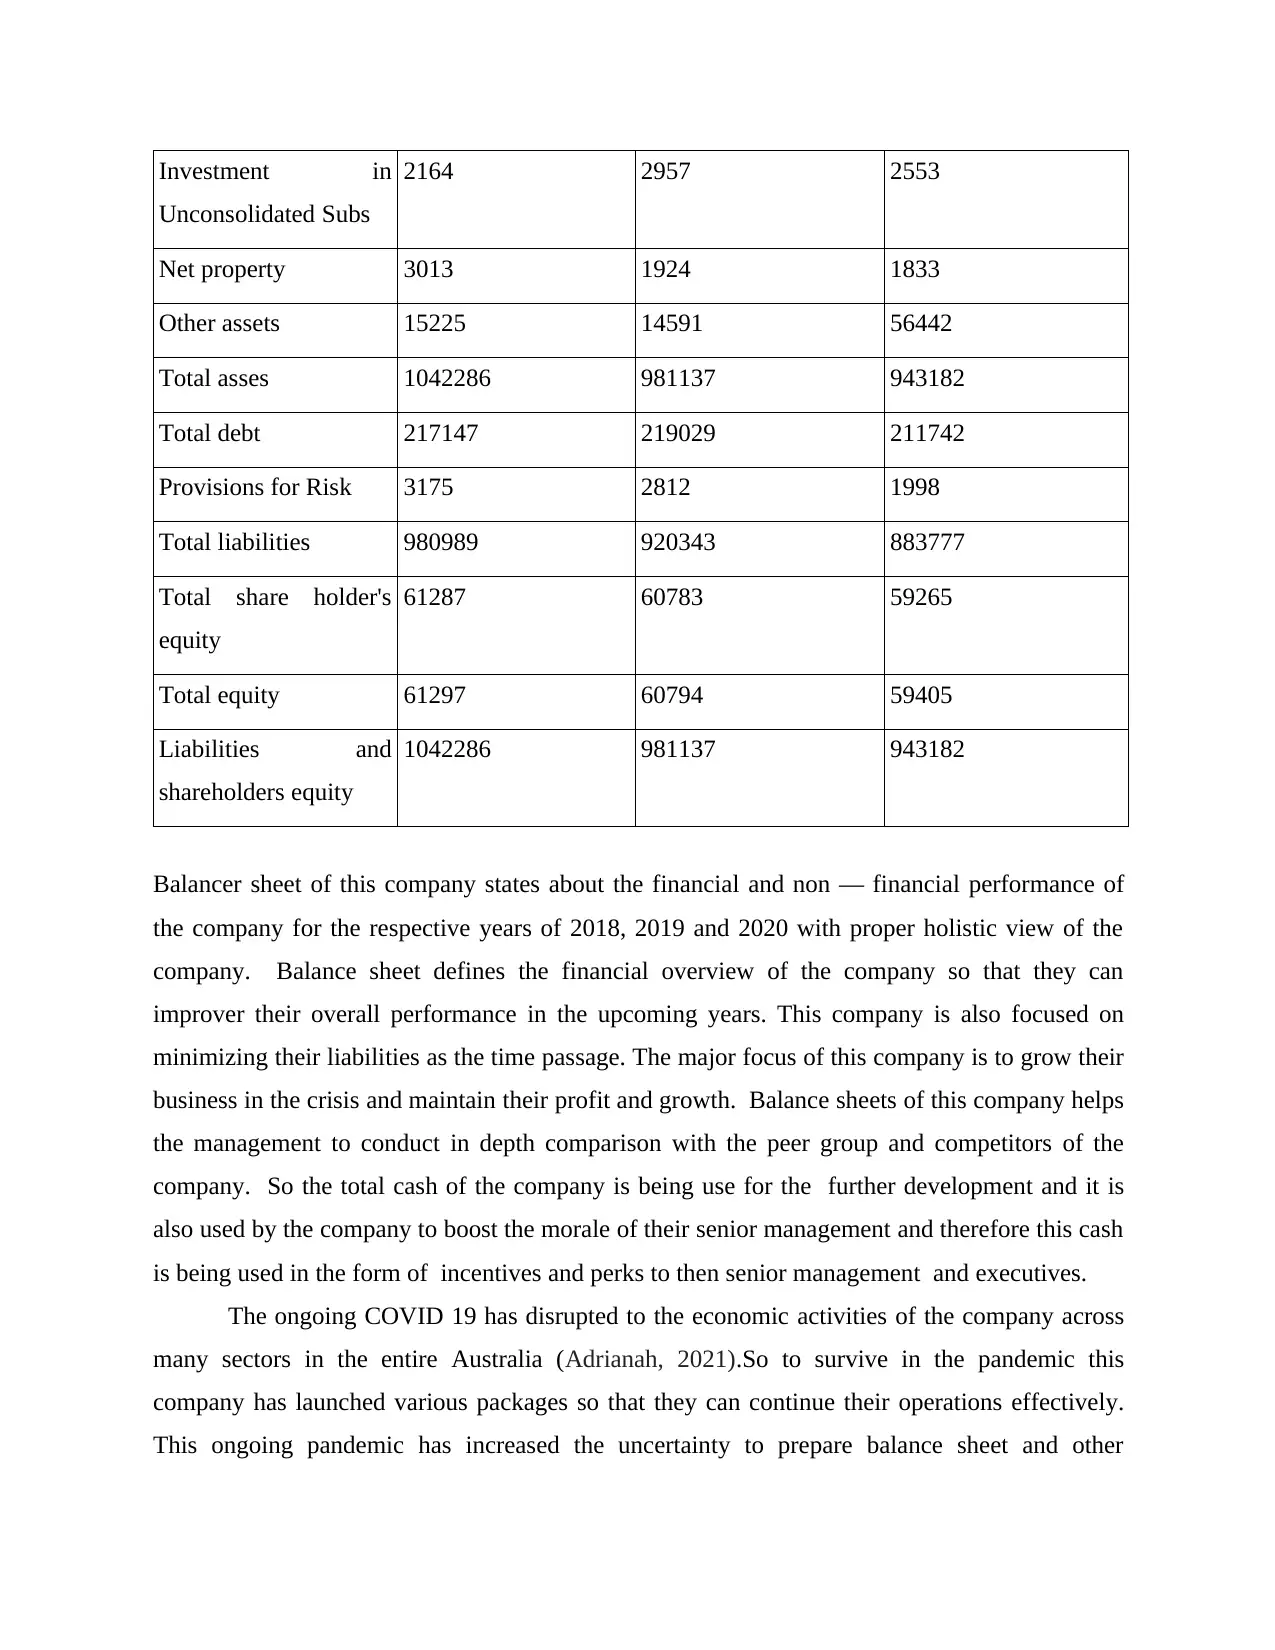
Investment in
Unconsolidated Subs
2164 2957 2553
Net property 3013 1924 1833
Other assets 15225 14591 56442
Total asses 1042286 981137 943182
Total debt 217147 219029 211742
Provisions for Risk 3175 2812 1998
Total liabilities 980989 920343 883777
Total share holder's
equity
61287 60783 59265
Total equity 61297 60794 59405
Liabilities and
shareholders equity
1042286 981137 943182
Balancer sheet of this company states about the financial and non — financial performance of
the company for the respective years of 2018, 2019 and 2020 with proper holistic view of the
company. Balance sheet defines the financial overview of the company so that they can
improver their overall performance in the upcoming years. This company is also focused on
minimizing their liabilities as the time passage. The major focus of this company is to grow their
business in the crisis and maintain their profit and growth. Balance sheets of this company helps
the management to conduct in depth comparison with the peer group and competitors of the
company. So the total cash of the company is being use for the further development and it is
also used by the company to boost the morale of their senior management and therefore this cash
is being used in the form of incentives and perks to then senior management and executives.
The ongoing COVID 19 has disrupted to the economic activities of the company across
many sectors in the entire Australia (Adrianah, 2021).So to survive in the pandemic this
company has launched various packages so that they can continue their operations effectively.
This ongoing pandemic has increased the uncertainty to prepare balance sheet and other
Paraphrase This Document
Need a fresh take? Get an instant paraphrase of this document with our AI Paraphraser
financial statement. This group has increased their assumption and expectation for future
performance as this company do not want to disappoint their shareholders by giving them fewer
returns. During the year 2020, this group has adopted various accounting standards so that they
do not have to face various issues in the future. As the company different federal funds which
they are going to use to protect their resources and provide all the wages and incentives to the
employee on time. This group believes that employees are their valuable asserts, and they can
lead the organization to reach at success. This company believes in continue operations that they
can improve their performance in the upcoming years. This company always want them to must
keep their operating cash more than operating expenses.
Balance sheet is one of the important financial statement which represent all the
resources held by ANZ bank (ANZ annual report 2020). It also defines the amount of liability
which is outstanding for the company, and they have top repay it in the near future. As per the
balance sheet it has been analysed that the overall debt of the company has been reduced in 2020
as compared to past years which clearly states that the overall income of the company has been
increased and now company can use such amount to declare good dividend. But on the other
hand the overall liabilities of the company is increasing which clearly shows that company is
taking more loan and other oblations.
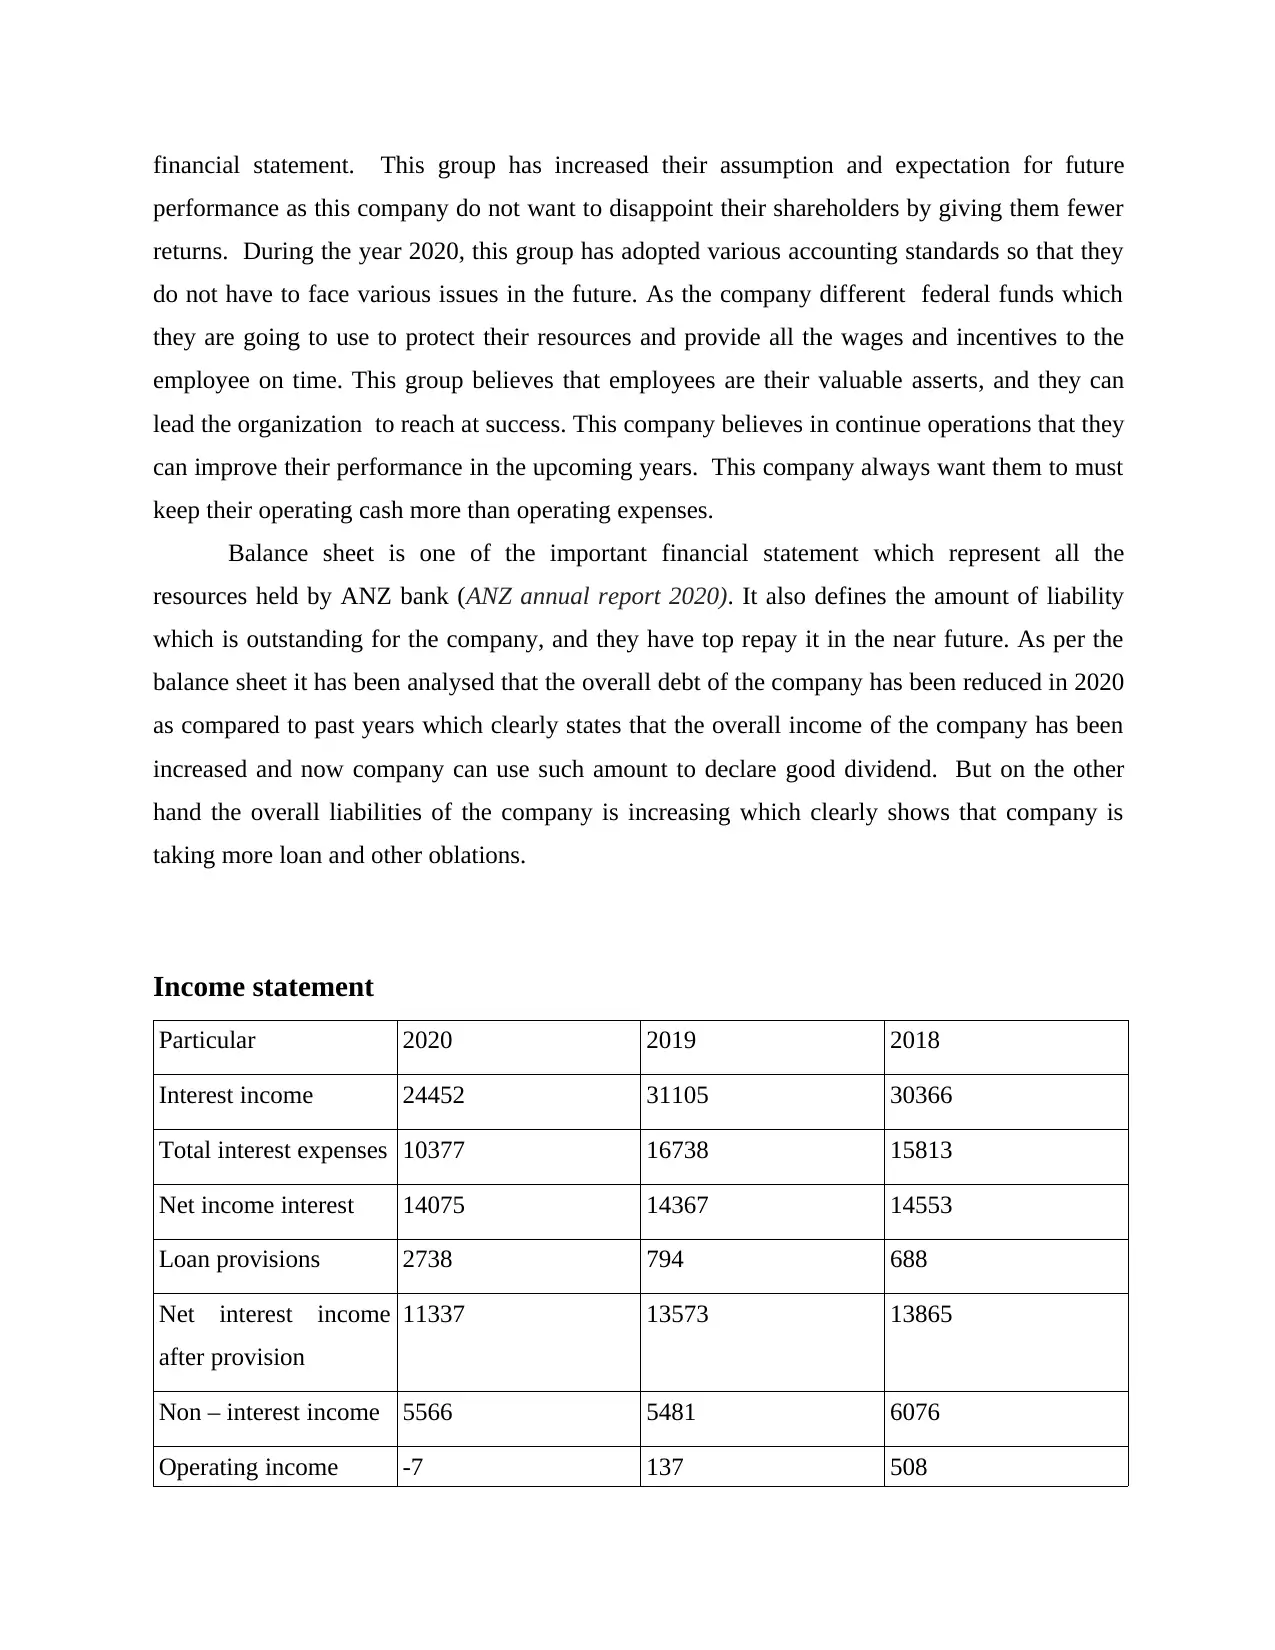
Income statement
Particular 2020 2019 2018
Interest income 24452 31105 30366
Total interest expenses 10377 16738 15813
Net income interest 14075 14367 14553
Loan provisions 2738 794 688
Net interest income
after provision
11337 13573 13865
Non – interest income 5566 5481 6076
Operating income -7 137 508
performance as this company do not want to disappoint their shareholders by giving them fewer
returns. During the year 2020, this group has adopted various accounting standards so that they
do not have to face various issues in the future. As the company different federal funds which
they are going to use to protect their resources and provide all the wages and incentives to the
employee on time. This group believes that employees are their valuable asserts, and they can
lead the organization to reach at success. This company believes in continue operations that they
can improve their performance in the upcoming years. This company always want them to must
keep their operating cash more than operating expenses.
Balance sheet is one of the important financial statement which represent all the
resources held by ANZ bank (ANZ annual report 2020). It also defines the amount of liability
which is outstanding for the company, and they have top repay it in the near future. As per the
balance sheet it has been analysed that the overall debt of the company has been reduced in 2020
as compared to past years which clearly states that the overall income of the company has been
increased and now company can use such amount to declare good dividend. But on the other
hand the overall liabilities of the company is increasing which clearly shows that company is
taking more loan and other oblations.
Income statement
Particular 2020 2019 2018
Interest income 24452 31105 30366
Total interest expenses 10377 16738 15813
Net income interest 14075 14367 14553
Loan provisions 2738 794 688
Net interest income
after provision
11337 13573 13865
Non – interest income 5566 5481 6076
Operating income -7 137 508
Income tax 1840 2609 2784
Consolidated net
income
3676 6311 7111
Net income available
to common
3577 5953 6400
EPS 1.26 2.1 2.22
Share outstanding 3201 3082 3149
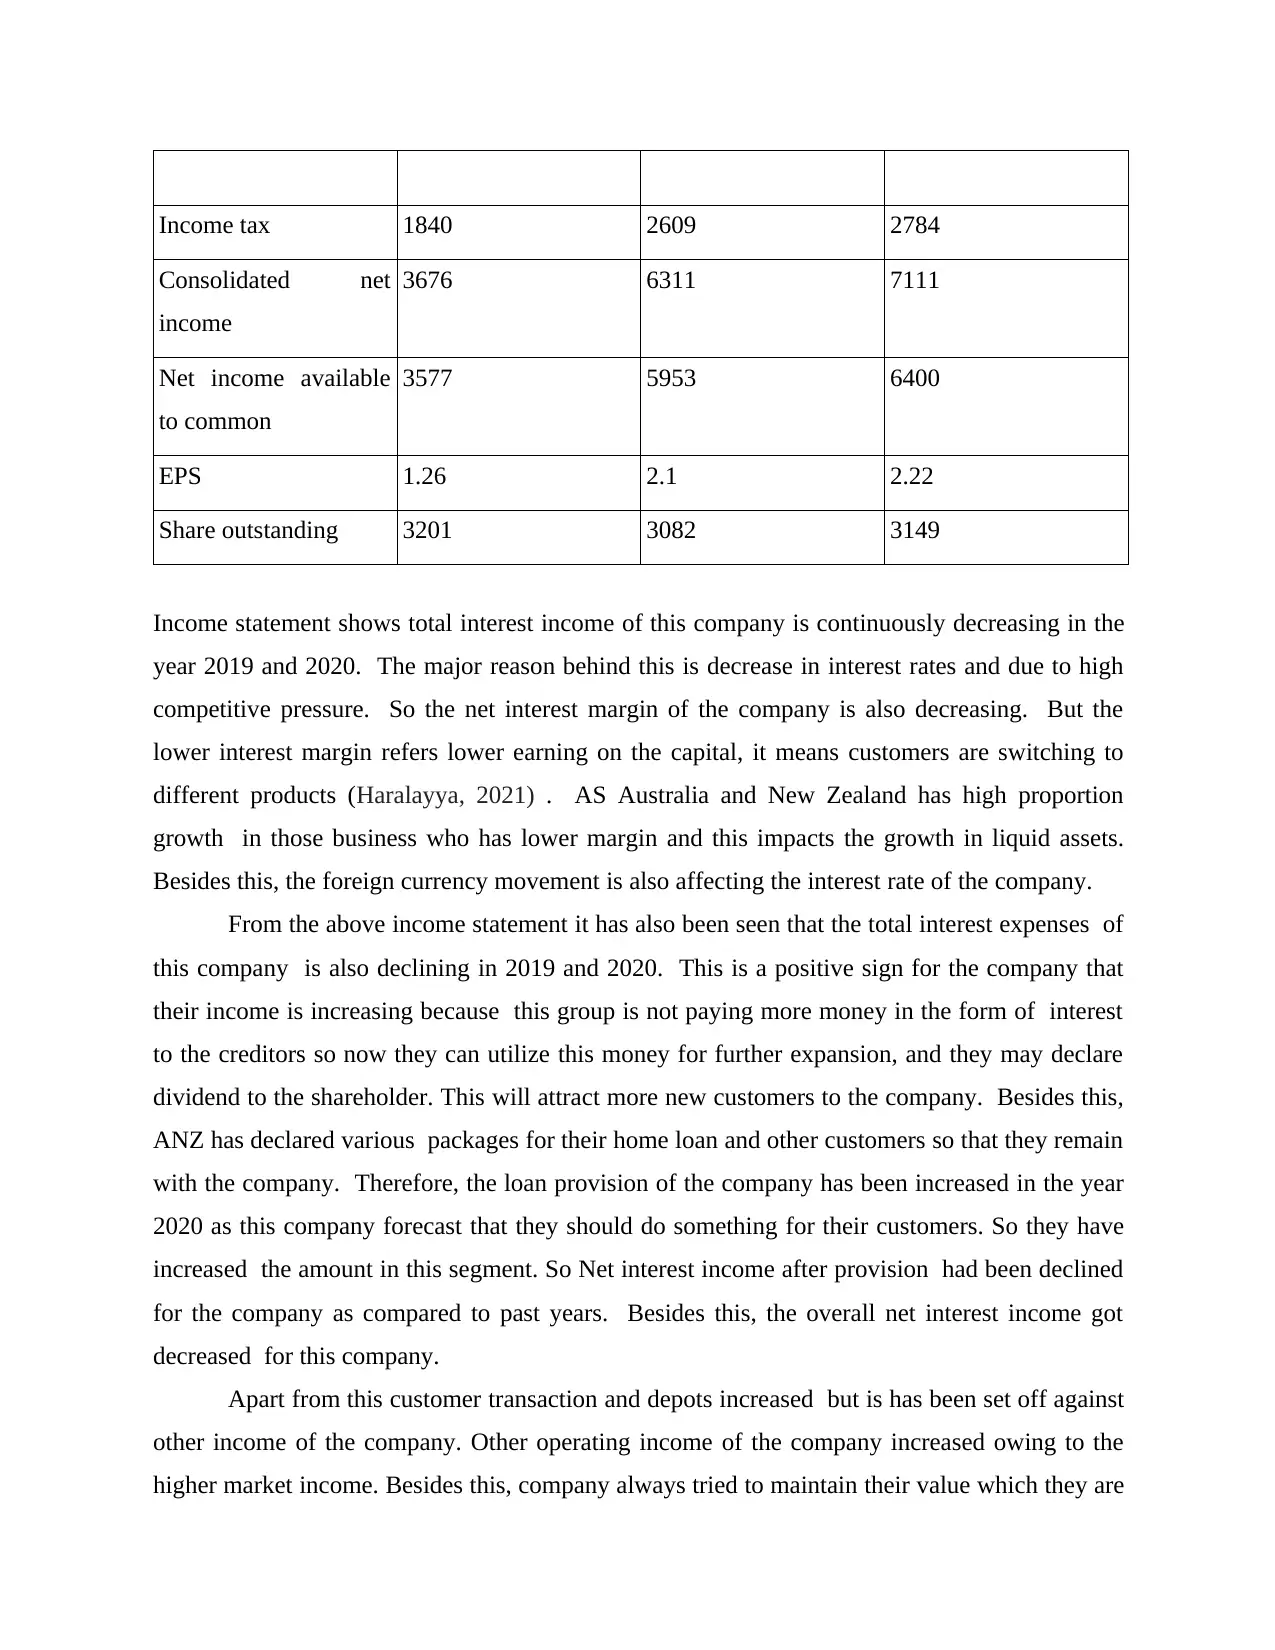
Income statement shows total interest income of this company is continuously decreasing in the
year 2019 and 2020. The major reason behind this is decrease in interest rates and due to high
competitive pressure. So the net interest margin of the company is also decreasing. But the
lower interest margin refers lower earning on the capital, it means customers are switching to
different products (Haralayya, 2021) . AS Australia and New Zealand has high proportion
growth in those business who has lower margin and this impacts the growth in liquid assets.
Besides this, the foreign currency movement is also affecting the interest rate of the company.
From the above income statement it has also been seen that the total interest expenses of
this company is also declining in 2019 and 2020. This is a positive sign for the company that
their income is increasing because this group is not paying more money in the form of interest
to the creditors so now they can utilize this money for further expansion, and they may declare
dividend to the shareholder. This will attract more new customers to the company. Besides this,
ANZ has declared various packages for their home loan and other customers so that they remain
with the company. Therefore, the loan provision of the company has been increased in the year
2020 as this company forecast that they should do something for their customers. So they have
increased the amount in this segment. So Net interest income after provision had been declined
for the company as compared to past years. Besides this, the overall net interest income got
decreased for this company.
Apart from this customer transaction and depots increased but is has been set off against
other income of the company. Other operating income of the company increased owing to the
higher market income. Besides this, company always tried to maintain their value which they are
Consolidated net
income
3676 6311 7111
Net income available
to common
3577 5953 6400
EPS 1.26 2.1 2.22
Share outstanding 3201 3082 3149
Income statement shows total interest income of this company is continuously decreasing in the
year 2019 and 2020. The major reason behind this is decrease in interest rates and due to high
competitive pressure. So the net interest margin of the company is also decreasing. But the
lower interest margin refers lower earning on the capital, it means customers are switching to
different products (Haralayya, 2021) . AS Australia and New Zealand has high proportion
growth in those business who has lower margin and this impacts the growth in liquid assets.
Besides this, the foreign currency movement is also affecting the interest rate of the company.
From the above income statement it has also been seen that the total interest expenses of
this company is also declining in 2019 and 2020. This is a positive sign for the company that
their income is increasing because this group is not paying more money in the form of interest
to the creditors so now they can utilize this money for further expansion, and they may declare
dividend to the shareholder. This will attract more new customers to the company. Besides this,
ANZ has declared various packages for their home loan and other customers so that they remain
with the company. Therefore, the loan provision of the company has been increased in the year
2020 as this company forecast that they should do something for their customers. So they have
increased the amount in this segment. So Net interest income after provision had been declined
for the company as compared to past years. Besides this, the overall net interest income got
decreased for this company.
Apart from this customer transaction and depots increased but is has been set off against
other income of the company. Other operating income of the company increased owing to the
higher market income. Besides this, company always tried to maintain their value which they are
⊘ This is a preview!⊘
Do you want full access?
Subscribe today to unlock all pages.
Trusted by 1+ million students worldwide
following for years such as they follow integrity, collaborations and respect to the work, and
they have to maintain it so that the brand image of the company do not suffer.
As this is one of the largest bank of Australia, so they have to maintain good reputation
in the market and also this will help the company to increase their share price but from the
above income statement it has clearly seen that the EPS of this company is decreasing. Earning
per share ratio is being calculated as the company's profit get divided by the outstanding shares.
The resulting number shows the profitability of the company.
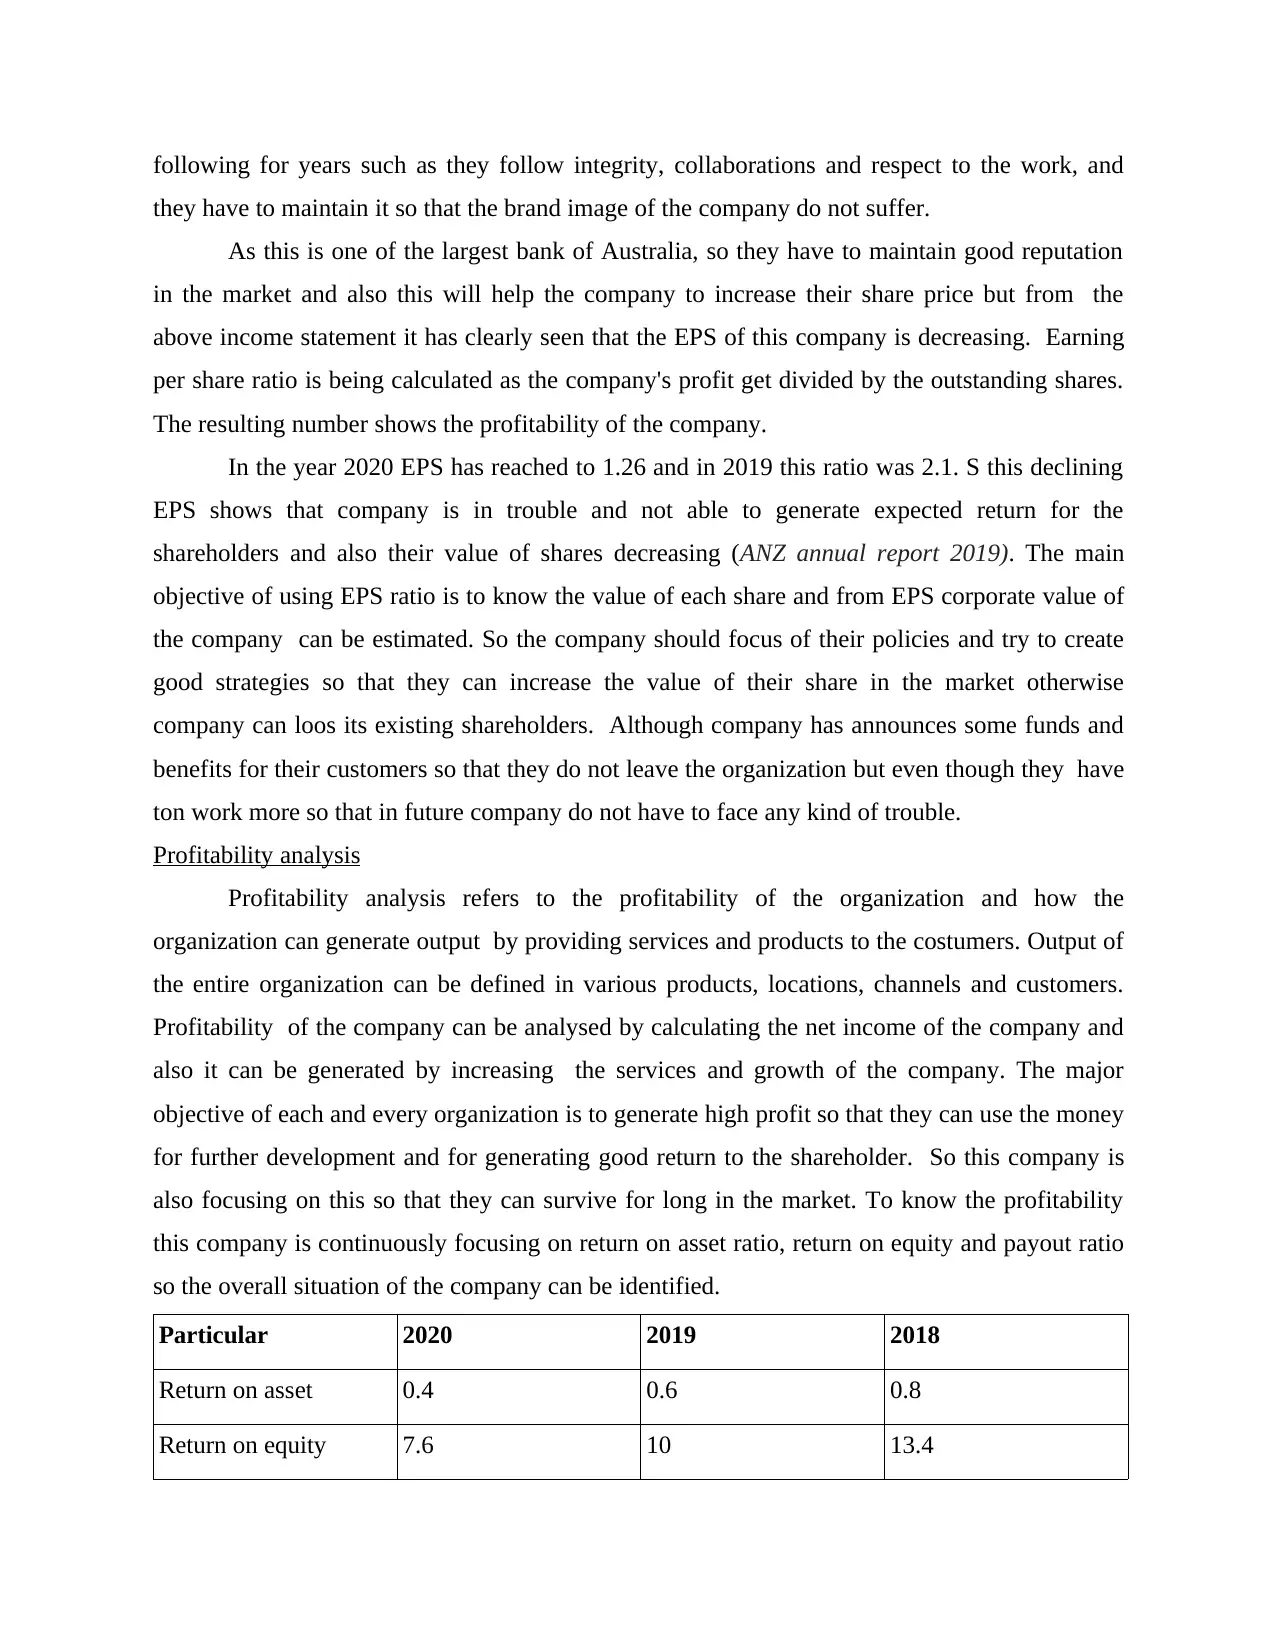
In the year 2020 EPS has reached to 1.26 and in 2019 this ratio was 2.1. S this declining
EPS shows that company is in trouble and not able to generate expected return for the
shareholders and also their value of shares decreasing (ANZ annual report 2019). The main
objective of using EPS ratio is to know the value of each share and from EPS corporate value of
the company can be estimated. So the company should focus of their policies and try to create
good strategies so that they can increase the value of their share in the market otherwise
company can loos its existing shareholders. Although company has announces some funds and
benefits for their customers so that they do not leave the organization but even though they have
ton work more so that in future company do not have to face any kind of trouble.
Profitability analysis
Profitability analysis refers to the profitability of the organization and how the
organization can generate output by providing services and products to the costumers. Output of
the entire organization can be defined in various products, locations, channels and customers.
Profitability of the company can be analysed by calculating the net income of the company and
also it can be generated by increasing the services and growth of the company. The major
objective of each and every organization is to generate high profit so that they can use the money
for further development and for generating good return to the shareholder. So this company is
also focusing on this so that they can survive for long in the market. To know the profitability
this company is continuously focusing on return on asset ratio, return on equity and payout ratio
so the overall situation of the company can be identified.
Particular 2020 2019 2018
Return on asset 0.4 0.6 0.8
Return on equity 7.6 10 13.4
they have to maintain it so that the brand image of the company do not suffer.
As this is one of the largest bank of Australia, so they have to maintain good reputation
in the market and also this will help the company to increase their share price but from the
above income statement it has clearly seen that the EPS of this company is decreasing. Earning
per share ratio is being calculated as the company's profit get divided by the outstanding shares.
The resulting number shows the profitability of the company.
In the year 2020 EPS has reached to 1.26 and in 2019 this ratio was 2.1. S this declining
EPS shows that company is in trouble and not able to generate expected return for the
shareholders and also their value of shares decreasing (ANZ annual report 2019). The main
objective of using EPS ratio is to know the value of each share and from EPS corporate value of
the company can be estimated. So the company should focus of their policies and try to create
good strategies so that they can increase the value of their share in the market otherwise
company can loos its existing shareholders. Although company has announces some funds and
benefits for their customers so that they do not leave the organization but even though they have
ton work more so that in future company do not have to face any kind of trouble.
Profitability analysis
Profitability analysis refers to the profitability of the organization and how the
organization can generate output by providing services and products to the costumers. Output of
the entire organization can be defined in various products, locations, channels and customers.
Profitability of the company can be analysed by calculating the net income of the company and
also it can be generated by increasing the services and growth of the company. The major
objective of each and every organization is to generate high profit so that they can use the money
for further development and for generating good return to the shareholder. So this company is
also focusing on this so that they can survive for long in the market. To know the profitability
this company is continuously focusing on return on asset ratio, return on equity and payout ratio
so the overall situation of the company can be identified.
Particular 2020 2019 2018
Return on asset 0.4 0.6 0.8
Return on equity 7.6 10 13.4
Paraphrase This Document
Need a fresh take? Get an instant paraphrase of this document with our AI Paraphraser
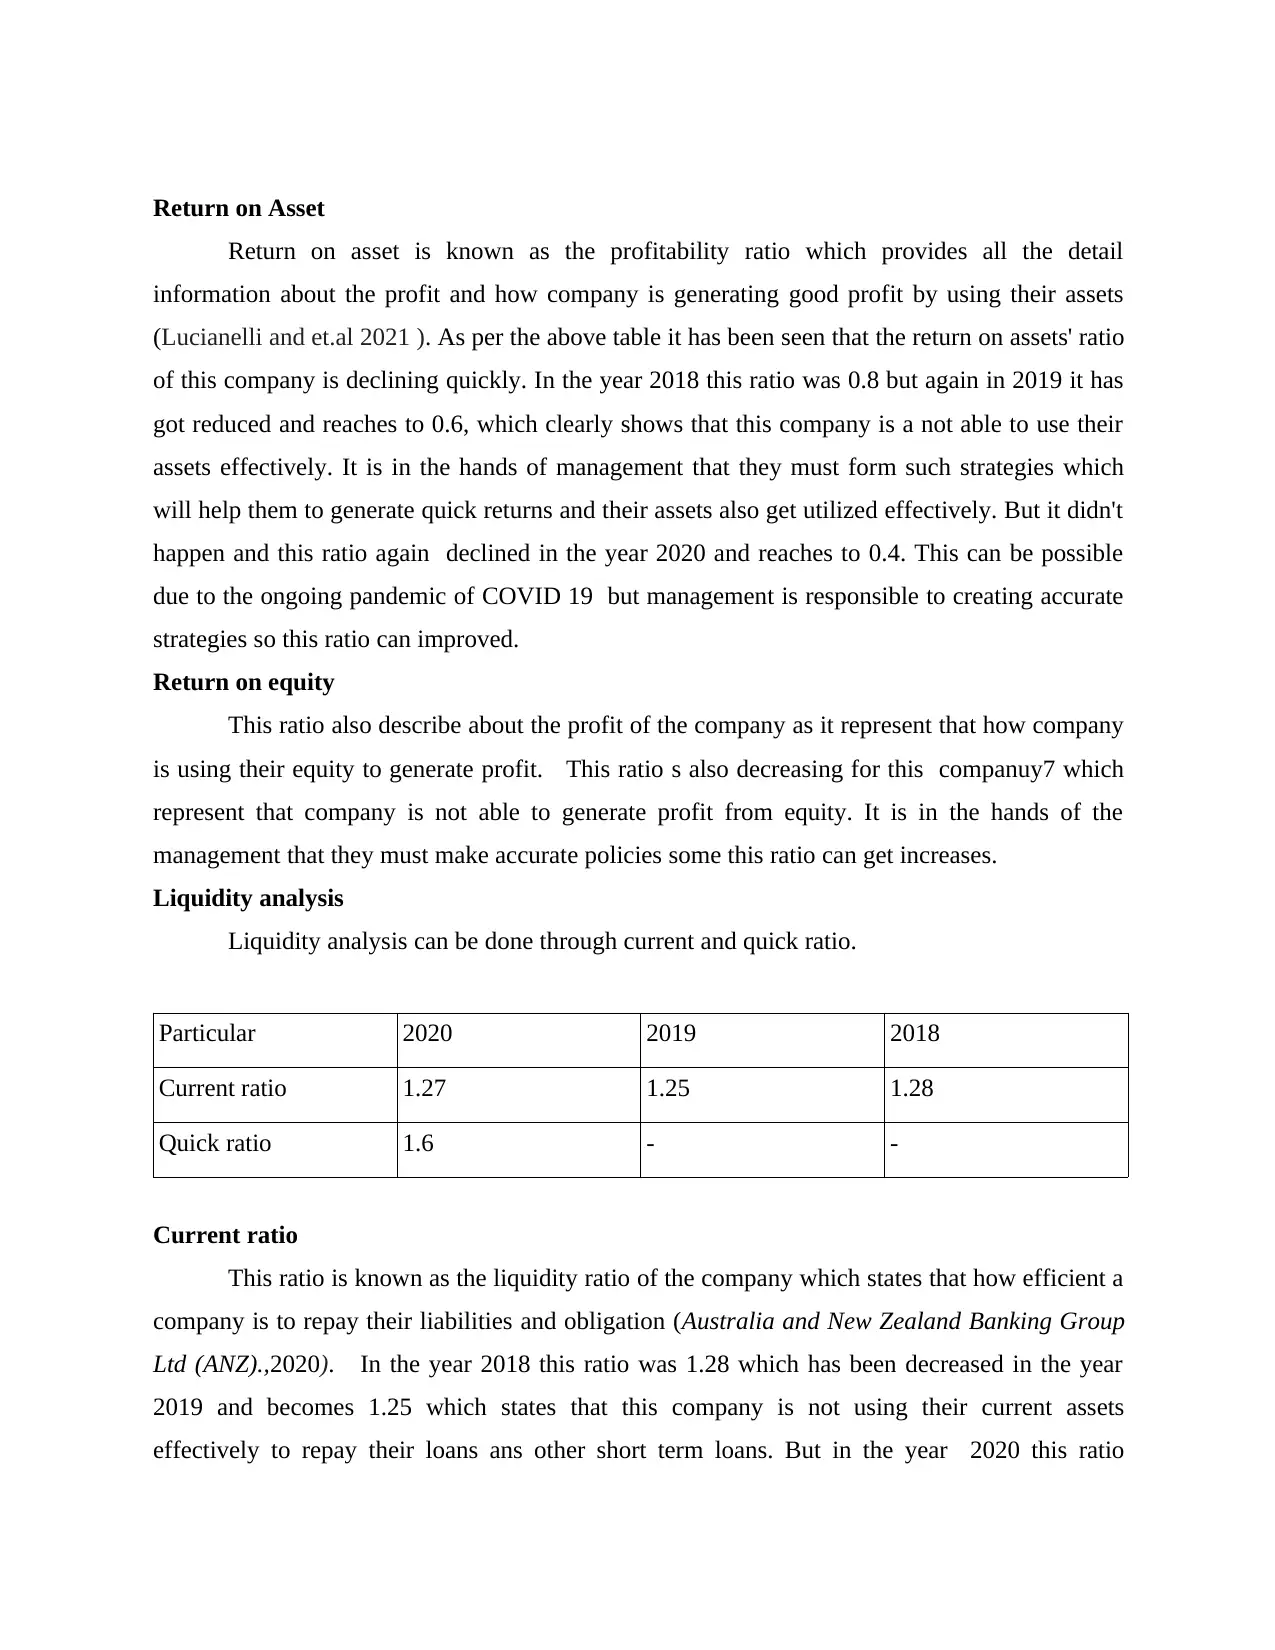
Return on Asset
Return on asset is known as the profitability ratio which provides all the detail
information about the profit and how company is generating good profit by using their assets
(Lucianelli and et.al 2021 ). As per the above table it has been seen that the return on assets' ratio
of this company is declining quickly. In the year 2018 this ratio was 0.8 but again in 2019 it has
got reduced and reaches to 0.6, which clearly shows that this company is a not able to use their
assets effectively. It is in the hands of management that they must form such strategies which
will help them to generate quick returns and their assets also get utilized effectively. But it didn't
happen and this ratio again declined in the year 2020 and reaches to 0.4. This can be possible
due to the ongoing pandemic of COVID 19 but management is responsible to creating accurate
strategies so this ratio can improved.
Return on equity
This ratio also describe about the profit of the company as it represent that how company
is using their equity to generate profit. This ratio s also decreasing for this companuy7 which
represent that company is not able to generate profit from equity. It is in the hands of the
management that they must make accurate policies some this ratio can get increases.
Liquidity analysis
Liquidity analysis can be done through current and quick ratio.
Particular 2020 2019 2018
Current ratio 1.27 1.25 1.28
Quick ratio 1.6 - -
Current ratio
This ratio is known as the liquidity ratio of the company which states that how efficient a
company is to repay their liabilities and obligation (Australia and New Zealand Banking Group
Ltd (ANZ).,2020). In the year 2018 this ratio was 1.28 which has been decreased in the year
2019 and becomes 1.25 which states that this company is not using their current assets
effectively to repay their loans ans other short term loans. But in the year 2020 this ratio
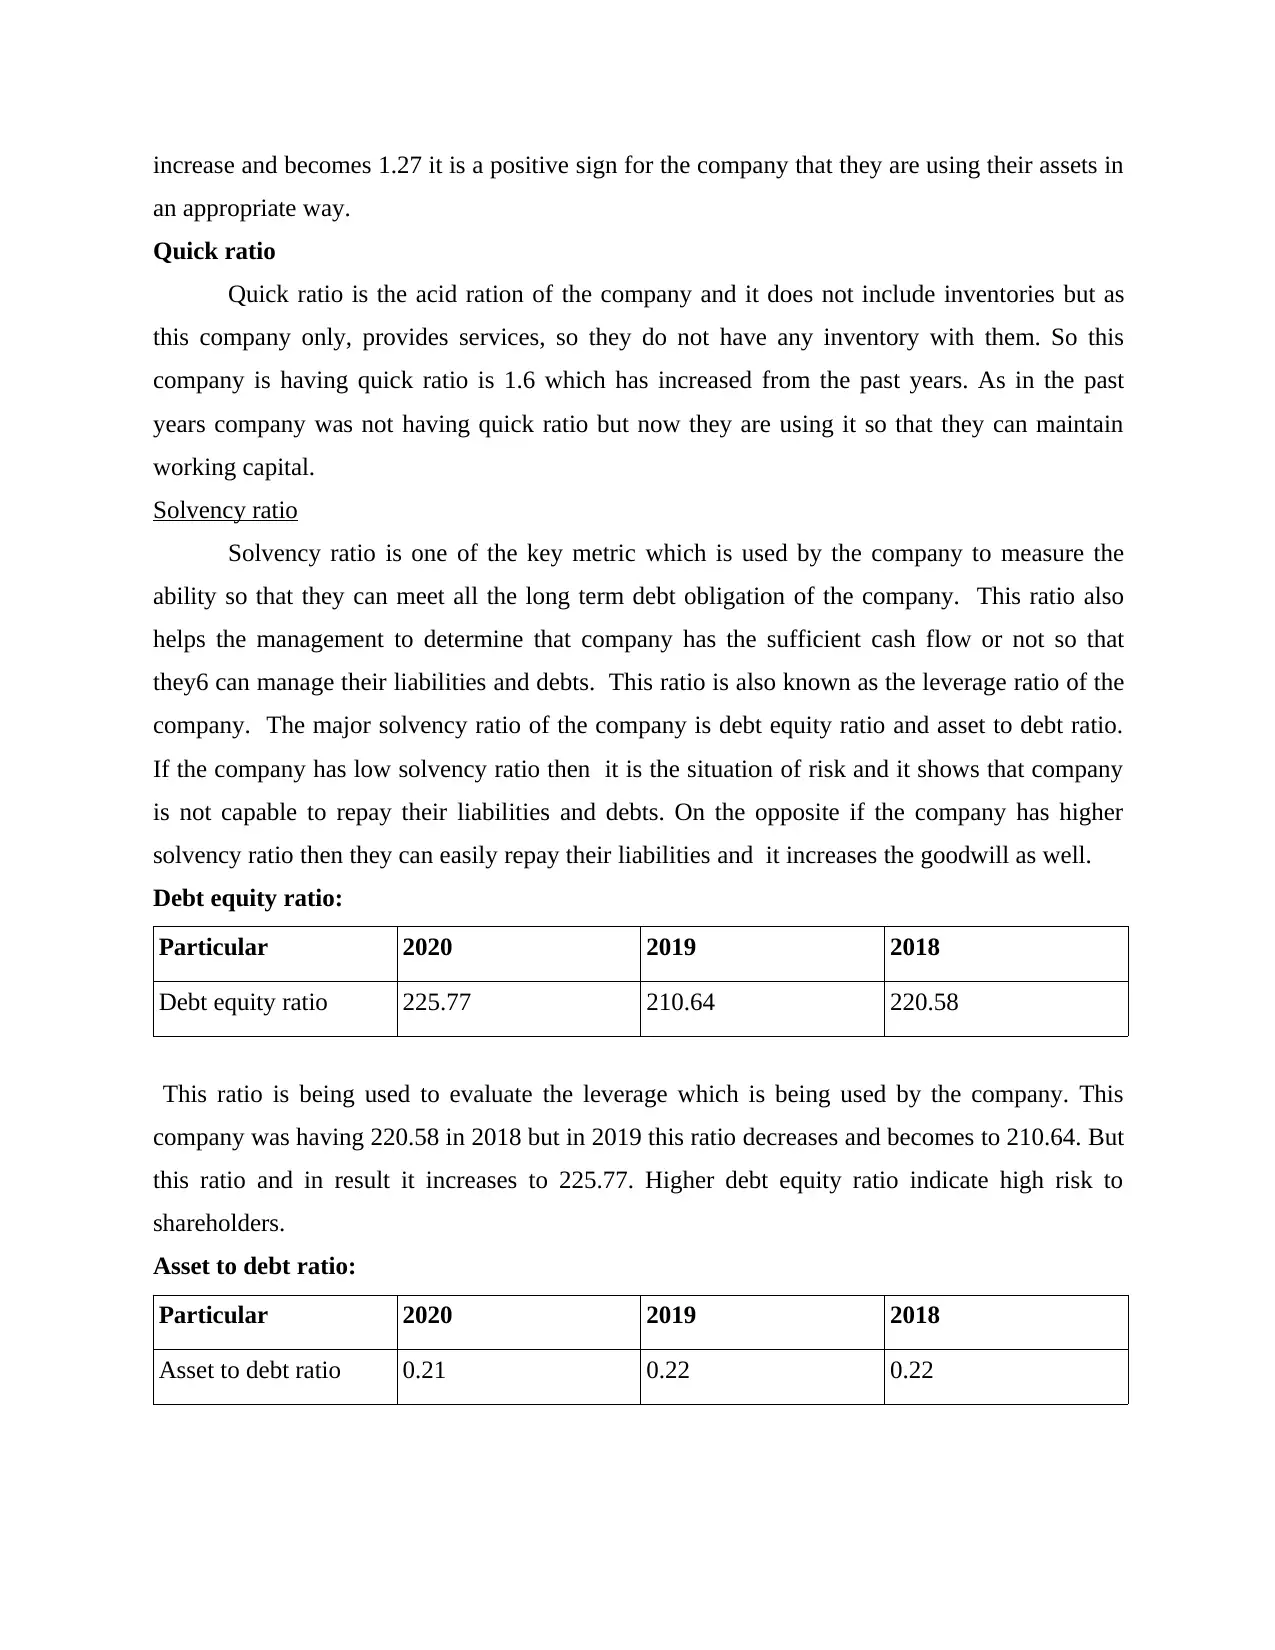
increase and becomes 1.27 it is a positive sign for the company that they are using their assets in
an appropriate way.
Quick ratio
Quick ratio is the acid ration of the company and it does not include inventories but as
this company only, provides services, so they do not have any inventory with them. So this
company is having quick ratio is 1.6 which has increased from the past years. As in the past
years company was not having quick ratio but now they are using it so that they can maintain
working capital.
Solvency ratio
Solvency ratio is one of the key metric which is used by the company to measure the
ability so that they can meet all the long term debt obligation of the company. This ratio also
helps the management to determine that company has the sufficient cash flow or not so that
they6 can manage their liabilities and debts. This ratio is also known as the leverage ratio of the
company. The major solvency ratio of the company is debt equity ratio and asset to debt ratio.
If the company has low solvency ratio then it is the situation of risk and it shows that company
is not capable to repay their liabilities and debts. On the opposite if the company has higher
solvency ratio then they can easily repay their liabilities and it increases the goodwill as well.
Debt equity ratio:
Particular 2020 2019 2018
Debt equity ratio 225.77 210.64 220.58
This ratio is being used to evaluate the leverage which is being used by the company. This
company was having 220.58 in 2018 but in 2019 this ratio decreases and becomes to 210.64. But
this ratio and in result it increases to 225.77. Higher debt equity ratio indicate high risk to
shareholders.
Asset to debt ratio:
Particular 2020 2019 2018
Asset to debt ratio 0.21 0.22 0.22
⊘ This is a preview!⊘
Do you want full access?
Subscribe today to unlock all pages.
Trusted by 1+ million students worldwide
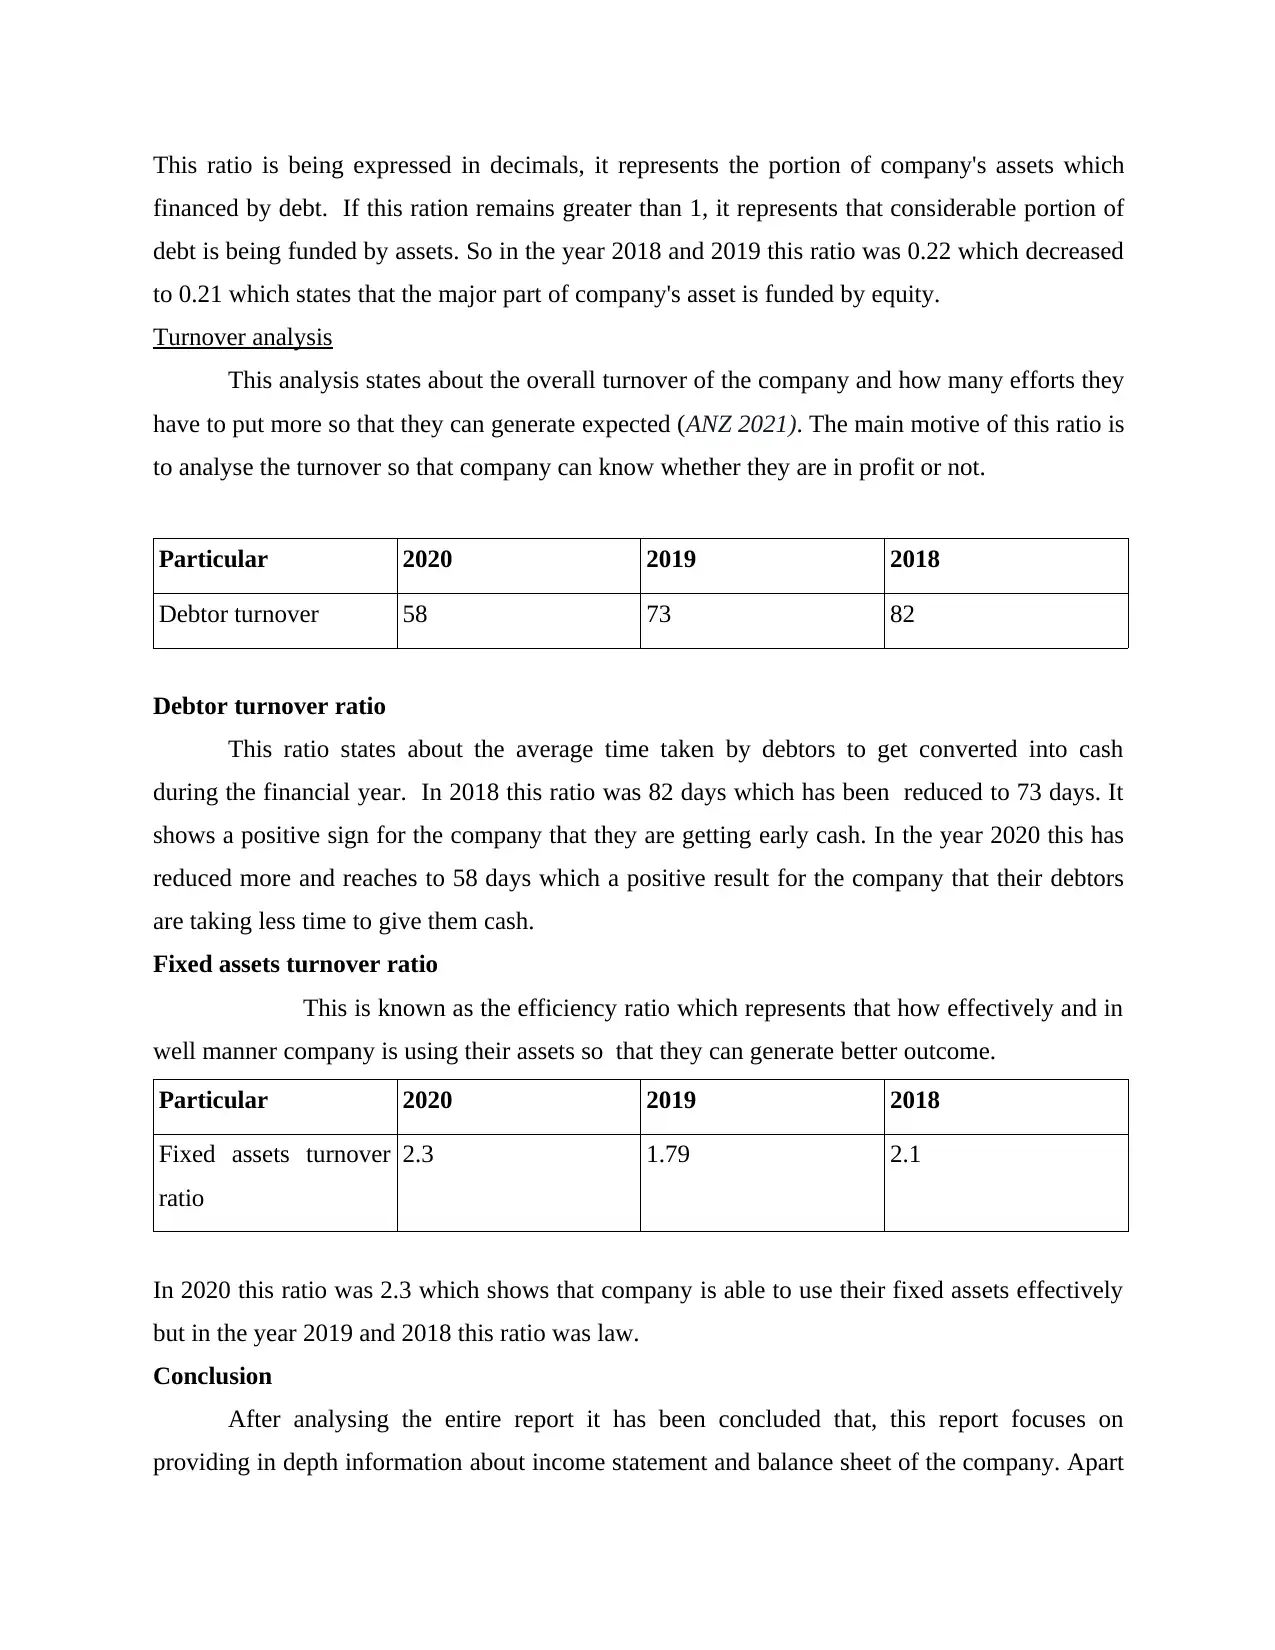
This ratio is being expressed in decimals, it represents the portion of company's assets which
financed by debt. If this ration remains greater than 1, it represents that considerable portion of
debt is being funded by assets. So in the year 2018 and 2019 this ratio was 0.22 which decreased
to 0.21 which states that the major part of company's asset is funded by equity.
Turnover analysis
This analysis states about the overall turnover of the company and how many efforts they
have to put more so that they can generate expected (ANZ 2021). The main motive of this ratio is
to analyse the turnover so that company can know whether they are in profit or not.
Particular 2020 2019 2018
Debtor turnover 58 73 82
Debtor turnover ratio
This ratio states about the average time taken by debtors to get converted into cash
during the financial year. In 2018 this ratio was 82 days which has been reduced to 73 days. It
shows a positive sign for the company that they are getting early cash. In the year 2020 this has
reduced more and reaches to 58 days which a positive result for the company that their debtors
are taking less time to give them cash.
Fixed assets turnover ratio
This is known as the efficiency ratio which represents that how effectively and in
well manner company is using their assets so that they can generate better outcome.
Particular 2020 2019 2018
Fixed assets turnover
ratio
2.3 1.79 2.1
In 2020 this ratio was 2.3 which shows that company is able to use their fixed assets effectively
but in the year 2019 and 2018 this ratio was law.
Conclusion
After analysing the entire report it has been concluded that, this report focuses on
providing in depth information about income statement and balance sheet of the company. Apart
Paraphrase This Document
Need a fresh take? Get an instant paraphrase of this document with our AI Paraphraser

from this, di8fferent ratios such as Return on Asset Profitability analysis Liquidity analysis have
been defined in this report so the company can know their accurate position in the market and
with they help of these ratios company can generate high return and profit.
been defined in this report so the company can know their accurate position in the market and
with they help of these ratios company can generate high return and profit.
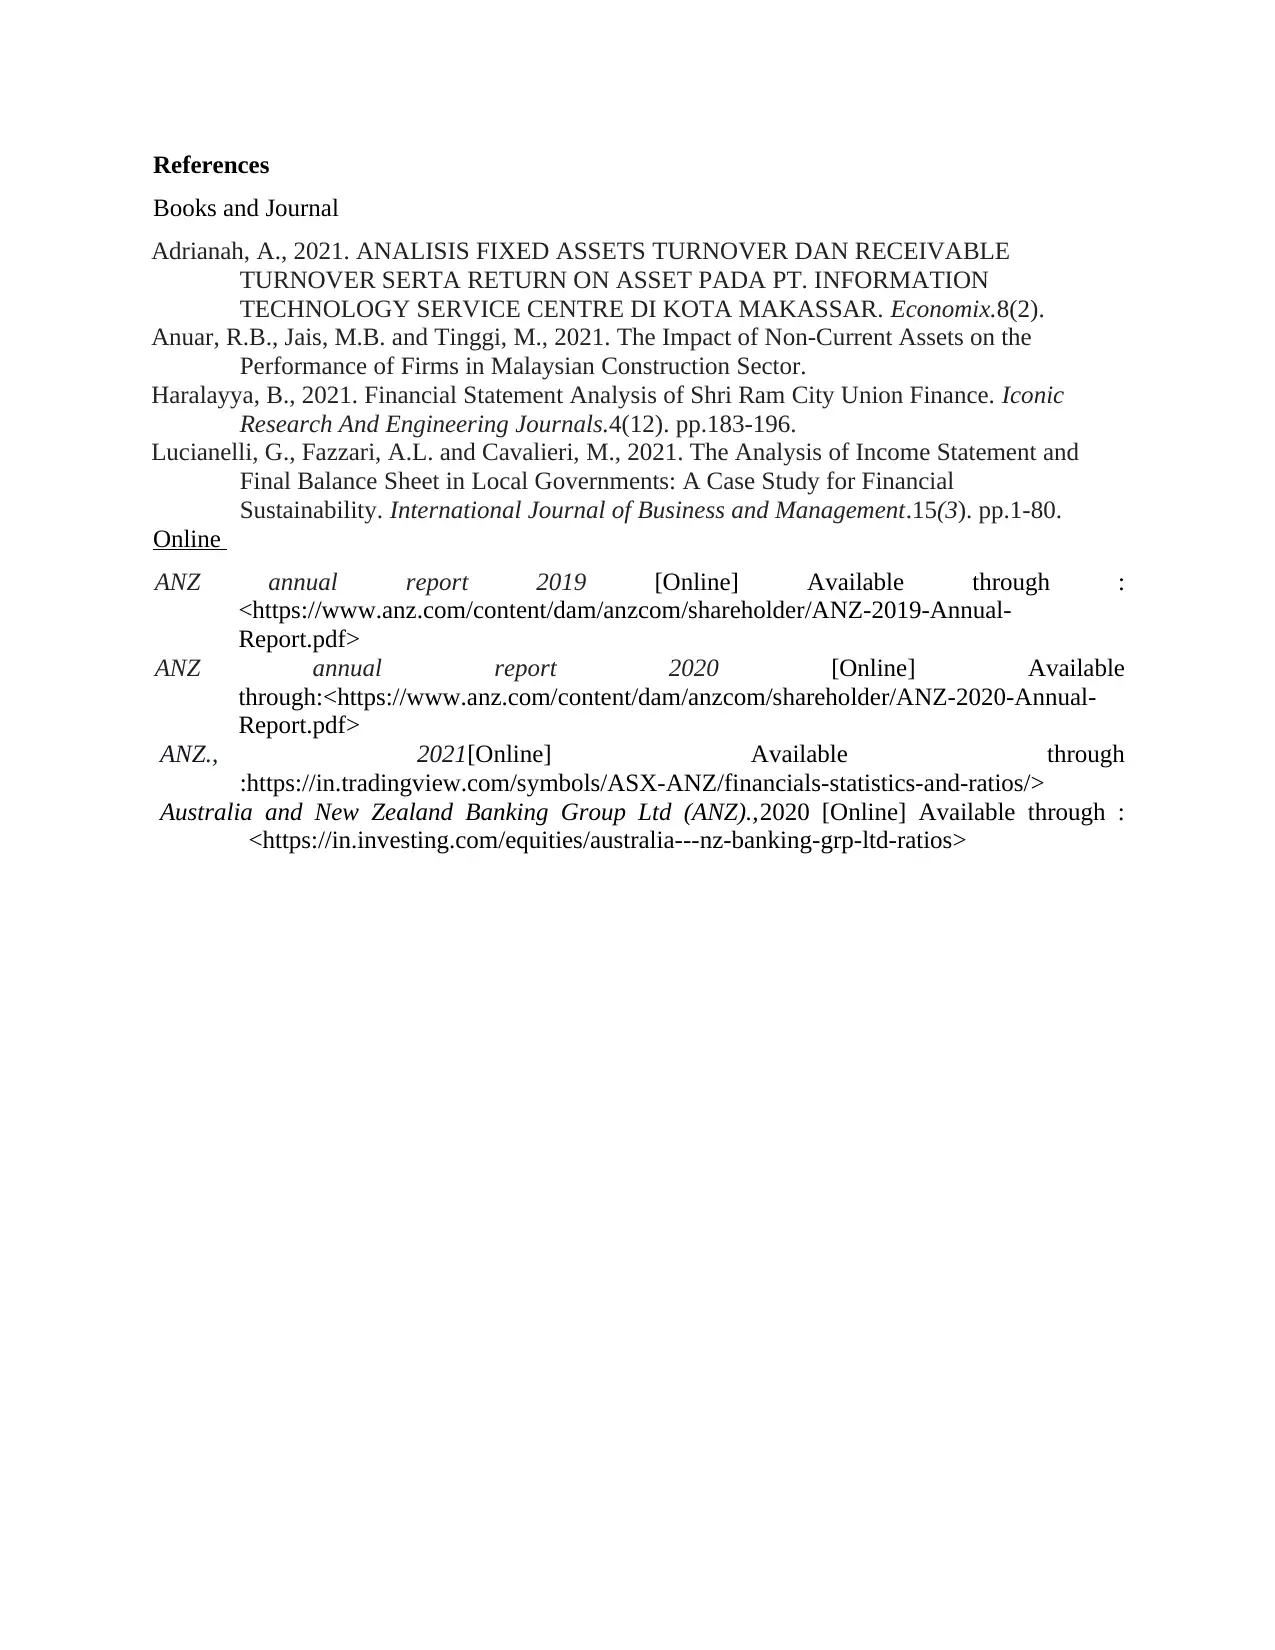
References
Books and Journal
Adrianah, A., 2021. ANALISIS FIXED ASSETS TURNOVER DAN RECEIVABLE
TURNOVER SERTA RETURN ON ASSET PADA PT. INFORMATION
TECHNOLOGY SERVICE CENTRE DI KOTA MAKASSAR. Economix.8(2).
Anuar, R.B., Jais, M.B. and Tinggi, M., 2021. The Impact of Non-Current Assets on the
Performance of Firms in Malaysian Construction Sector.
Haralayya, B., 2021. Financial Statement Analysis of Shri Ram City Union Finance. Iconic
Research And Engineering Journals.4(12). pp.183-196.
Lucianelli, G., Fazzari, A.L. and Cavalieri, M., 2021. The Analysis of Income Statement and
Final Balance Sheet in Local Governments: A Case Study for Financial
Sustainability. International Journal of Business and Management.15(3). pp.1-80.
Online
ANZ annual report 2019 [Online] Available through :
<https://www.anz.com/content/dam/anzcom/shareholder/ANZ-2019-Annual-
Report.pdf>
ANZ annual report 2020 [Online] Available
through:<https://www.anz.com/content/dam/anzcom/shareholder/ANZ-2020-Annual-
Report.pdf>
ANZ., 2021[Online] Available through
:https://in.tradingview.com/symbols/ASX-ANZ/financials-statistics-and-ratios/>
Australia and New Zealand Banking Group Ltd (ANZ).,2020 [Online] Available through :
<https://in.investing.com/equities/australia---nz-banking-grp-ltd-ratios>
⊘ This is a preview!⊘
Do you want full access?
Subscribe today to unlock all pages.
Trusted by 1+ million students worldwide
1 out of 12
Related Documents


Your All-in-One AI-Powered Toolkit for Academic Success.
+13062052269
info@desklib.com
Available 24*7 on WhatsApp / Email
![[object Object]](/_next/static/media/star-bottom.7253800d.svg)
Unlock your academic potential
Copyright © 2020–2026 A2Z Services. All Rights Reserved. Developed and managed by ZUCOL.