Financial Performance Analysis: Tesco vs. Sainsbury - MBA Assignment
VerifiedAdded on 2023/01/17
|34
|6180
|26
Report
AI Summary
This MBA assignment analyzes the financial performance of Tesco and Sainsbury over a five-year period. The report begins with an introduction, followed by a background of both companies within the UK retail industry and their competitive positions. Section 2 conducts a comparative financial performance analysis using profitability, liquidity, and debt management ratios. Section 3 summarizes the analysis, concluding which company is financially stronger and justifying an investment recommendation. Finally, Section 4 identifies the limitations of the ratio analysis and assumptions made. The analysis includes asset utilization, margin analysis, returns, acid test ratio, cash ratio, current ratio, inventory period, accounts receivable period, accounts payable period, gearing ratio, and asset financing ratio. The report aims to provide a comprehensive understanding of the financial health of both companies to make informed investment decisions.
Contribute Materials
Your contribution can guide someone’s learning journey. Share your
documents today.
Running head: MBA-FINANCIAL ANALYSIS AND MANAGEMENT
MBA-Financial Analysis and Management
Name of the Student:
Name of the University:
Author’s Note:
Course ID:
MBA-Financial Analysis and Management
Name of the Student:
Name of the University:
Author’s Note:
Course ID:
Secure Best Marks with AI Grader
Need help grading? Try our AI Grader for instant feedback on your assignments.
1MBA-FINANCIAL ANALYSIS AND MANAGEMENT
Table of Contents
Introduction:....................................................................................................................................2
Section 1: Background of company and position in the industry in respect to its competitors.......2
Section 2: Five-year comparative financial performance analysis using ratios1............................3
Section 3: Summary analysis of which company is financially stronger; state and justify which
company’s shares would you buy..................................................................................................18
Section 4: Identify problems/limitations of the ratio analysis and assumptions you made in
comparative analysis......................................................................................................................20
Conclusion:....................................................................................................................................21
Reference and Bibliography:.........................................................................................................22
Appendices:...................................................................................................................................25
2MBA-FINANCIAL ANALYSIS AND MANAGEMENT
Introduction:
The overall assessment mainly evaluates the financial performance of Tesco and
Sainsbury for the past five financial years. Adequate background evaluation has been conducted
for both the companies in respect to the industry and competitors. The background analysis
directly helps directly helps in detecting competitiveness of both the organization in the current
market. Furthermore, relevant ratios are used for identifying the current financial position of the
company and detect which organization is more profitable. This detection of the adequate
financial position of the organization would eventually help in determining the best investment
option. Lastly, relevant Limitations of the financial ratios are adequately depicted in the
assessment.
Section 1: Background of company and position in the industry in respect to its
competitors
The retail sector of the United Kingdom is considered to be one the major industries,
which can help in generating high level of income from operations. Moreover, Sainsbury and
Tesco are mainly considered to be one of the major players in the retail industry, as their
operations are worldwide and generate high level of income from operations. The British
multinational groceries and general merchandise retailer was founded 100 years ago and has
been successfully operating since. The company has been making adequate profits from
operations, which led to 1,208 million in 2018 (About.sainsburys.co.uk 2019). Sainsbury is
considered to be the third largest chain of supermarkets in United Kingdom, where the overall
operations has been conducted for the past 150 years. The company operations have been
3MBA-FINANCIAL ANALYSIS AND MANAGEMENT
increasing over time, where the current net income for the organisation was at the level of 309
million (Tesco plc 2019).
Both the companies have been one of the major contributors in the retail industry, where
the operations are increasing over the period of time. Hence, from the evaluation, it can be
detected that both the companies are giants in the retail industry where Tesco leads the market
with higher market share and profitability. On the other hand, Sainsbury was the largest retailer
in UK until Tesco gradually started to conquer the market in the late 1990s. The changing
business environment has mainly increased the possibility of new retail companies to flourish,
while both Tesco and Sainsbury has moved their operations from actual retail shop to the virtual
world such a websites and mobile applications.
Section 2: Five-year comparative financial performance analysis using ratios1
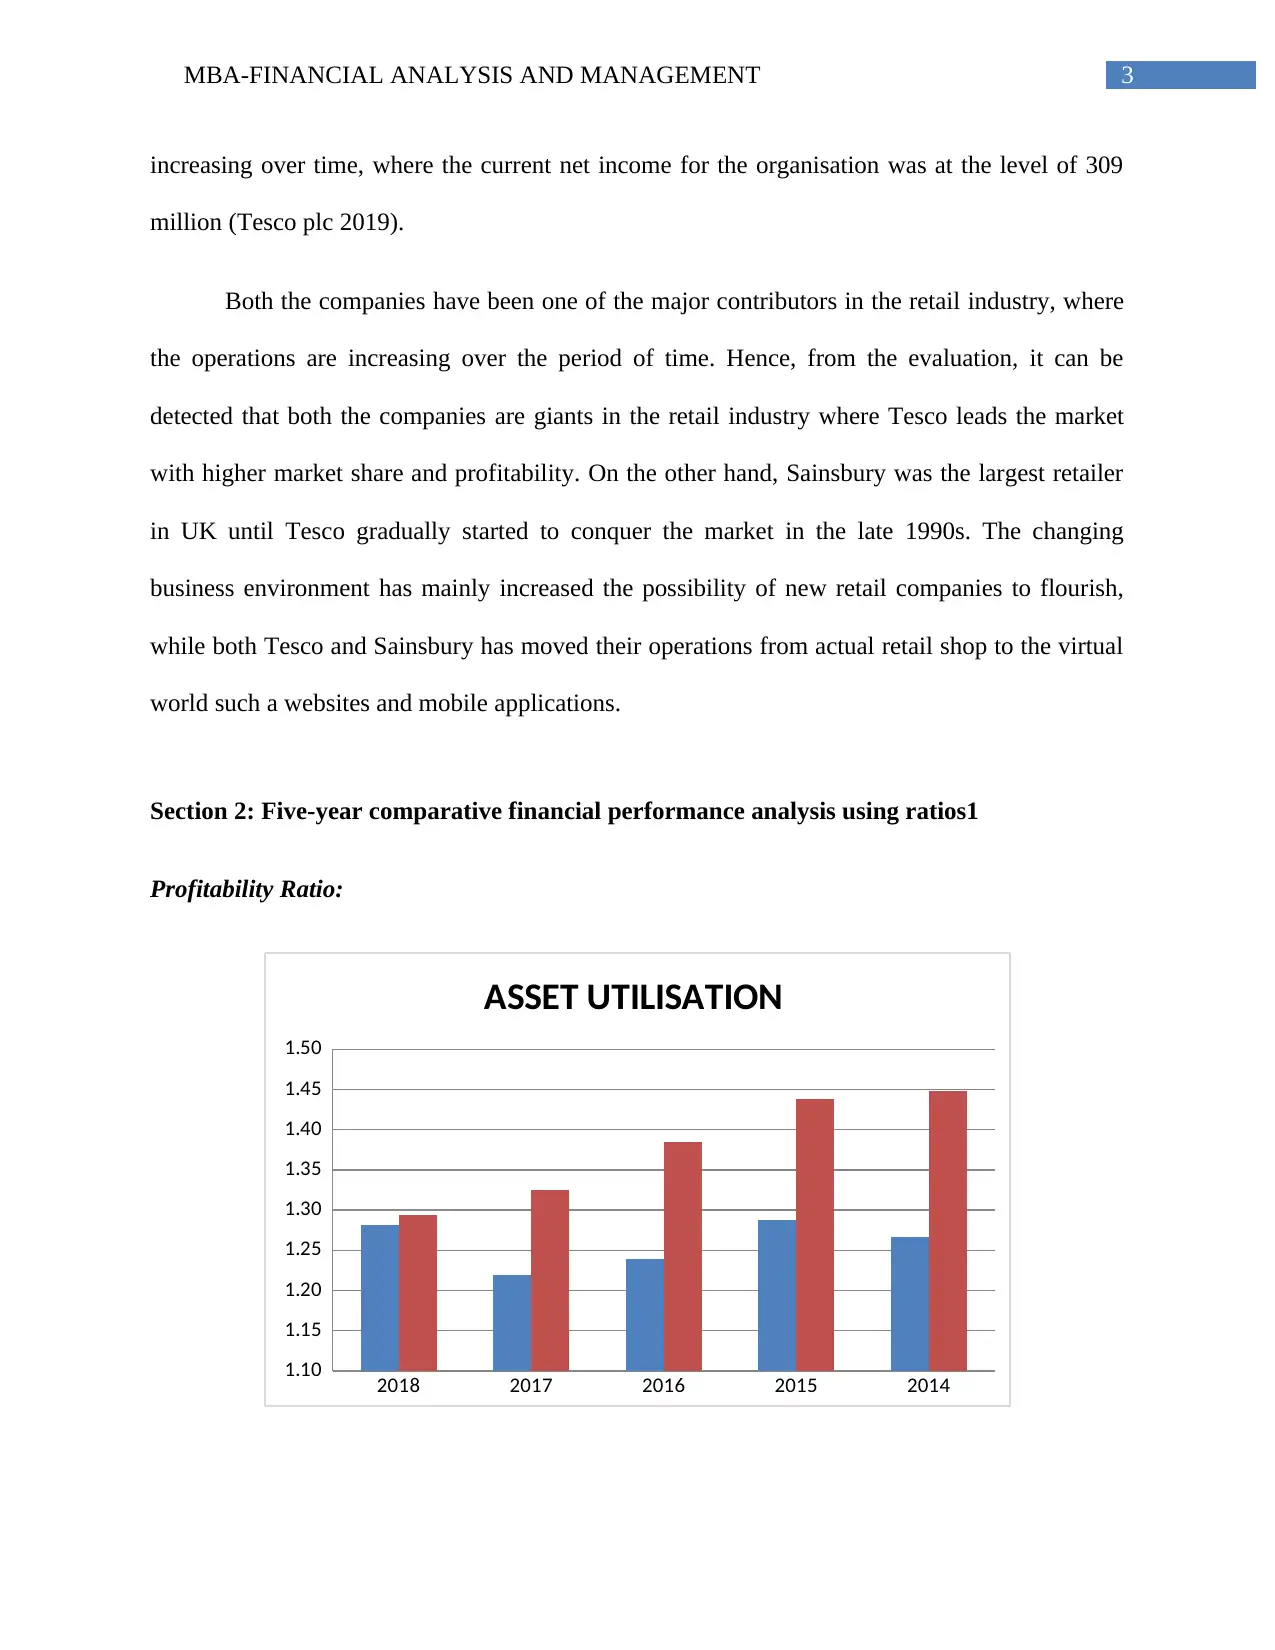
Profitability Ratio:
2018 2017 2016 2015 2014
1.10
1.15
1.20
1.25
1.30
1.35
1.40
1.45
1.50
ASSET UTILISATION
increasing over time, where the current net income for the organisation was at the level of 309
million (Tesco plc 2019).
Both the companies have been one of the major contributors in the retail industry, where
the operations are increasing over the period of time. Hence, from the evaluation, it can be
detected that both the companies are giants in the retail industry where Tesco leads the market
with higher market share and profitability. On the other hand, Sainsbury was the largest retailer
in UK until Tesco gradually started to conquer the market in the late 1990s. The changing
business environment has mainly increased the possibility of new retail companies to flourish,
while both Tesco and Sainsbury has moved their operations from actual retail shop to the virtual
world such a websites and mobile applications.
Section 2: Five-year comparative financial performance analysis using ratios1
Profitability Ratio:
2018 2017 2016 2015 2014
1.10
1.15
1.20
1.25
1.30
1.35
1.40
1.45
1.50
ASSET UTILISATION
Secure Best Marks with AI Grader
Need help grading? Try our AI Grader for instant feedback on your assignments.
4MBA-FINANCIAL ANALYSIS AND MANAGEMENT
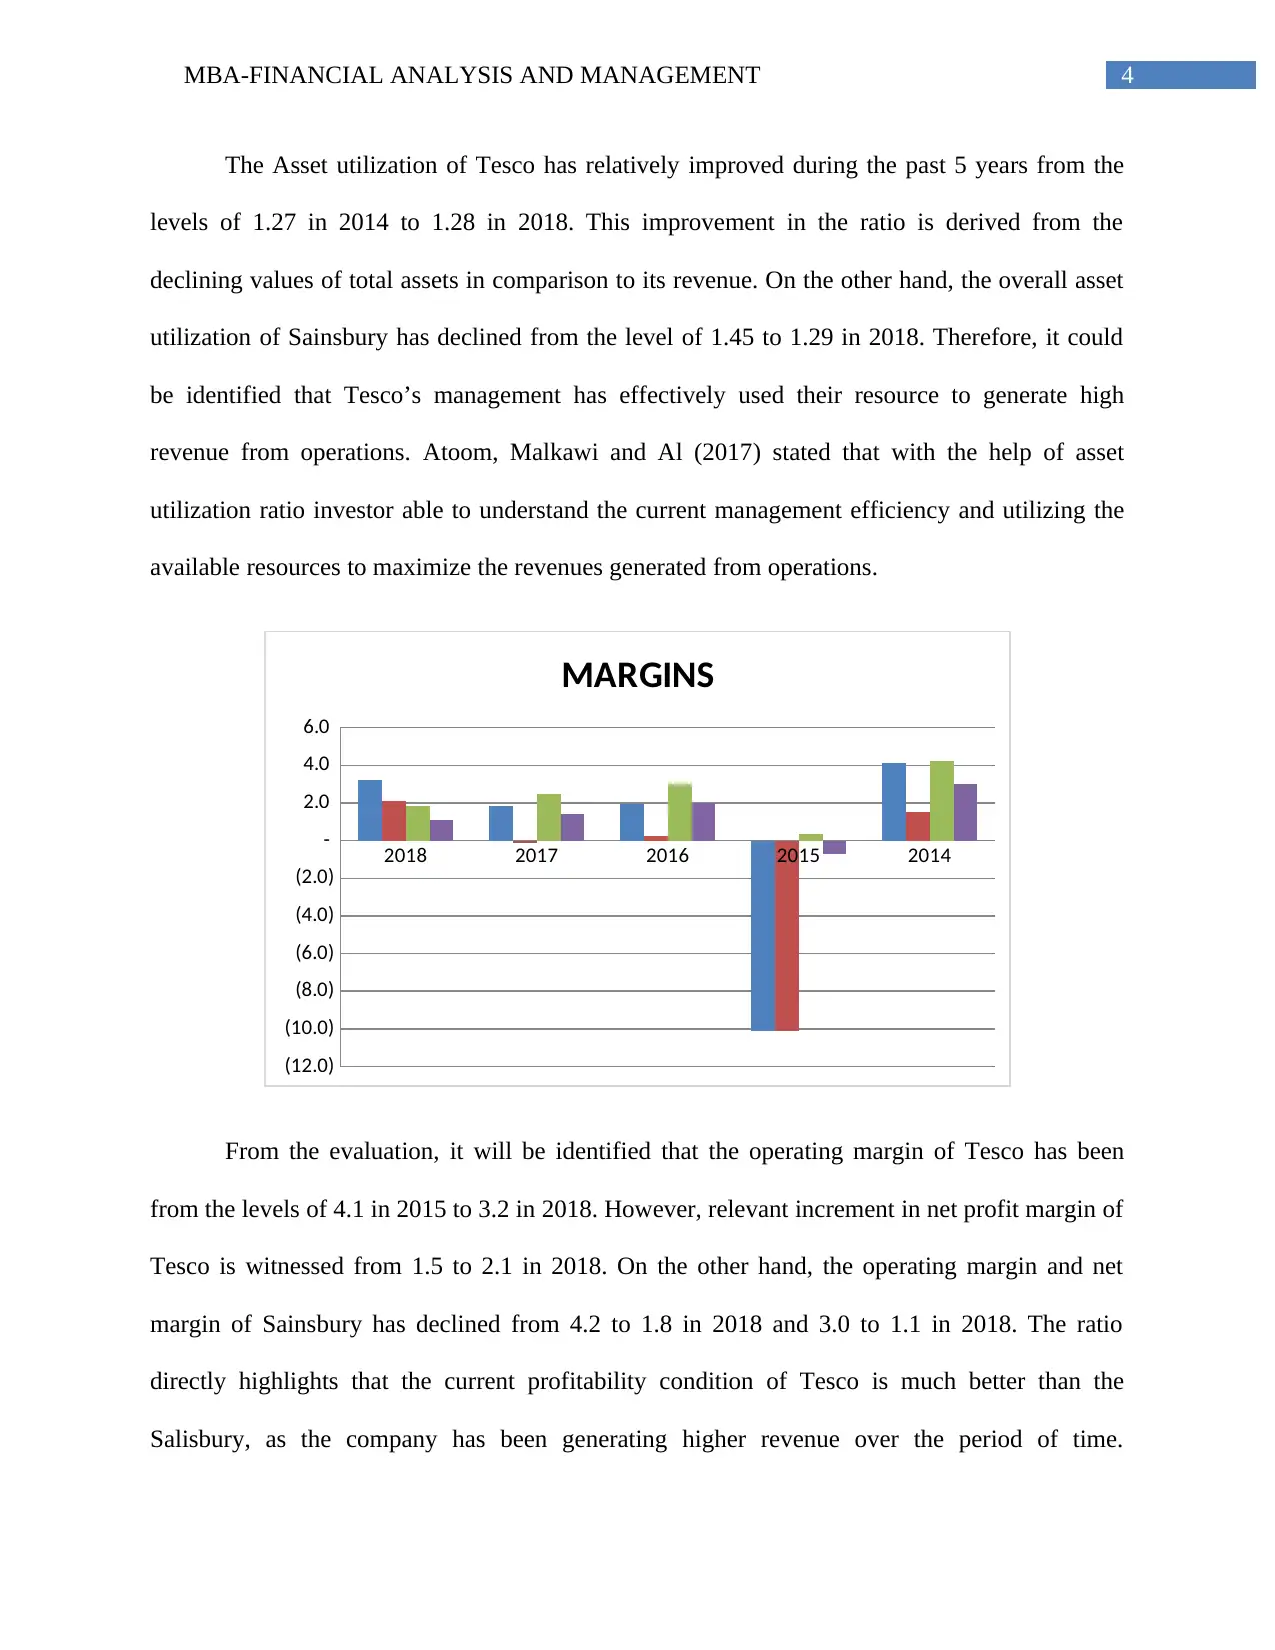
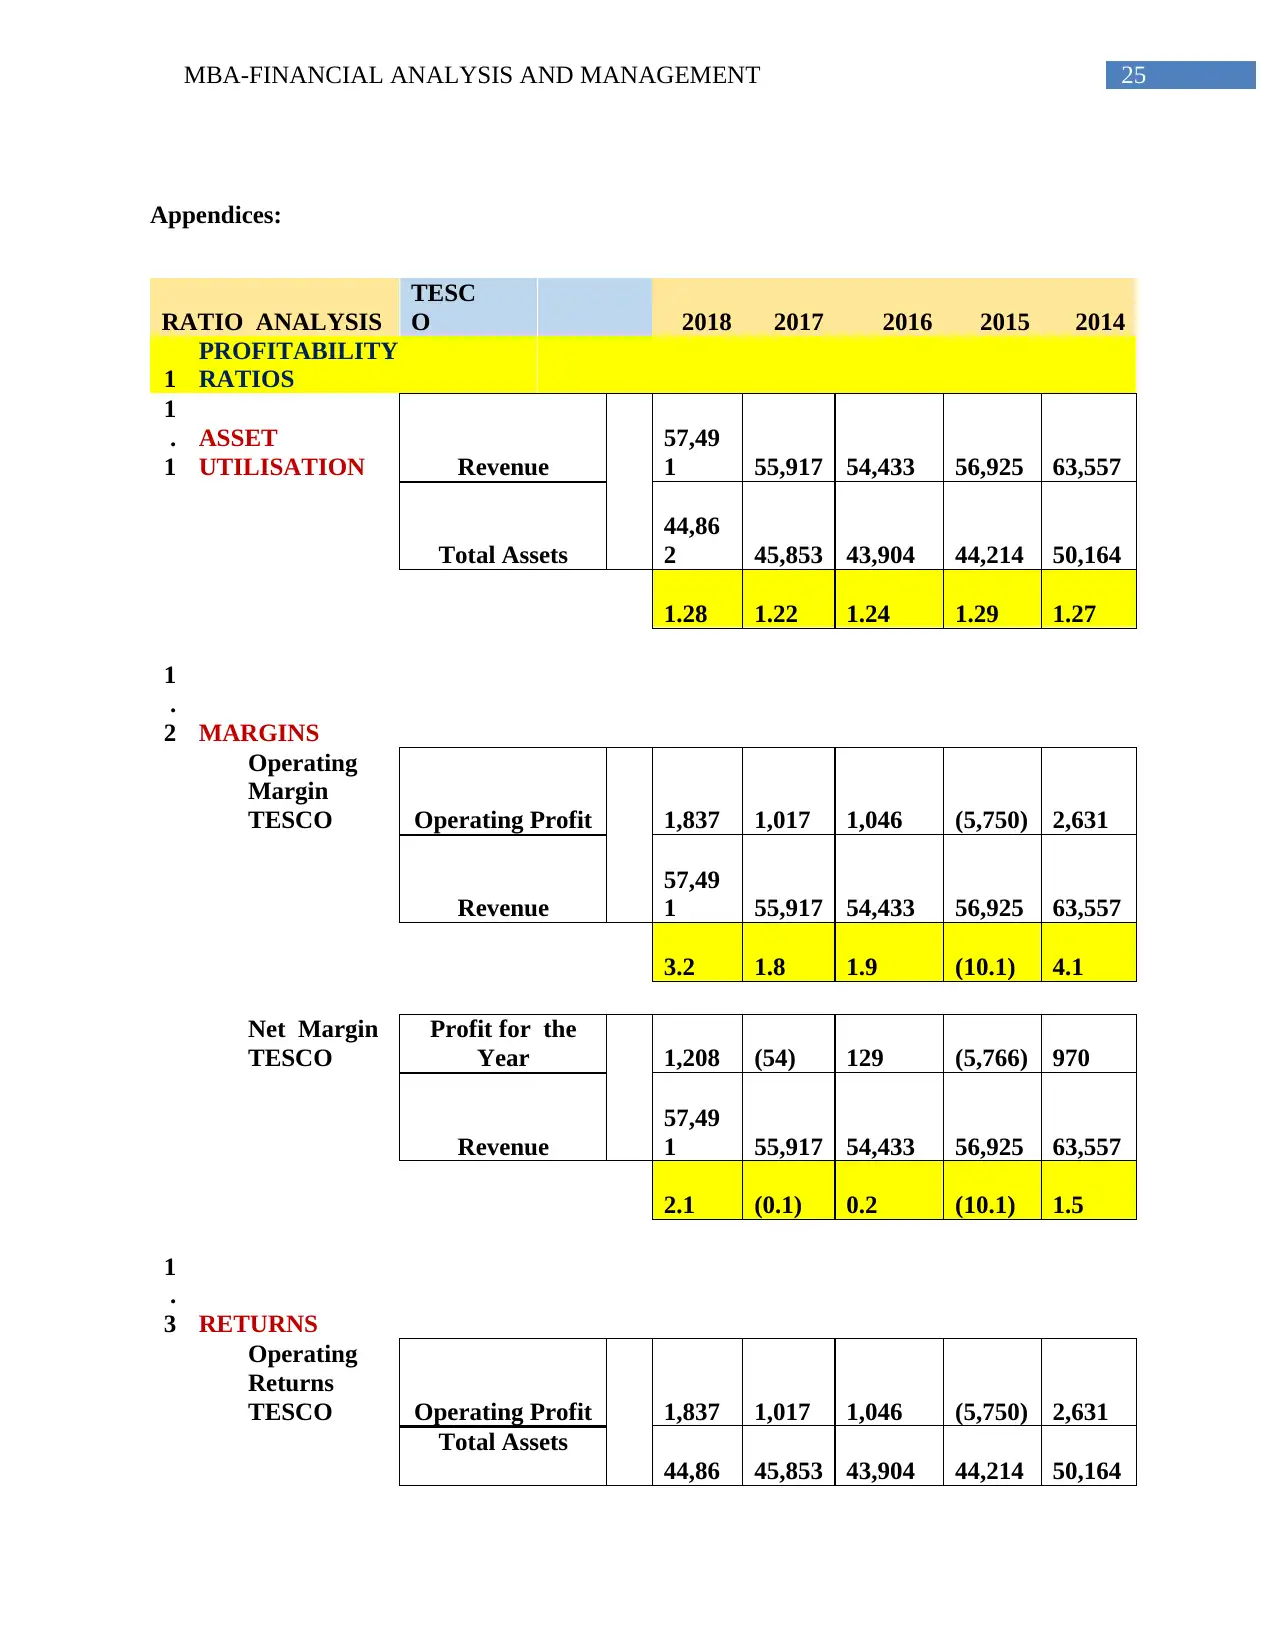
The Asset utilization of Tesco has relatively improved during the past 5 years from the
levels of 1.27 in 2014 to 1.28 in 2018. This improvement in the ratio is derived from the
declining values of total assets in comparison to its revenue. On the other hand, the overall asset
utilization of Sainsbury has declined from the level of 1.45 to 1.29 in 2018. Therefore, it could
be identified that Tesco’s management has effectively used their resource to generate high
revenue from operations. Atoom, Malkawi and Al (2017) stated that with the help of asset
utilization ratio investor able to understand the current management efficiency and utilizing the
available resources to maximize the revenues generated from operations.
2018 2017 2016 2015 2014
(12.0)
(10.0)
(8.0)
(6.0)
(4.0)
(2.0)
-
2.0
4.0
6.0
MARGINS
From the evaluation, it will be identified that the operating margin of Tesco has been
from the levels of 4.1 in 2015 to 3.2 in 2018. However, relevant increment in net profit margin of
Tesco is witnessed from 1.5 to 2.1 in 2018. On the other hand, the operating margin and net
margin of Sainsbury has declined from 4.2 to 1.8 in 2018 and 3.0 to 1.1 in 2018. The ratio
directly highlights that the current profitability condition of Tesco is much better than the
Salisbury, as the company has been generating higher revenue over the period of time.
5MBA-FINANCIAL ANALYSIS AND MANAGEMENT
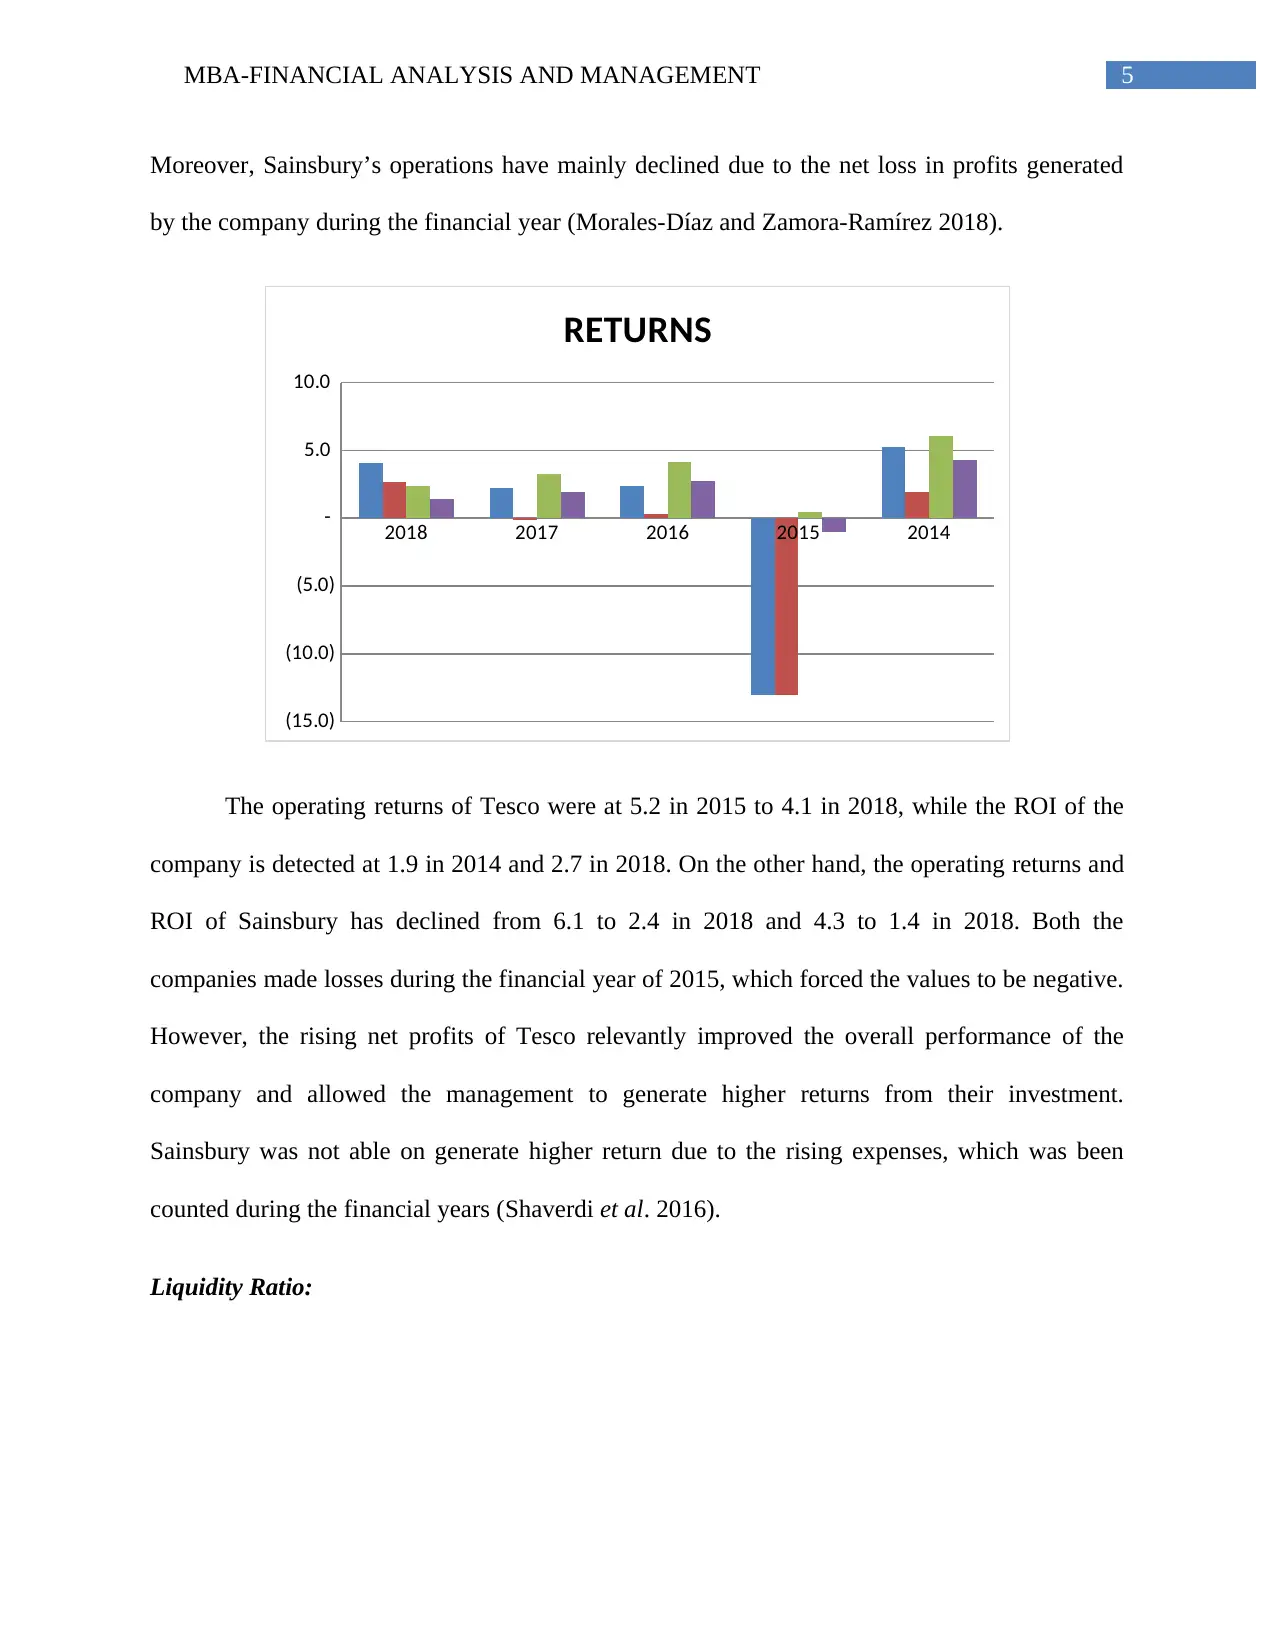
Moreover, Sainsbury’s operations have mainly declined due to the net loss in profits generated
by the company during the financial year (Morales-Díaz and Zamora-Ramírez 2018).
2018 2017 2016 2015 2014
(15.0)
(10.0)
(5.0)
-
5.0
10.0
RETURNS
The operating returns of Tesco were at 5.2 in 2015 to 4.1 in 2018, while the ROI of the
company is detected at 1.9 in 2014 and 2.7 in 2018. On the other hand, the operating returns and
ROI of Sainsbury has declined from 6.1 to 2.4 in 2018 and 4.3 to 1.4 in 2018. Both the
companies made losses during the financial year of 2015, which forced the values to be negative.
However, the rising net profits of Tesco relevantly improved the overall performance of the
company and allowed the management to generate higher returns from their investment.
Sainsbury was not able on generate higher return due to the rising expenses, which was been
counted during the financial years (Shaverdi et al. 2016).
Liquidity Ratio:
6MBA-FINANCIAL ANALYSIS AND MANAGEMENT
2018 2017 2016 2015 2014
-
5.0
10.0
15.0
20.0
25.0
30.0
35.0
Acid Test Ratio
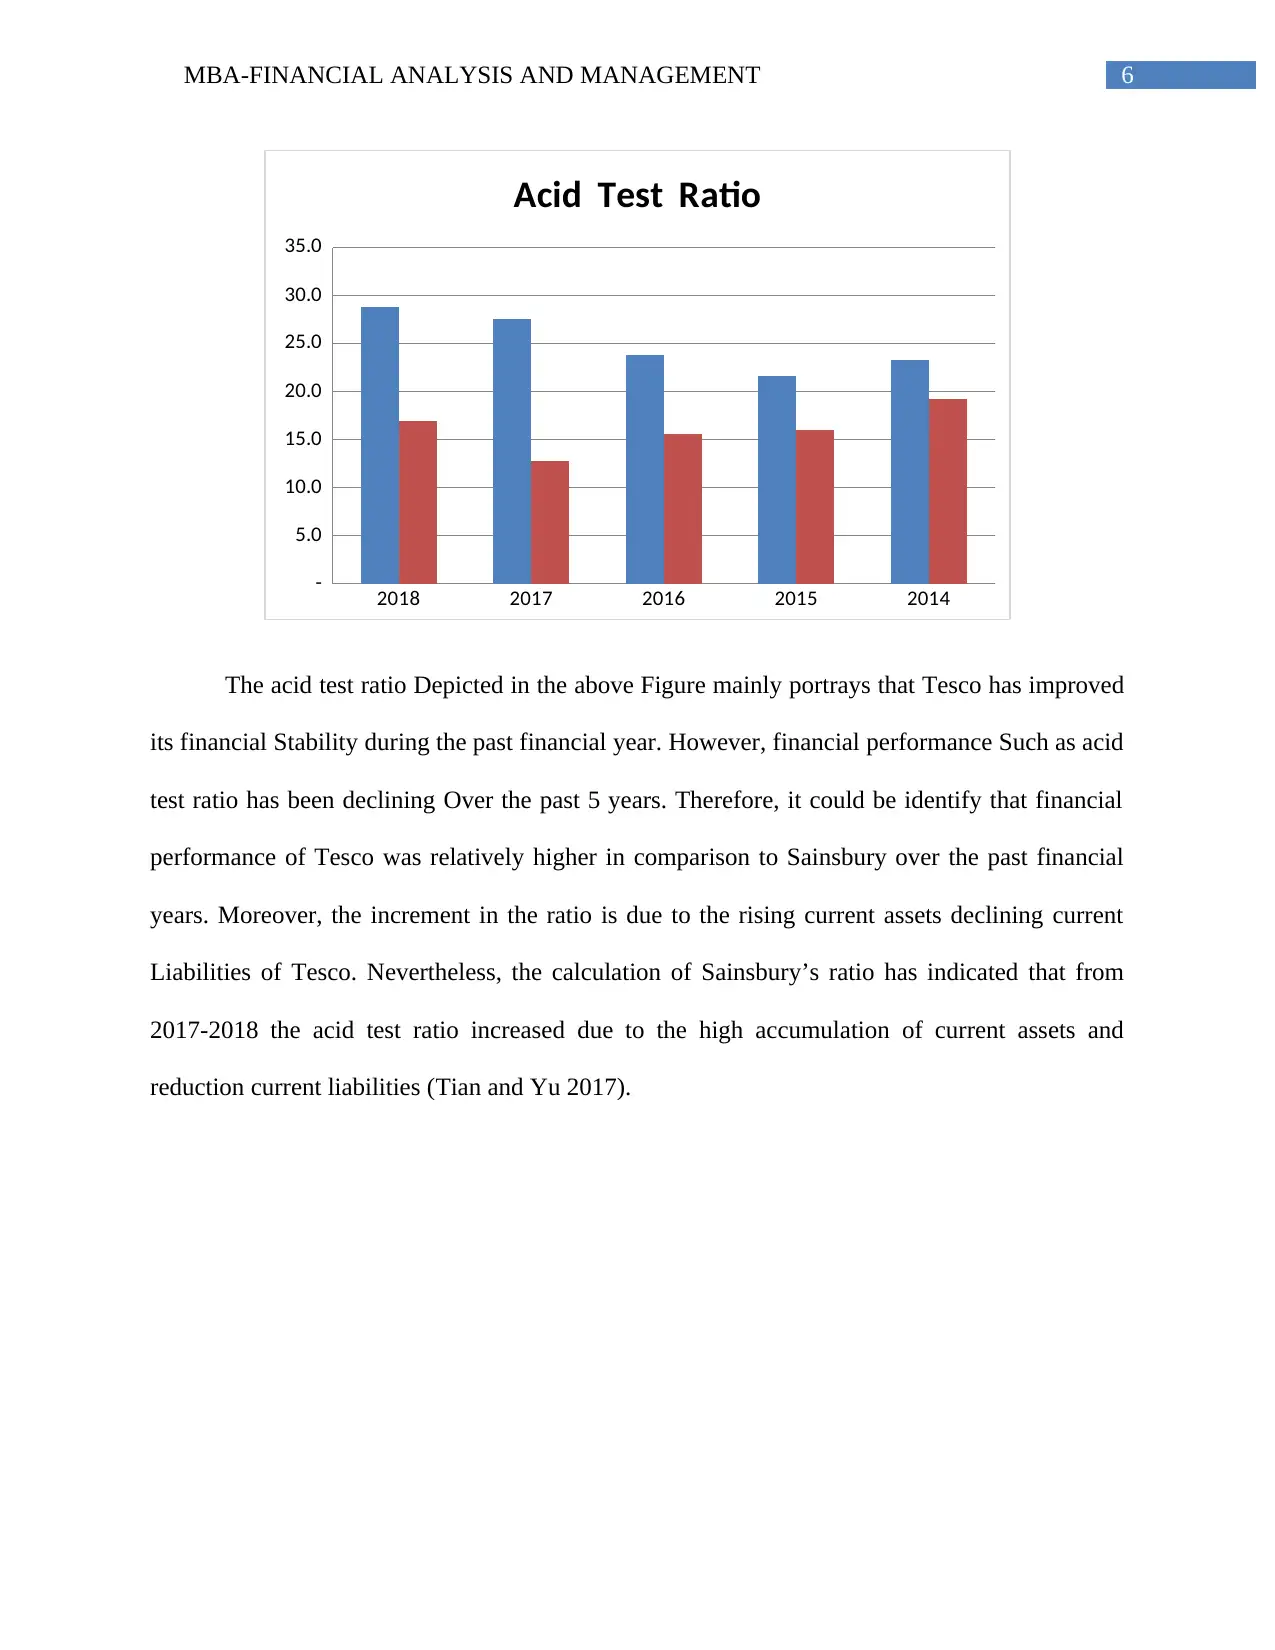
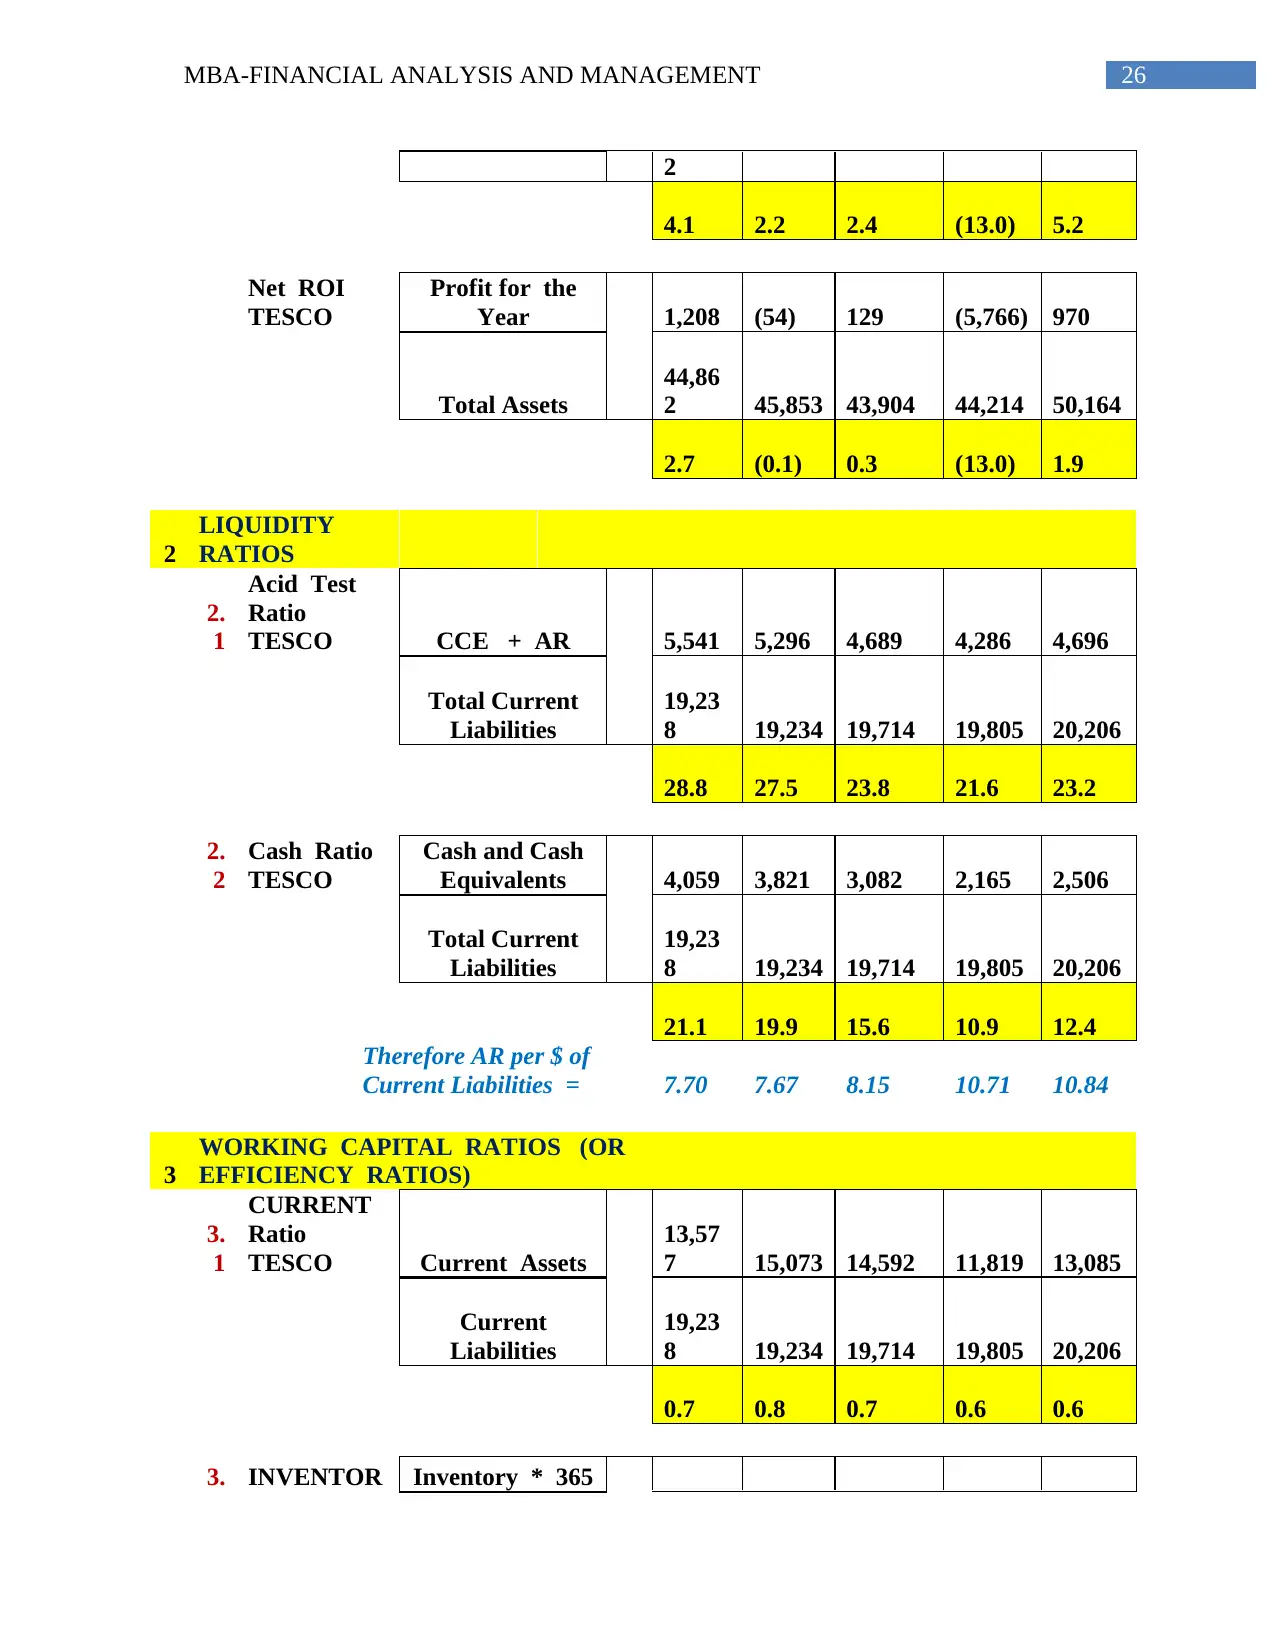
The acid test ratio Depicted in the above Figure mainly portrays that Tesco has improved
its financial Stability during the past financial year. However, financial performance Such as acid
test ratio has been declining Over the past 5 years. Therefore, it could be identify that financial
performance of Tesco was relatively higher in comparison to Sainsbury over the past financial
years. Moreover, the increment in the ratio is due to the rising current assets declining current
Liabilities of Tesco. Nevertheless, the calculation of Sainsbury’s ratio has indicated that from
2017-2018 the acid test ratio increased due to the high accumulation of current assets and
reduction current liabilities (Tian and Yu 2017).
2018 2017 2016 2015 2014
-
5.0
10.0
15.0
20.0
25.0
30.0
35.0
Acid Test Ratio
The acid test ratio Depicted in the above Figure mainly portrays that Tesco has improved
its financial Stability during the past financial year. However, financial performance Such as acid
test ratio has been declining Over the past 5 years. Therefore, it could be identify that financial
performance of Tesco was relatively higher in comparison to Sainsbury over the past financial
years. Moreover, the increment in the ratio is due to the rising current assets declining current
Liabilities of Tesco. Nevertheless, the calculation of Sainsbury’s ratio has indicated that from
2017-2018 the acid test ratio increased due to the high accumulation of current assets and
reduction current liabilities (Tian and Yu 2017).
Paraphrase This Document
Need a fresh take? Get an instant paraphrase of this document with our AI Paraphraser
7MBA-FINANCIAL ANALYSIS AND MANAGEMENT
2018 2017 2016 2015 2014
-
5.0
10.0
15.0
20.0
25.0
Cash Ratio
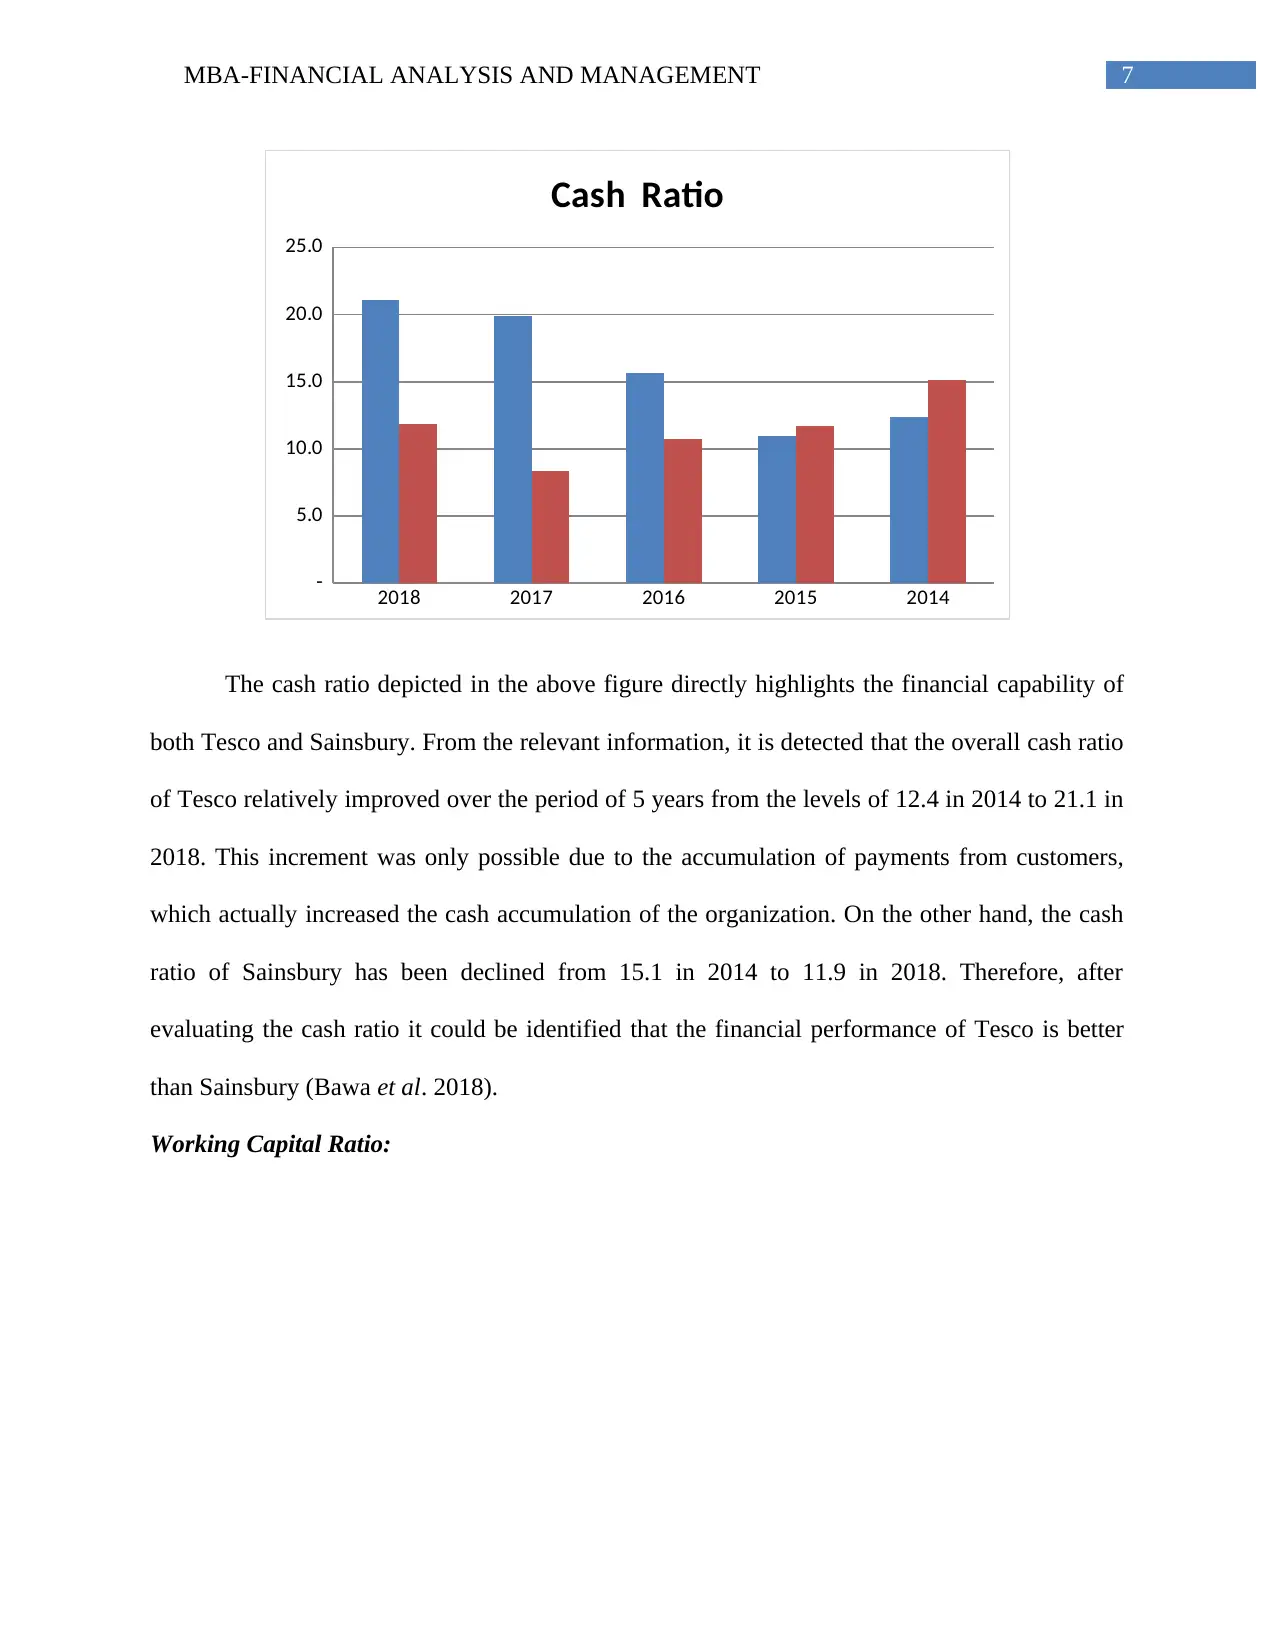
The cash ratio depicted in the above figure directly highlights the financial capability of
both Tesco and Sainsbury. From the relevant information, it is detected that the overall cash ratio
of Tesco relatively improved over the period of 5 years from the levels of 12.4 in 2014 to 21.1 in
2018. This increment was only possible due to the accumulation of payments from customers,
which actually increased the cash accumulation of the organization. On the other hand, the cash
ratio of Sainsbury has been declined from 15.1 in 2014 to 11.9 in 2018. Therefore, after
evaluating the cash ratio it could be identified that the financial performance of Tesco is better
than Sainsbury (Bawa et al. 2018).
Working Capital Ratio:
2018 2017 2016 2015 2014
-
5.0
10.0
15.0
20.0
25.0
Cash Ratio
The cash ratio depicted in the above figure directly highlights the financial capability of
both Tesco and Sainsbury. From the relevant information, it is detected that the overall cash ratio
of Tesco relatively improved over the period of 5 years from the levels of 12.4 in 2014 to 21.1 in
2018. This increment was only possible due to the accumulation of payments from customers,
which actually increased the cash accumulation of the organization. On the other hand, the cash
ratio of Sainsbury has been declined from 15.1 in 2014 to 11.9 in 2018. Therefore, after
evaluating the cash ratio it could be identified that the financial performance of Tesco is better
than Sainsbury (Bawa et al. 2018).
Working Capital Ratio:
8MBA-FINANCIAL ANALYSIS AND MANAGEMENT
2018 2017 2016 2015 2014
-
0.1
0.2
0.3
0.4
0.5
0.6
0.7
0.8
0.9
Current Ratio
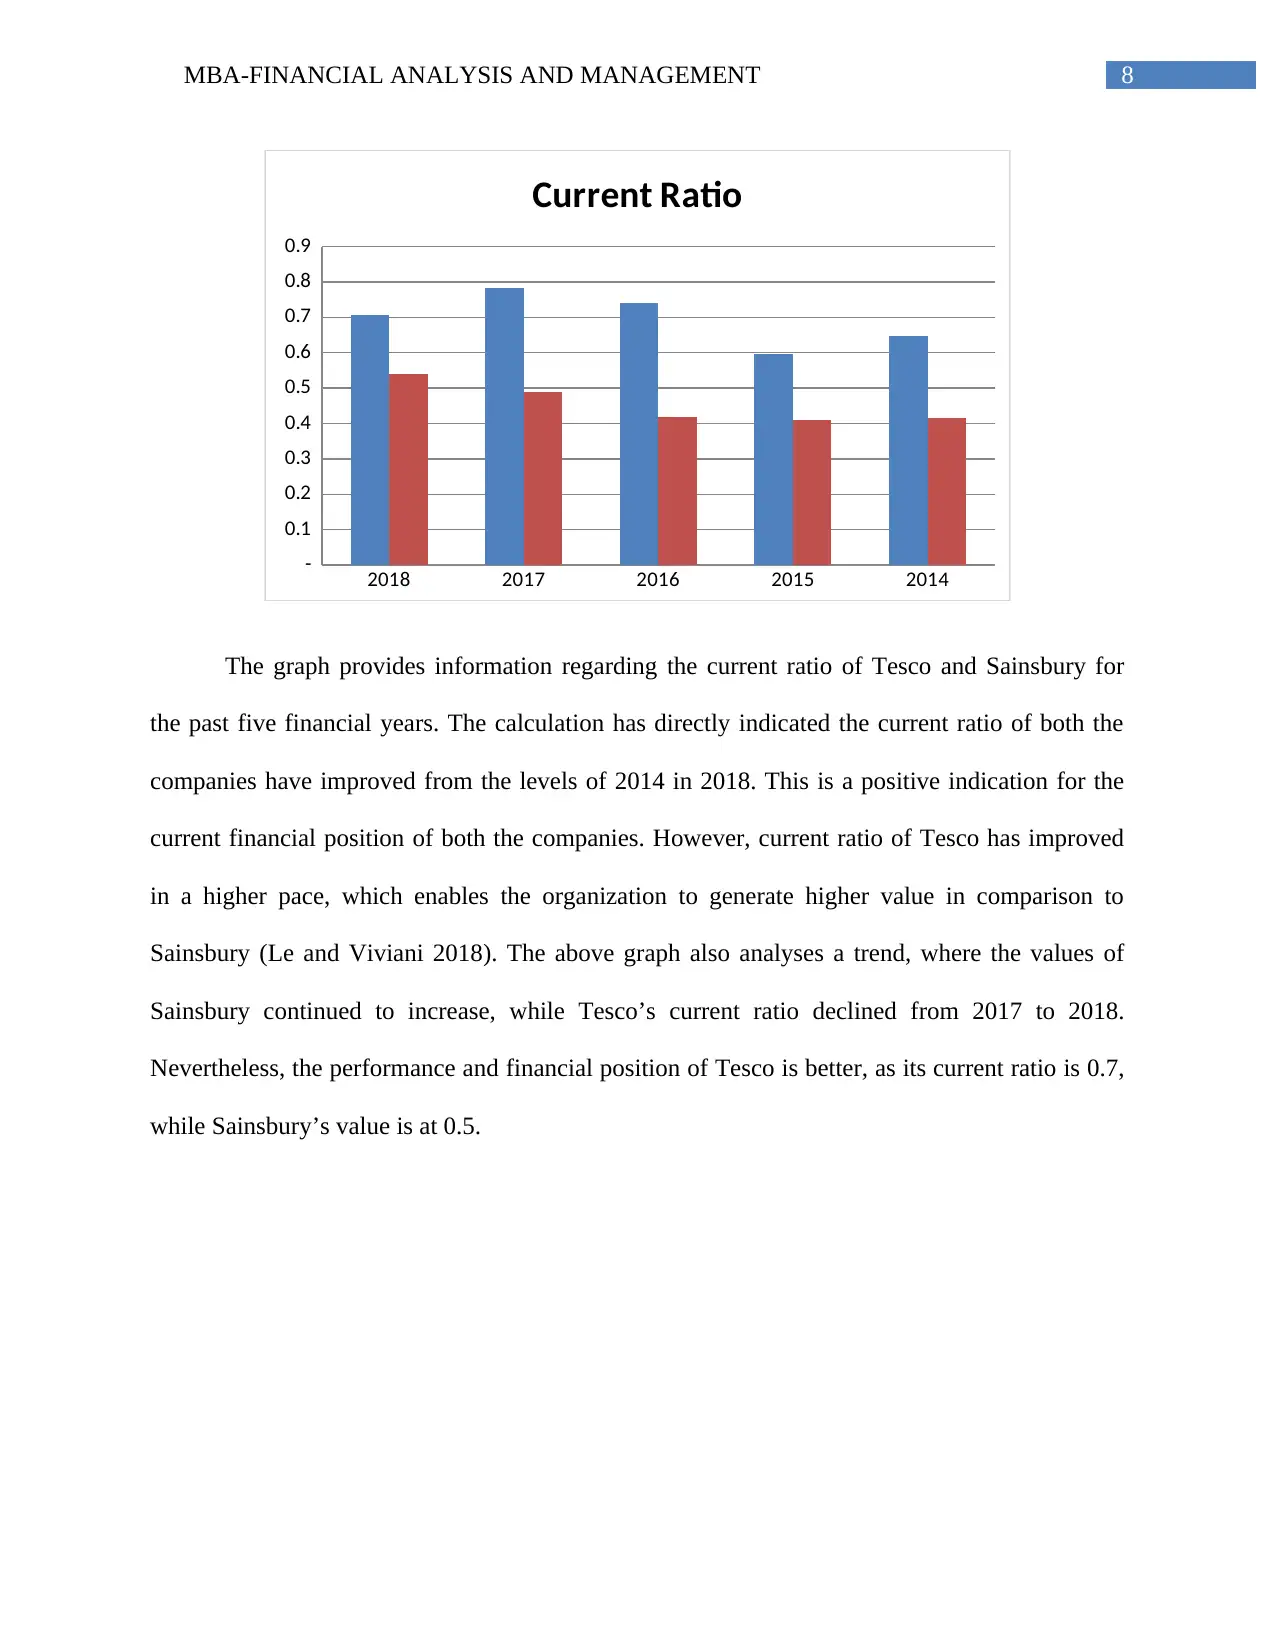
The graph provides information regarding the current ratio of Tesco and Sainsbury for
the past five financial years. The calculation has directly indicated the current ratio of both the
companies have improved from the levels of 2014 in 2018. This is a positive indication for the
current financial position of both the companies. However, current ratio of Tesco has improved
in a higher pace, which enables the organization to generate higher value in comparison to
Sainsbury (Le and Viviani 2018). The above graph also analyses a trend, where the values of
Sainsbury continued to increase, while Tesco’s current ratio declined from 2017 to 2018.
Nevertheless, the performance and financial position of Tesco is better, as its current ratio is 0.7,
while Sainsbury’s value is at 0.5.
2018 2017 2016 2015 2014
-
0.1
0.2
0.3
0.4
0.5
0.6
0.7
0.8
0.9
Current Ratio
The graph provides information regarding the current ratio of Tesco and Sainsbury for
the past five financial years. The calculation has directly indicated the current ratio of both the
companies have improved from the levels of 2014 in 2018. This is a positive indication for the
current financial position of both the companies. However, current ratio of Tesco has improved
in a higher pace, which enables the organization to generate higher value in comparison to
Sainsbury (Le and Viviani 2018). The above graph also analyses a trend, where the values of
Sainsbury continued to increase, while Tesco’s current ratio declined from 2017 to 2018.
Nevertheless, the performance and financial position of Tesco is better, as its current ratio is 0.7,
while Sainsbury’s value is at 0.5.
9MBA-FINANCIAL ANALYSIS AND MANAGEMENT
2018 2017 2016 2015 2014
-
5.0
10.0
15.0
20.0
25.0
30.0
INVENTORY PERIOD
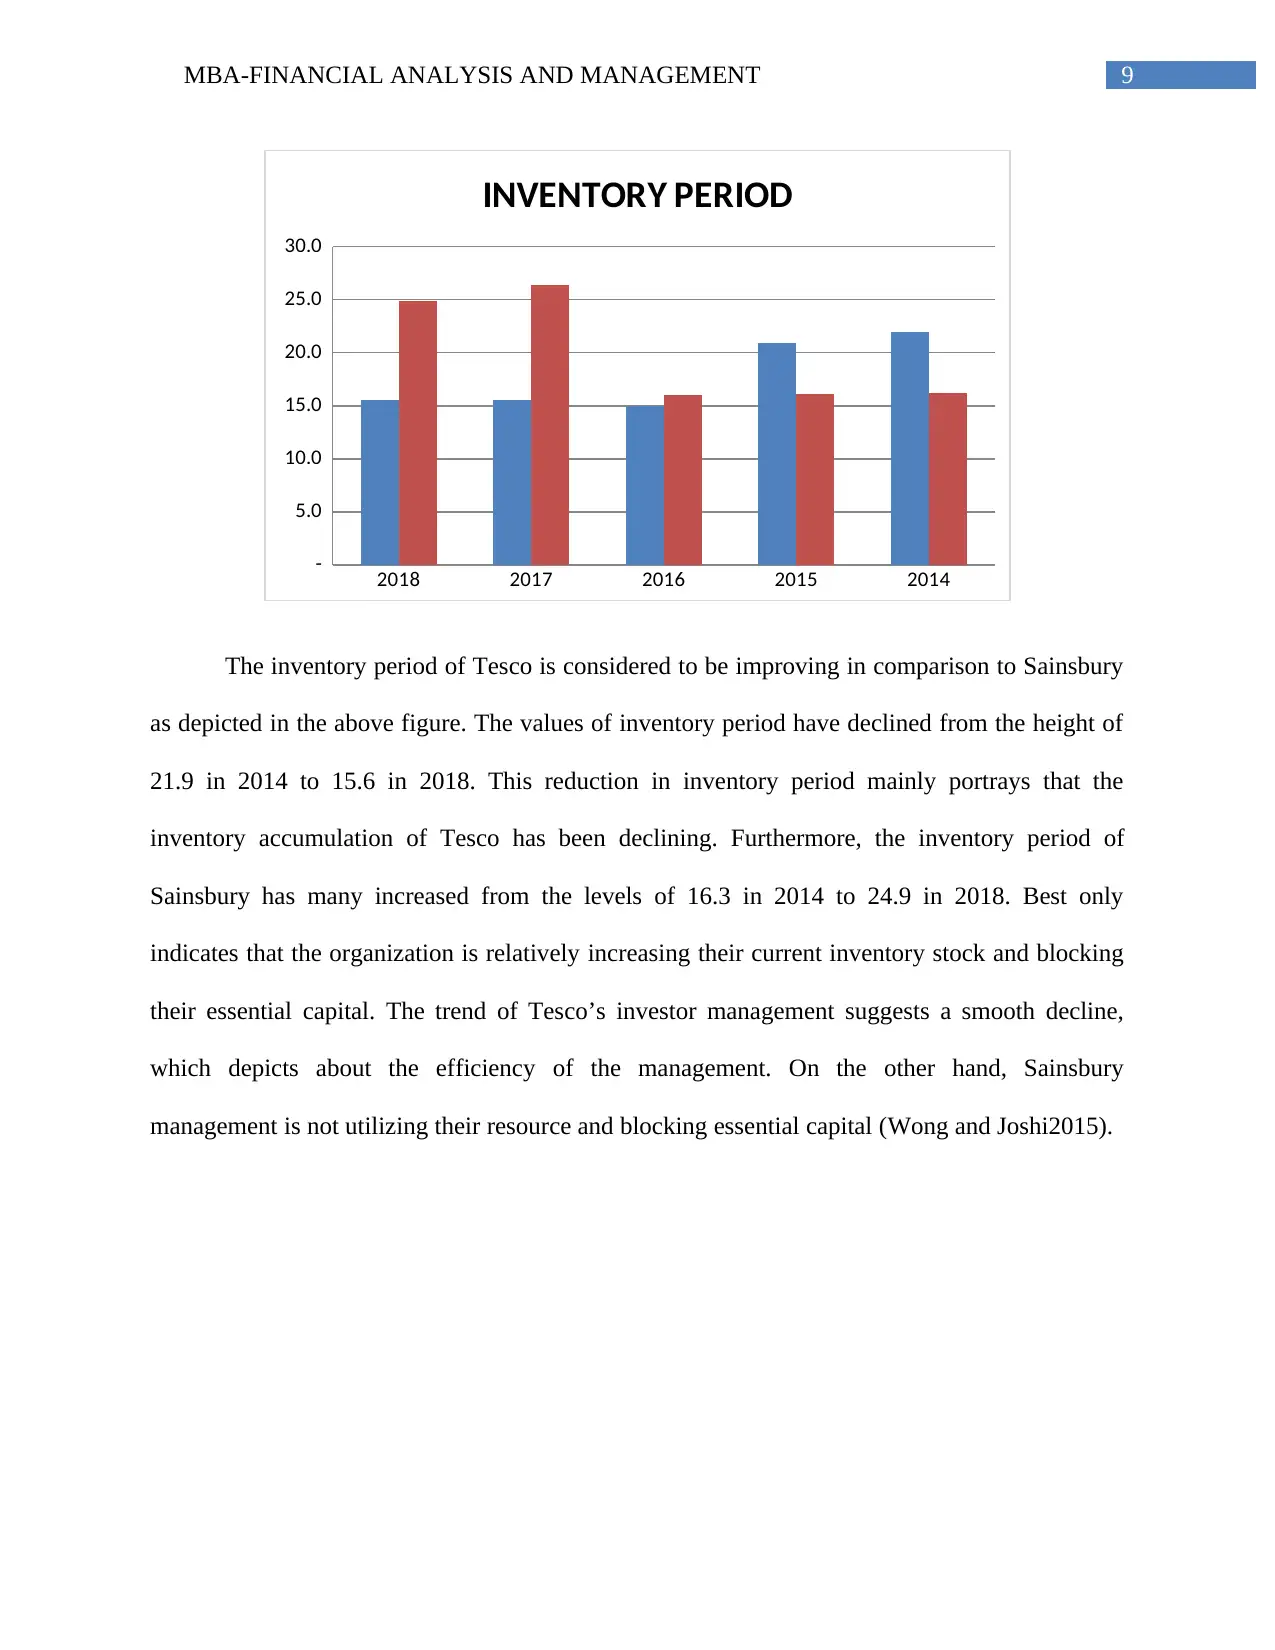
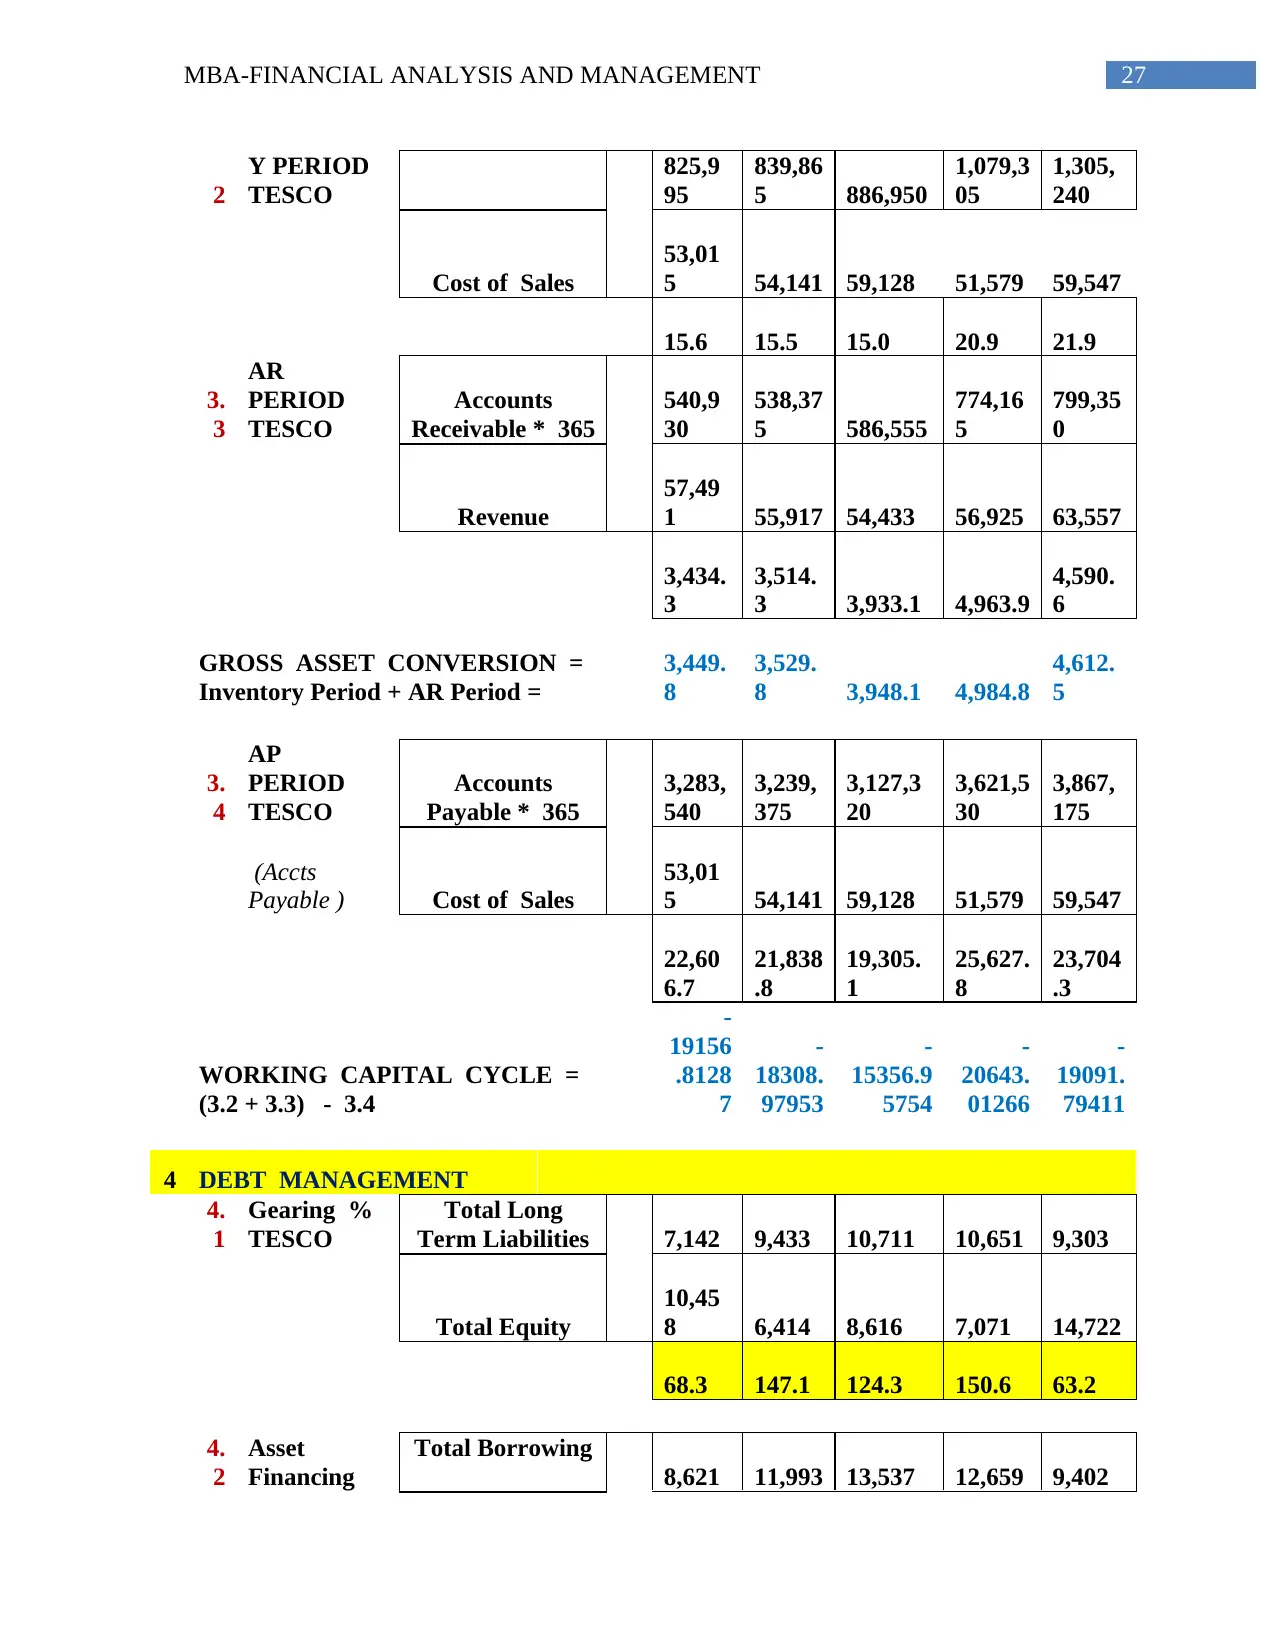
The inventory period of Tesco is considered to be improving in comparison to Sainsbury
as depicted in the above figure. The values of inventory period have declined from the height of
21.9 in 2014 to 15.6 in 2018. This reduction in inventory period mainly portrays that the
inventory accumulation of Tesco has been declining. Furthermore, the inventory period of
Sainsbury has many increased from the levels of 16.3 in 2014 to 24.9 in 2018. Best only
indicates that the organization is relatively increasing their current inventory stock and blocking
their essential capital. The trend of Tesco’s investor management suggests a smooth decline,
which depicts about the efficiency of the management. On the other hand, Sainsbury
management is not utilizing their resource and blocking essential capital (Wong and Joshi2015).
2018 2017 2016 2015 2014
-
5.0
10.0
15.0
20.0
25.0
30.0
INVENTORY PERIOD
The inventory period of Tesco is considered to be improving in comparison to Sainsbury
as depicted in the above figure. The values of inventory period have declined from the height of
21.9 in 2014 to 15.6 in 2018. This reduction in inventory period mainly portrays that the
inventory accumulation of Tesco has been declining. Furthermore, the inventory period of
Sainsbury has many increased from the levels of 16.3 in 2014 to 24.9 in 2018. Best only
indicates that the organization is relatively increasing their current inventory stock and blocking
their essential capital. The trend of Tesco’s investor management suggests a smooth decline,
which depicts about the efficiency of the management. On the other hand, Sainsbury
management is not utilizing their resource and blocking essential capital (Wong and Joshi2015).
Secure Best Marks with AI Grader
Need help grading? Try our AI Grader for instant feedback on your assignments.
10MBA-FINANCIAL ANALYSIS AND MANAGEMENT
2018 2017 2016 2015 2014
-
1,000.0
2,000.0
3,000.0
4,000.0
5,000.0
6,000.0
AR PERIOD
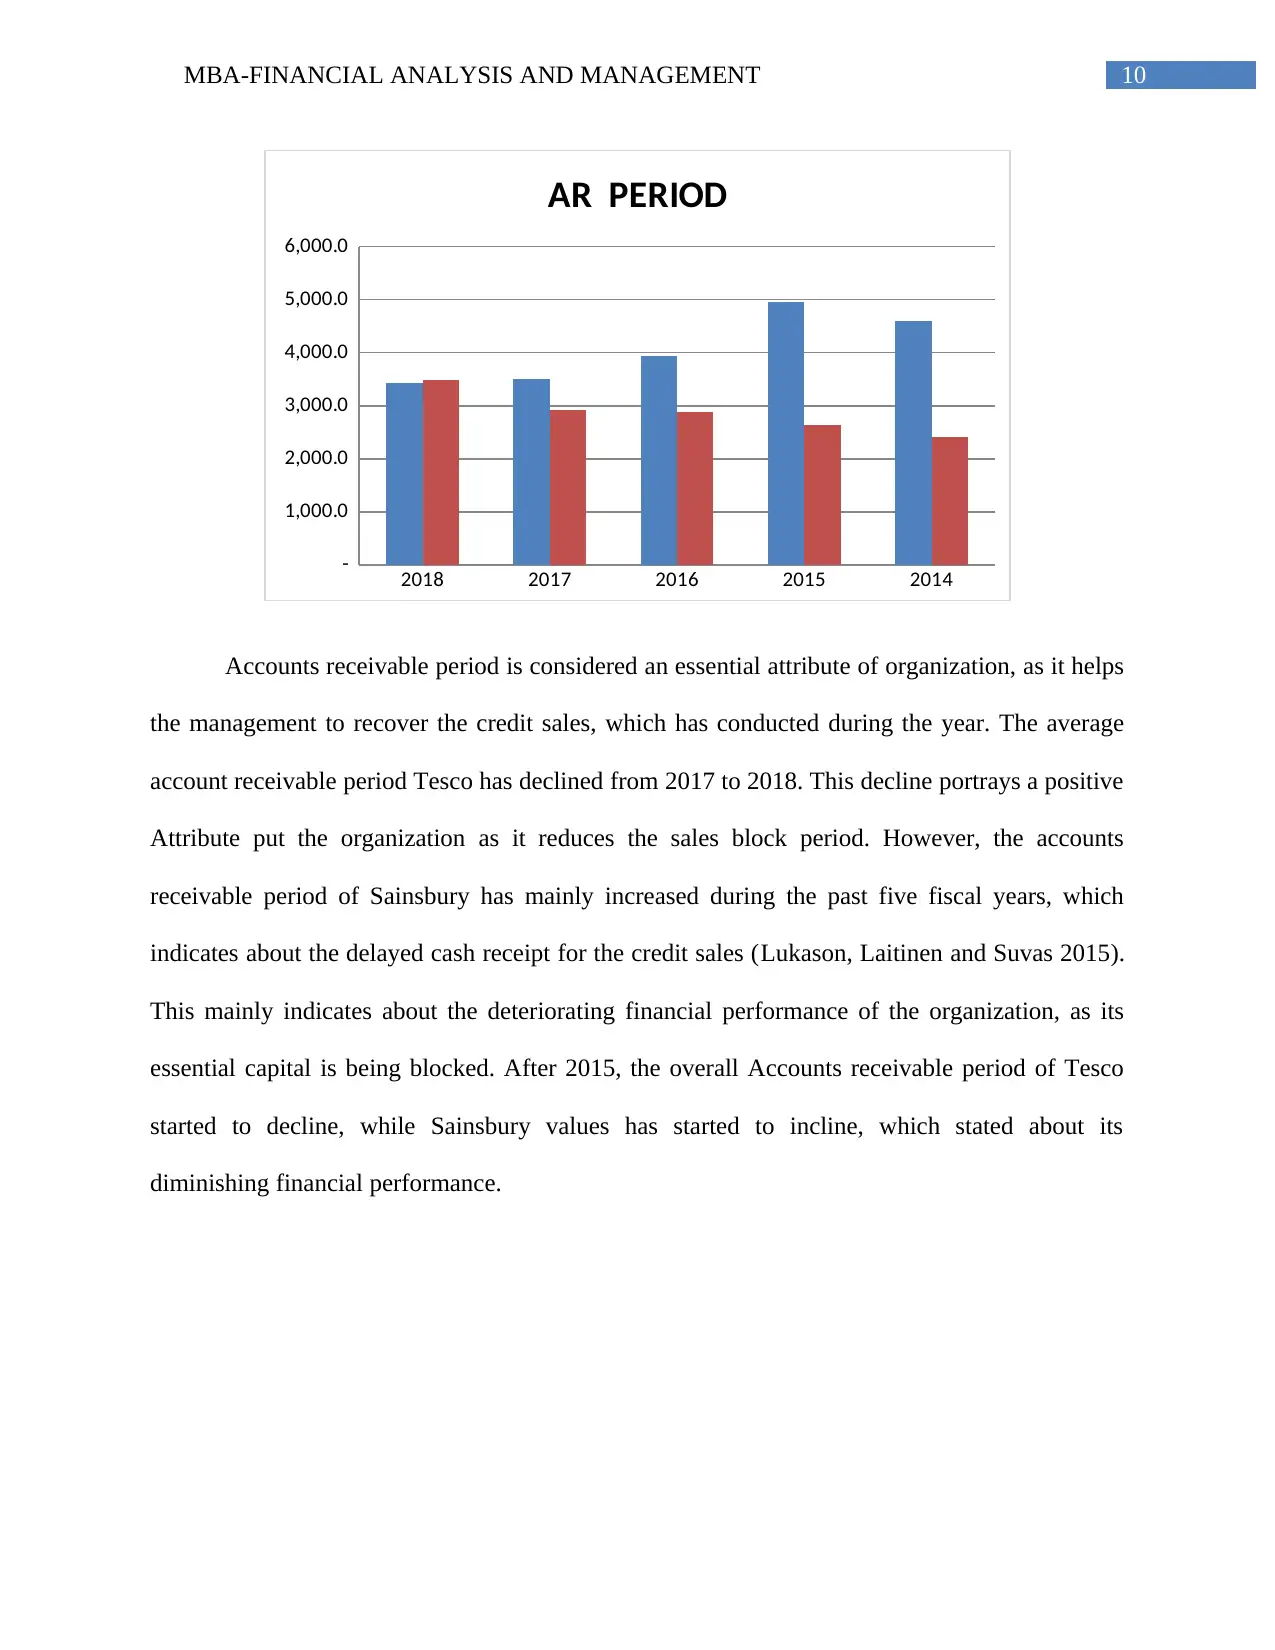
Accounts receivable period is considered an essential attribute of organization, as it helps
the management to recover the credit sales, which has conducted during the year. The average
account receivable period Tesco has declined from 2017 to 2018. This decline portrays a positive
Attribute put the organization as it reduces the sales block period. However, the accounts
receivable period of Sainsbury has mainly increased during the past five fiscal years, which
indicates about the delayed cash receipt for the credit sales (Lukason, Laitinen and Suvas 2015).
This mainly indicates about the deteriorating financial performance of the organization, as its
essential capital is being blocked. After 2015, the overall Accounts receivable period of Tesco
started to decline, while Sainsbury values has started to incline, which stated about its
diminishing financial performance.
2018 2017 2016 2015 2014
-
1,000.0
2,000.0
3,000.0
4,000.0
5,000.0
6,000.0
AR PERIOD
Accounts receivable period is considered an essential attribute of organization, as it helps
the management to recover the credit sales, which has conducted during the year. The average
account receivable period Tesco has declined from 2017 to 2018. This decline portrays a positive
Attribute put the organization as it reduces the sales block period. However, the accounts
receivable period of Sainsbury has mainly increased during the past five fiscal years, which
indicates about the delayed cash receipt for the credit sales (Lukason, Laitinen and Suvas 2015).
This mainly indicates about the deteriorating financial performance of the organization, as its
essential capital is being blocked. After 2015, the overall Accounts receivable period of Tesco
started to decline, while Sainsbury values has started to incline, which stated about its
diminishing financial performance.
11MBA-FINANCIAL ANALYSIS AND MANAGEMENT
2018 2017 2016 2015 2014
-
5,000.0
10,000.0
15,000.0
20,000.0
25,000.0
30,000.0
AP PERIOD
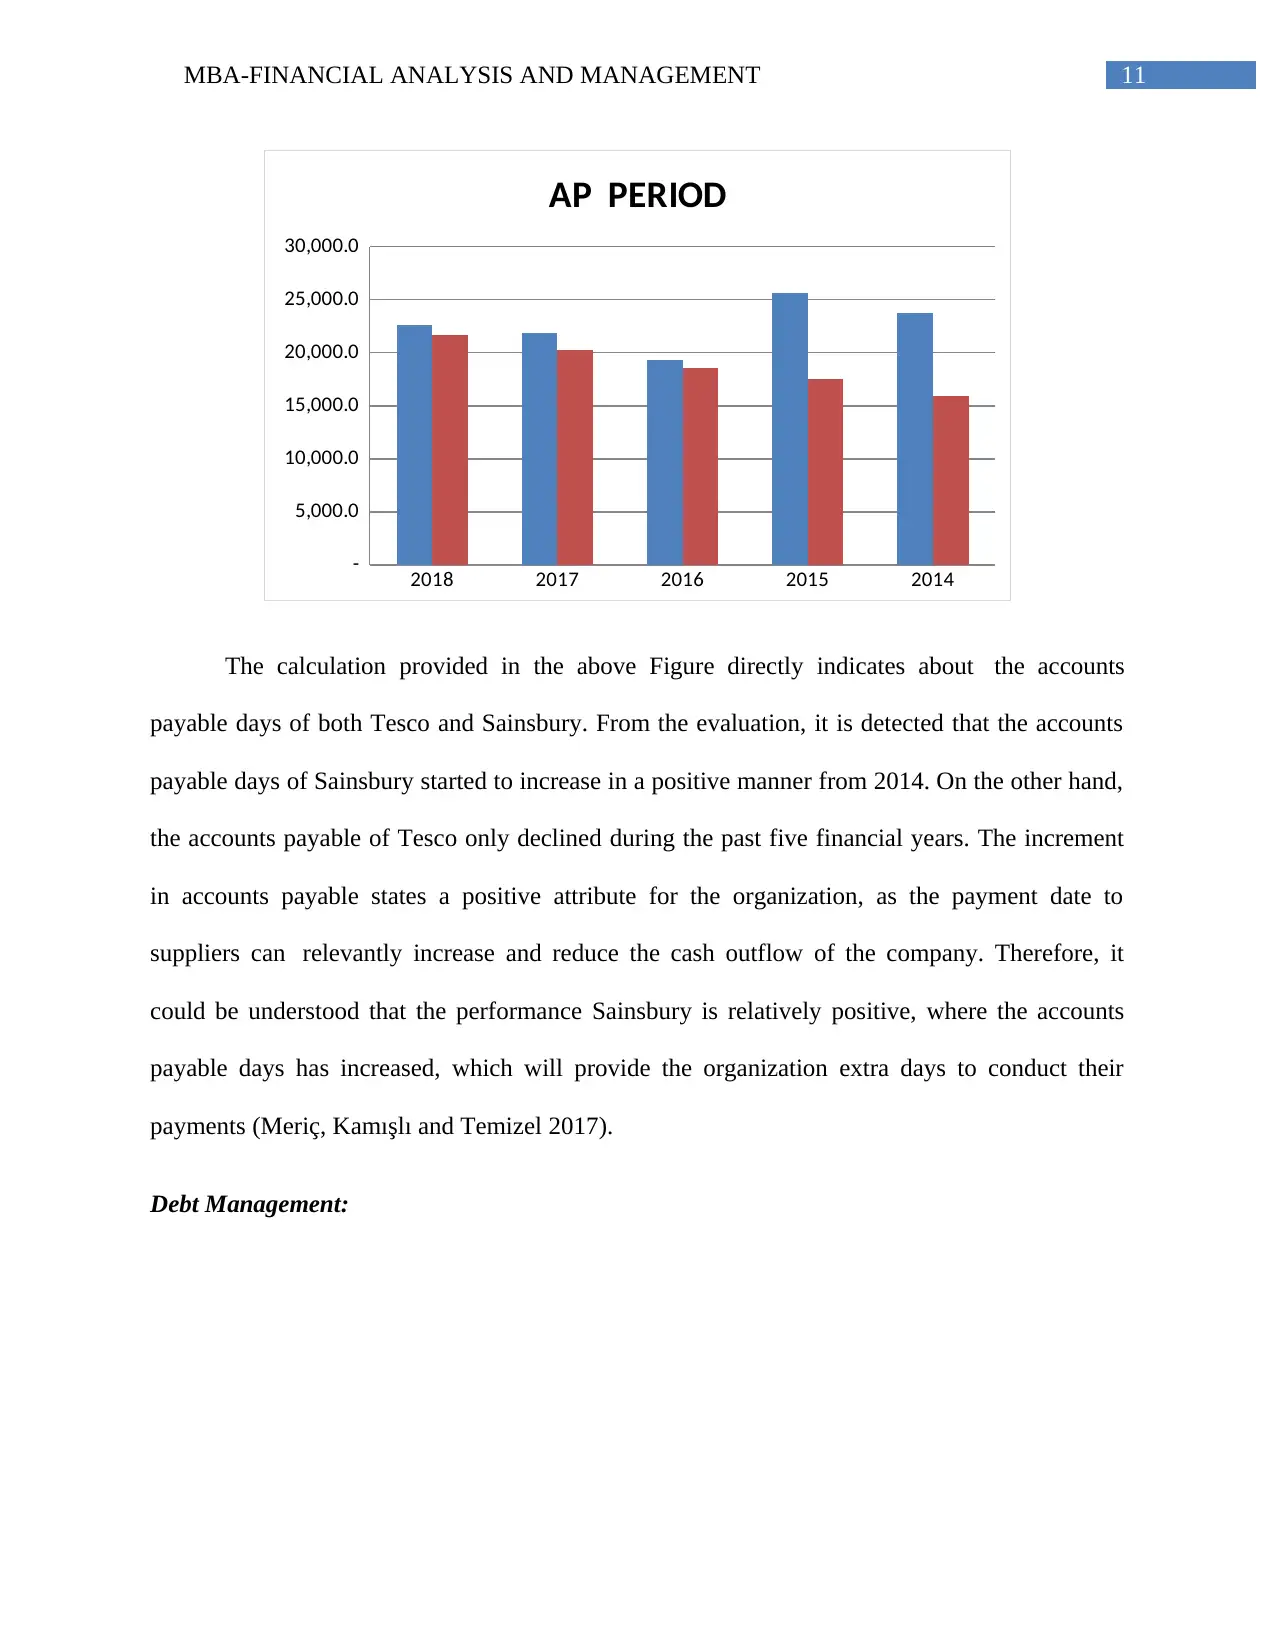
The calculation provided in the above Figure directly indicates about the accounts
payable days of both Tesco and Sainsbury. From the evaluation, it is detected that the accounts
payable days of Sainsbury started to increase in a positive manner from 2014. On the other hand,
the accounts payable of Tesco only declined during the past five financial years. The increment
in accounts payable states a positive attribute for the organization, as the payment date to
suppliers can relevantly increase and reduce the cash outflow of the company. Therefore, it
could be understood that the performance Sainsbury is relatively positive, where the accounts
payable days has increased, which will provide the organization extra days to conduct their
payments (Meriç, Kamışlı and Temizel 2017).
Debt Management:
2018 2017 2016 2015 2014
-
5,000.0
10,000.0
15,000.0
20,000.0
25,000.0
30,000.0
AP PERIOD
The calculation provided in the above Figure directly indicates about the accounts
payable days of both Tesco and Sainsbury. From the evaluation, it is detected that the accounts
payable days of Sainsbury started to increase in a positive manner from 2014. On the other hand,
the accounts payable of Tesco only declined during the past five financial years. The increment
in accounts payable states a positive attribute for the organization, as the payment date to
suppliers can relevantly increase and reduce the cash outflow of the company. Therefore, it
could be understood that the performance Sainsbury is relatively positive, where the accounts
payable days has increased, which will provide the organization extra days to conduct their
payments (Meriç, Kamışlı and Temizel 2017).
Debt Management:
12MBA-FINANCIAL ANALYSIS AND MANAGEMENT
2018 2017 2016 2015 2014
-
20.0
40.0
60.0
80.0
100.0
120.0
140.0
160.0
Gearing %
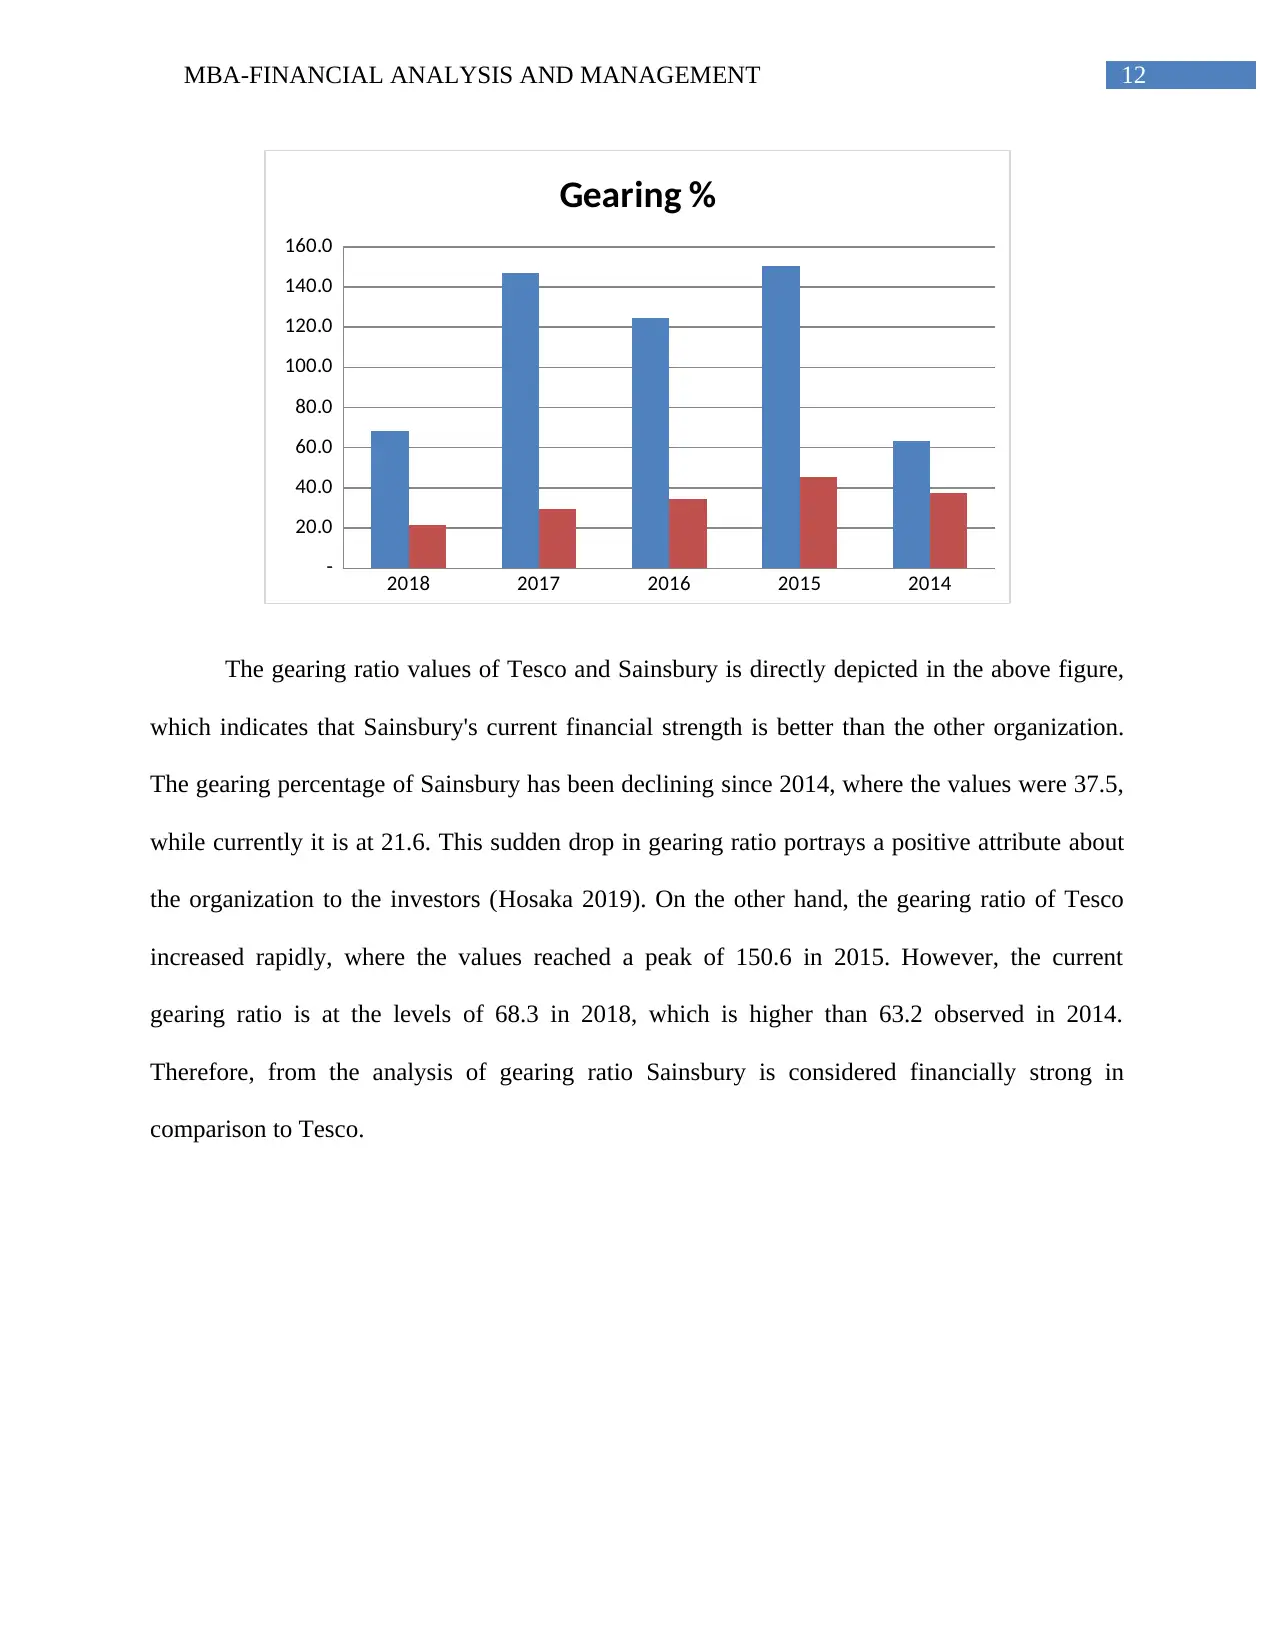
The gearing ratio values of Tesco and Sainsbury is directly depicted in the above figure,
which indicates that Sainsbury's current financial strength is better than the other organization.
The gearing percentage of Sainsbury has been declining since 2014, where the values were 37.5,
while currently it is at 21.6. This sudden drop in gearing ratio portrays a positive attribute about
the organization to the investors (Hosaka 2019). On the other hand, the gearing ratio of Tesco
increased rapidly, where the values reached a peak of 150.6 in 2015. However, the current
gearing ratio is at the levels of 68.3 in 2018, which is higher than 63.2 observed in 2014.
Therefore, from the analysis of gearing ratio Sainsbury is considered financially strong in
comparison to Tesco.
2018 2017 2016 2015 2014
-
20.0
40.0
60.0
80.0
100.0
120.0
140.0
160.0
Gearing %
The gearing ratio values of Tesco and Sainsbury is directly depicted in the above figure,
which indicates that Sainsbury's current financial strength is better than the other organization.
The gearing percentage of Sainsbury has been declining since 2014, where the values were 37.5,
while currently it is at 21.6. This sudden drop in gearing ratio portrays a positive attribute about
the organization to the investors (Hosaka 2019). On the other hand, the gearing ratio of Tesco
increased rapidly, where the values reached a peak of 150.6 in 2015. However, the current
gearing ratio is at the levels of 68.3 in 2018, which is higher than 63.2 observed in 2014.
Therefore, from the analysis of gearing ratio Sainsbury is considered financially strong in
comparison to Tesco.
Paraphrase This Document
Need a fresh take? Get an instant paraphrase of this document with our AI Paraphraser
13MBA-FINANCIAL ANALYSIS AND MANAGEMENT
2018 2017 2016 2015 2014
-
5.0
10.0
15.0
20.0
25.0
30.0
35.0
Asset Financing %
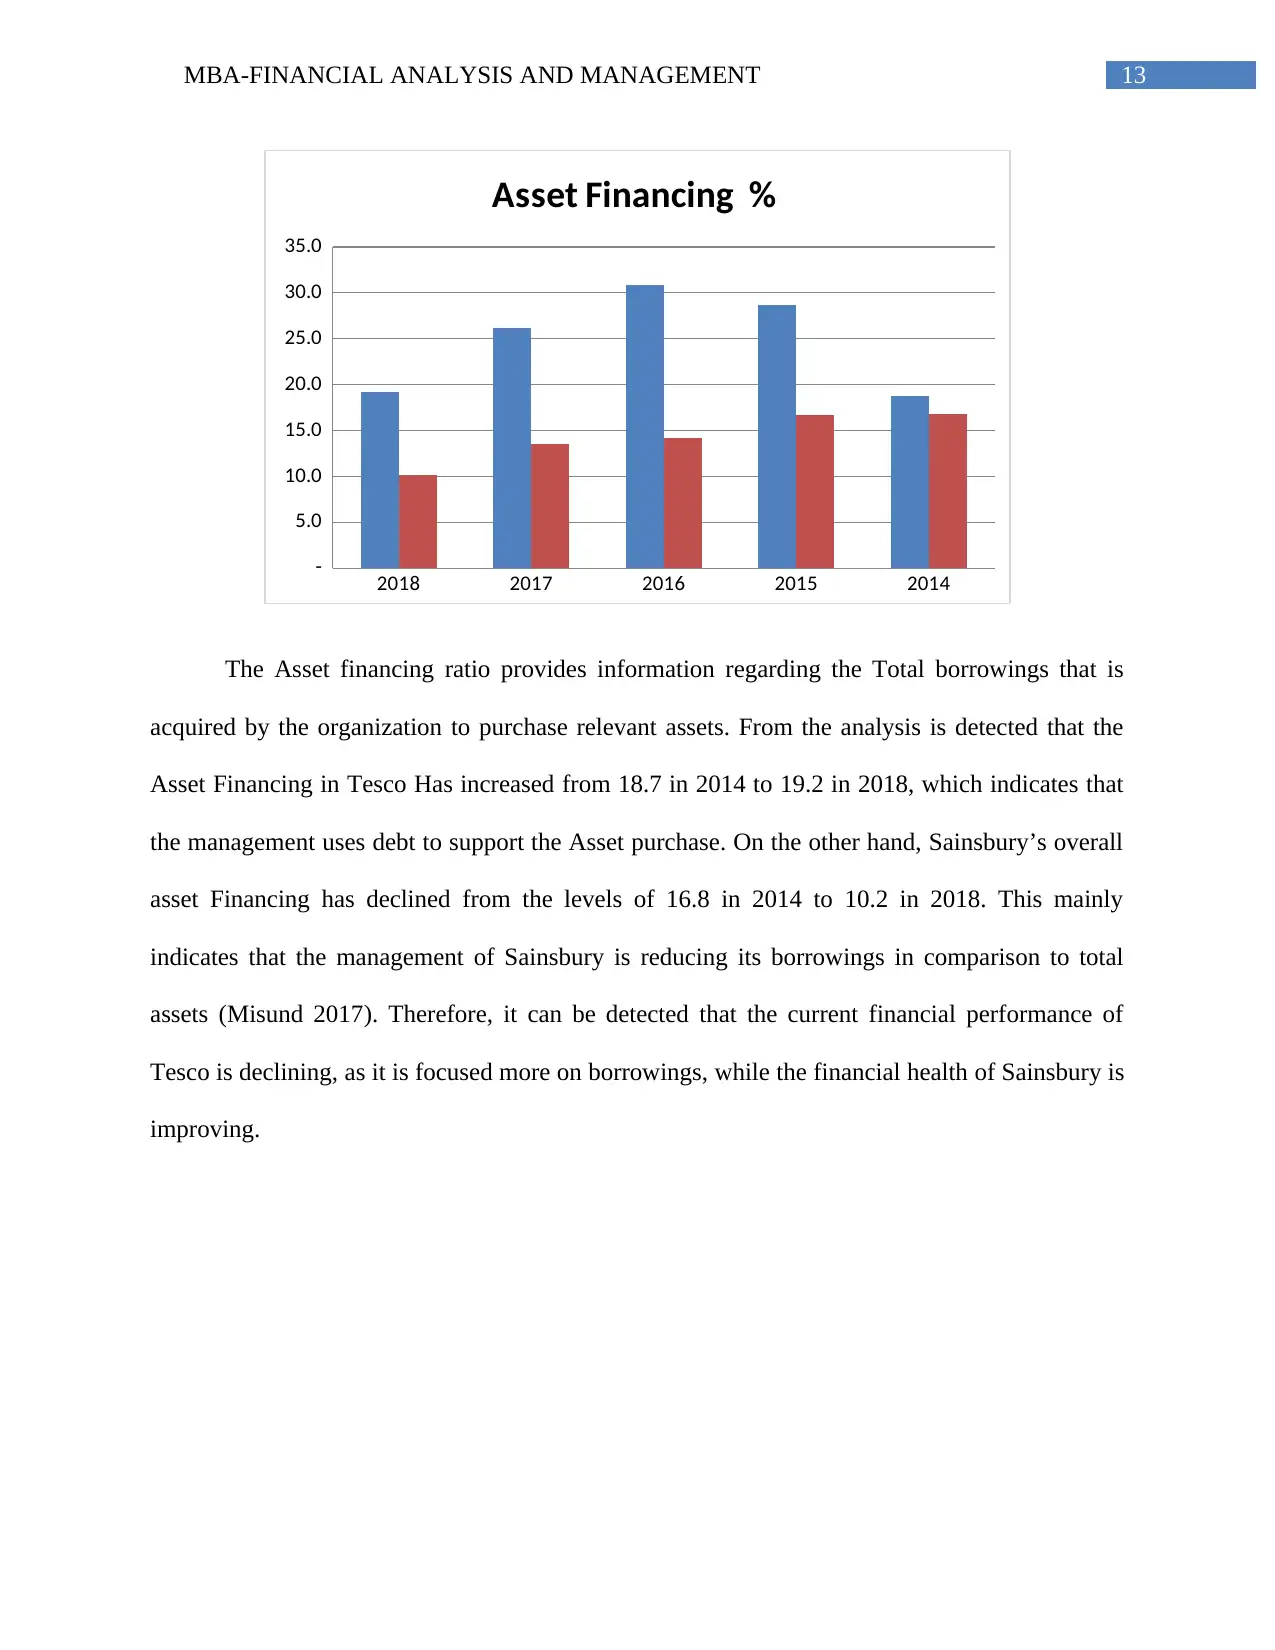
The Asset financing ratio provides information regarding the Total borrowings that is
acquired by the organization to purchase relevant assets. From the analysis is detected that the
Asset Financing in Tesco Has increased from 18.7 in 2014 to 19.2 in 2018, which indicates that
the management uses debt to support the Asset purchase. On the other hand, Sainsbury’s overall
asset Financing has declined from the levels of 16.8 in 2014 to 10.2 in 2018. This mainly
indicates that the management of Sainsbury is reducing its borrowings in comparison to total
assets (Misund 2017). Therefore, it can be detected that the current financial performance of
Tesco is declining, as it is focused more on borrowings, while the financial health of Sainsbury is
improving.
2018 2017 2016 2015 2014
-
5.0
10.0
15.0
20.0
25.0
30.0
35.0
Asset Financing %
The Asset financing ratio provides information regarding the Total borrowings that is
acquired by the organization to purchase relevant assets. From the analysis is detected that the
Asset Financing in Tesco Has increased from 18.7 in 2014 to 19.2 in 2018, which indicates that
the management uses debt to support the Asset purchase. On the other hand, Sainsbury’s overall
asset Financing has declined from the levels of 16.8 in 2014 to 10.2 in 2018. This mainly
indicates that the management of Sainsbury is reducing its borrowings in comparison to total
assets (Misund 2017). Therefore, it can be detected that the current financial performance of
Tesco is declining, as it is focused more on borrowings, while the financial health of Sainsbury is
improving.
14MBA-FINANCIAL ANALYSIS AND MANAGEMENT
2018 2017 2016 2015 2014
(10.0)
(8.0)
(6.0)
(4.0)
(2.0)
-
2.0
4.0
6.0
8.0
Interest Cover
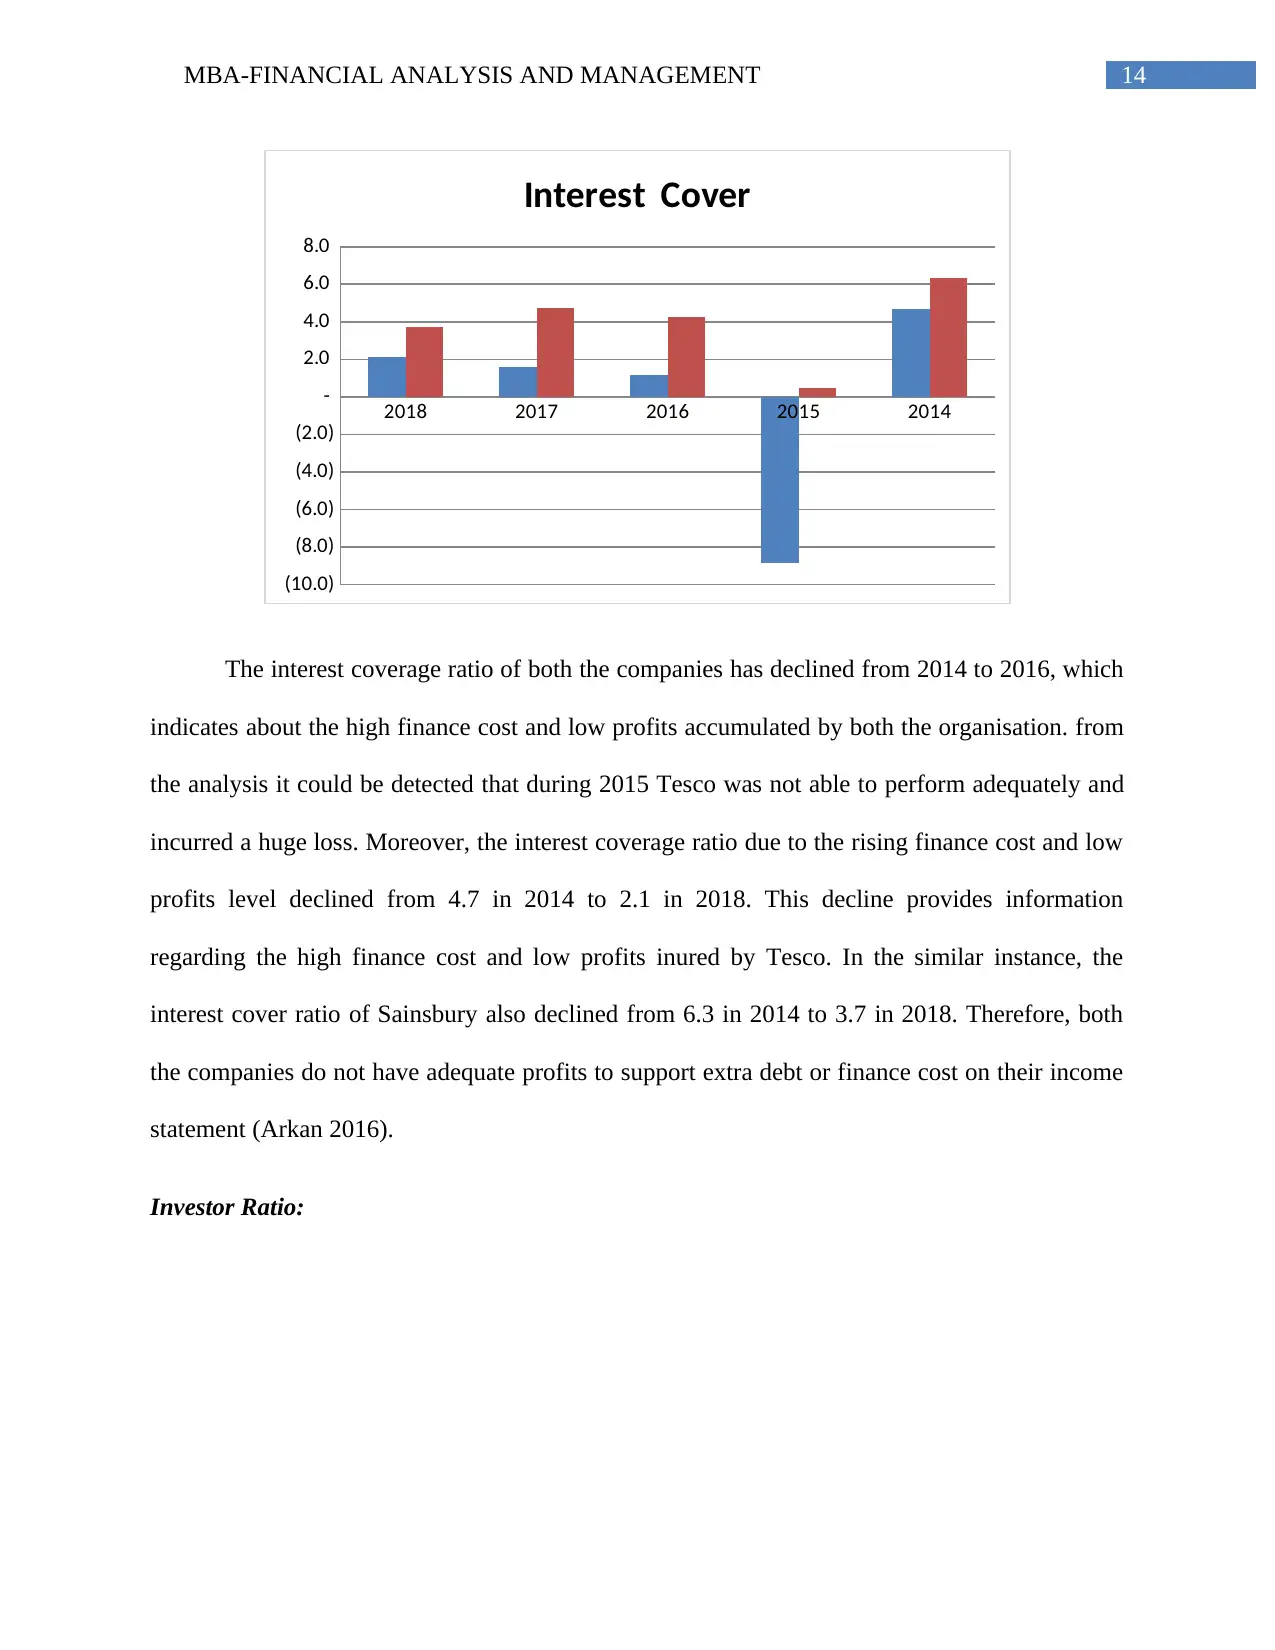
The interest coverage ratio of both the companies has declined from 2014 to 2016, which
indicates about the high finance cost and low profits accumulated by both the organisation. from
the analysis it could be detected that during 2015 Tesco was not able to perform adequately and
incurred a huge loss. Moreover, the interest coverage ratio due to the rising finance cost and low
profits level declined from 4.7 in 2014 to 2.1 in 2018. This decline provides information
regarding the high finance cost and low profits inured by Tesco. In the similar instance, the
interest cover ratio of Sainsbury also declined from 6.3 in 2014 to 3.7 in 2018. Therefore, both
the companies do not have adequate profits to support extra debt or finance cost on their income
statement (Arkan 2016).
Investor Ratio:
2018 2017 2016 2015 2014
(10.0)
(8.0)
(6.0)
(4.0)
(2.0)
-
2.0
4.0
6.0
8.0
Interest Cover
The interest coverage ratio of both the companies has declined from 2014 to 2016, which
indicates about the high finance cost and low profits accumulated by both the organisation. from
the analysis it could be detected that during 2015 Tesco was not able to perform adequately and
incurred a huge loss. Moreover, the interest coverage ratio due to the rising finance cost and low
profits level declined from 4.7 in 2014 to 2.1 in 2018. This decline provides information
regarding the high finance cost and low profits inured by Tesco. In the similar instance, the
interest cover ratio of Sainsbury also declined from 6.3 in 2014 to 3.7 in 2018. Therefore, both
the companies do not have adequate profits to support extra debt or finance cost on their income
statement (Arkan 2016).
Investor Ratio:
15MBA-FINANCIAL ANALYSIS AND MANAGEMENT
2018 2017 2016 2015 2014
(100.0)
(80.0)
(60.0)
(40.0)
(20.0)
-
20.0
Return on Equity
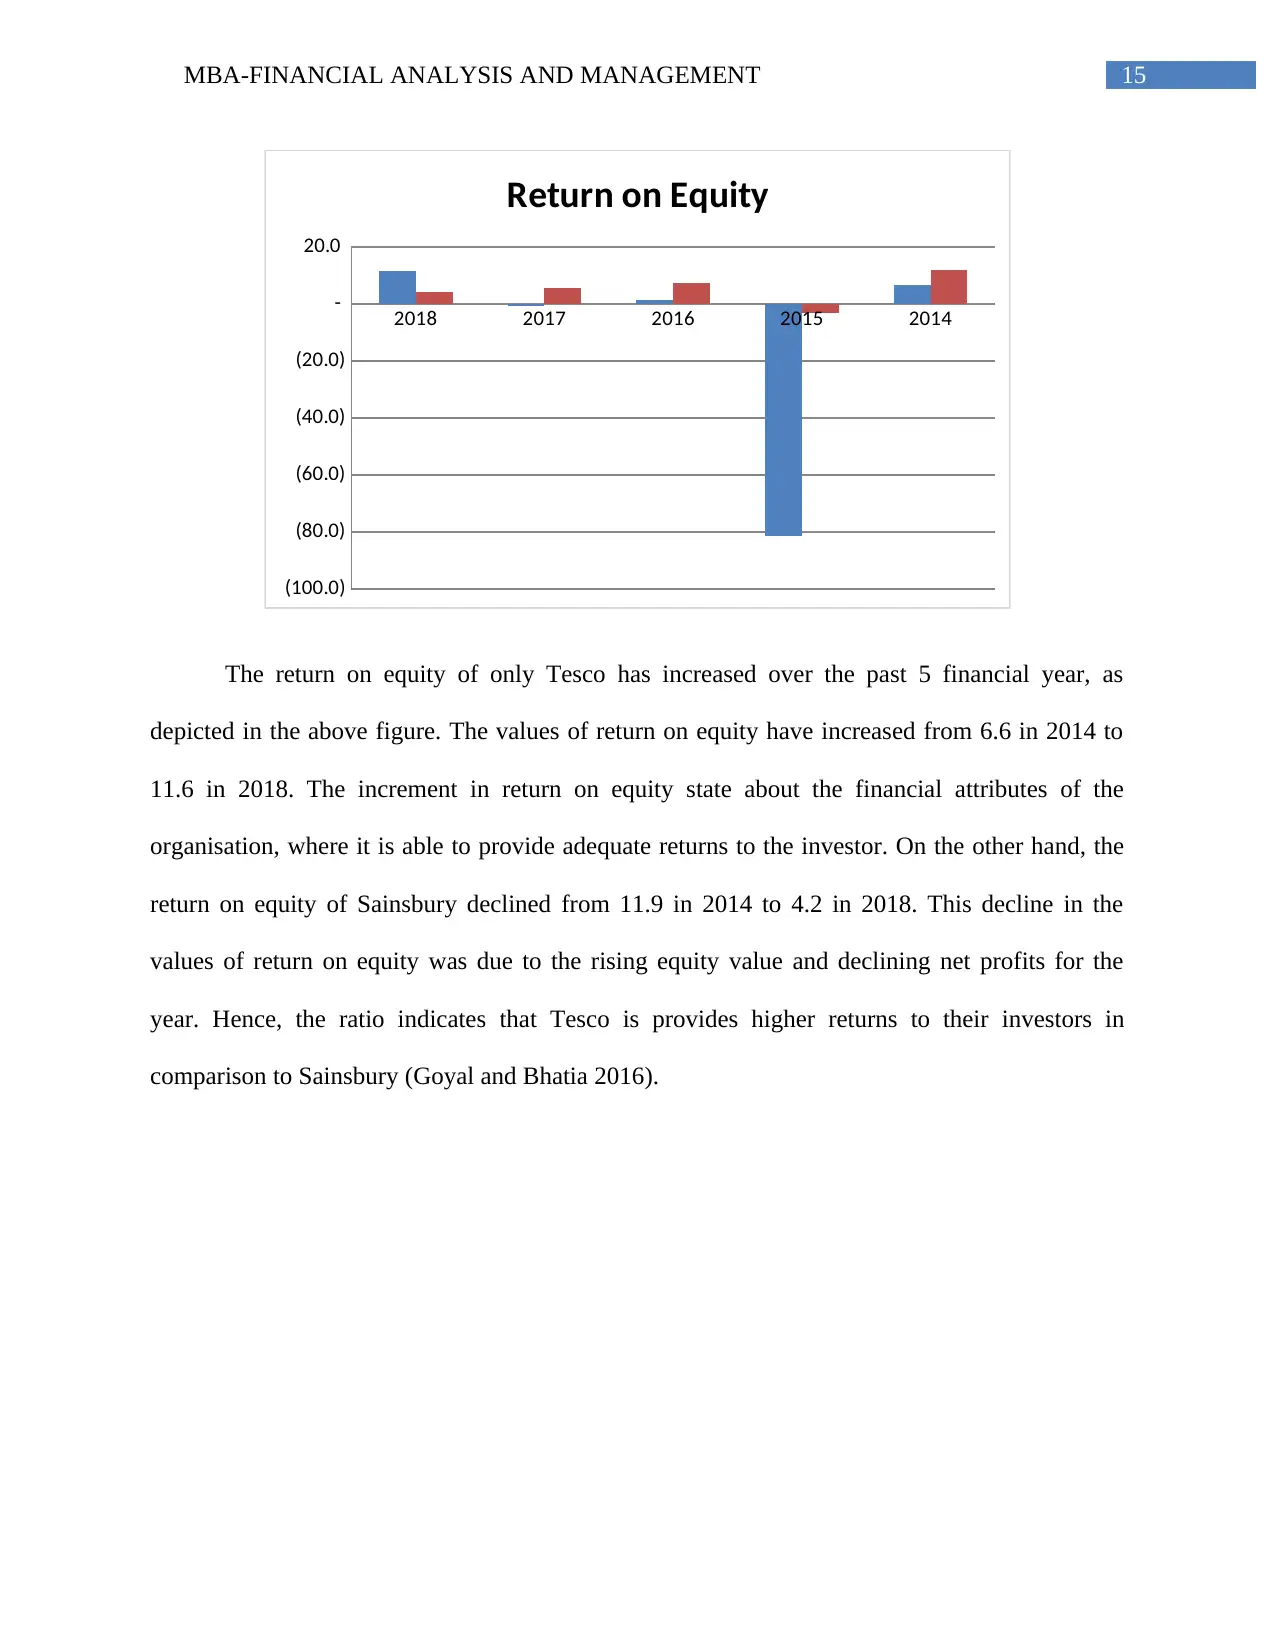
The return on equity of only Tesco has increased over the past 5 financial year, as
depicted in the above figure. The values of return on equity have increased from 6.6 in 2014 to
11.6 in 2018. The increment in return on equity state about the financial attributes of the
organisation, where it is able to provide adequate returns to the investor. On the other hand, the
return on equity of Sainsbury declined from 11.9 in 2014 to 4.2 in 2018. This decline in the
values of return on equity was due to the rising equity value and declining net profits for the
year. Hence, the ratio indicates that Tesco is provides higher returns to their investors in
comparison to Sainsbury (Goyal and Bhatia 2016).
2018 2017 2016 2015 2014
(100.0)
(80.0)
(60.0)
(40.0)
(20.0)
-
20.0
Return on Equity
The return on equity of only Tesco has increased over the past 5 financial year, as
depicted in the above figure. The values of return on equity have increased from 6.6 in 2014 to
11.6 in 2018. The increment in return on equity state about the financial attributes of the
organisation, where it is able to provide adequate returns to the investor. On the other hand, the
return on equity of Sainsbury declined from 11.9 in 2014 to 4.2 in 2018. This decline in the
values of return on equity was due to the rising equity value and declining net profits for the
year. Hence, the ratio indicates that Tesco is provides higher returns to their investors in
comparison to Sainsbury (Goyal and Bhatia 2016).
Secure Best Marks with AI Grader
Need help grading? Try our AI Grader for instant feedback on your assignments.
16MBA-FINANCIAL ANALYSIS AND MANAGEMENT
2018 2017 2016 2015 2014
(500.0)
(400.0)
(300.0)
(200.0)
(100.0)
-
100.0
200.0
EARNINGS PER SHARE
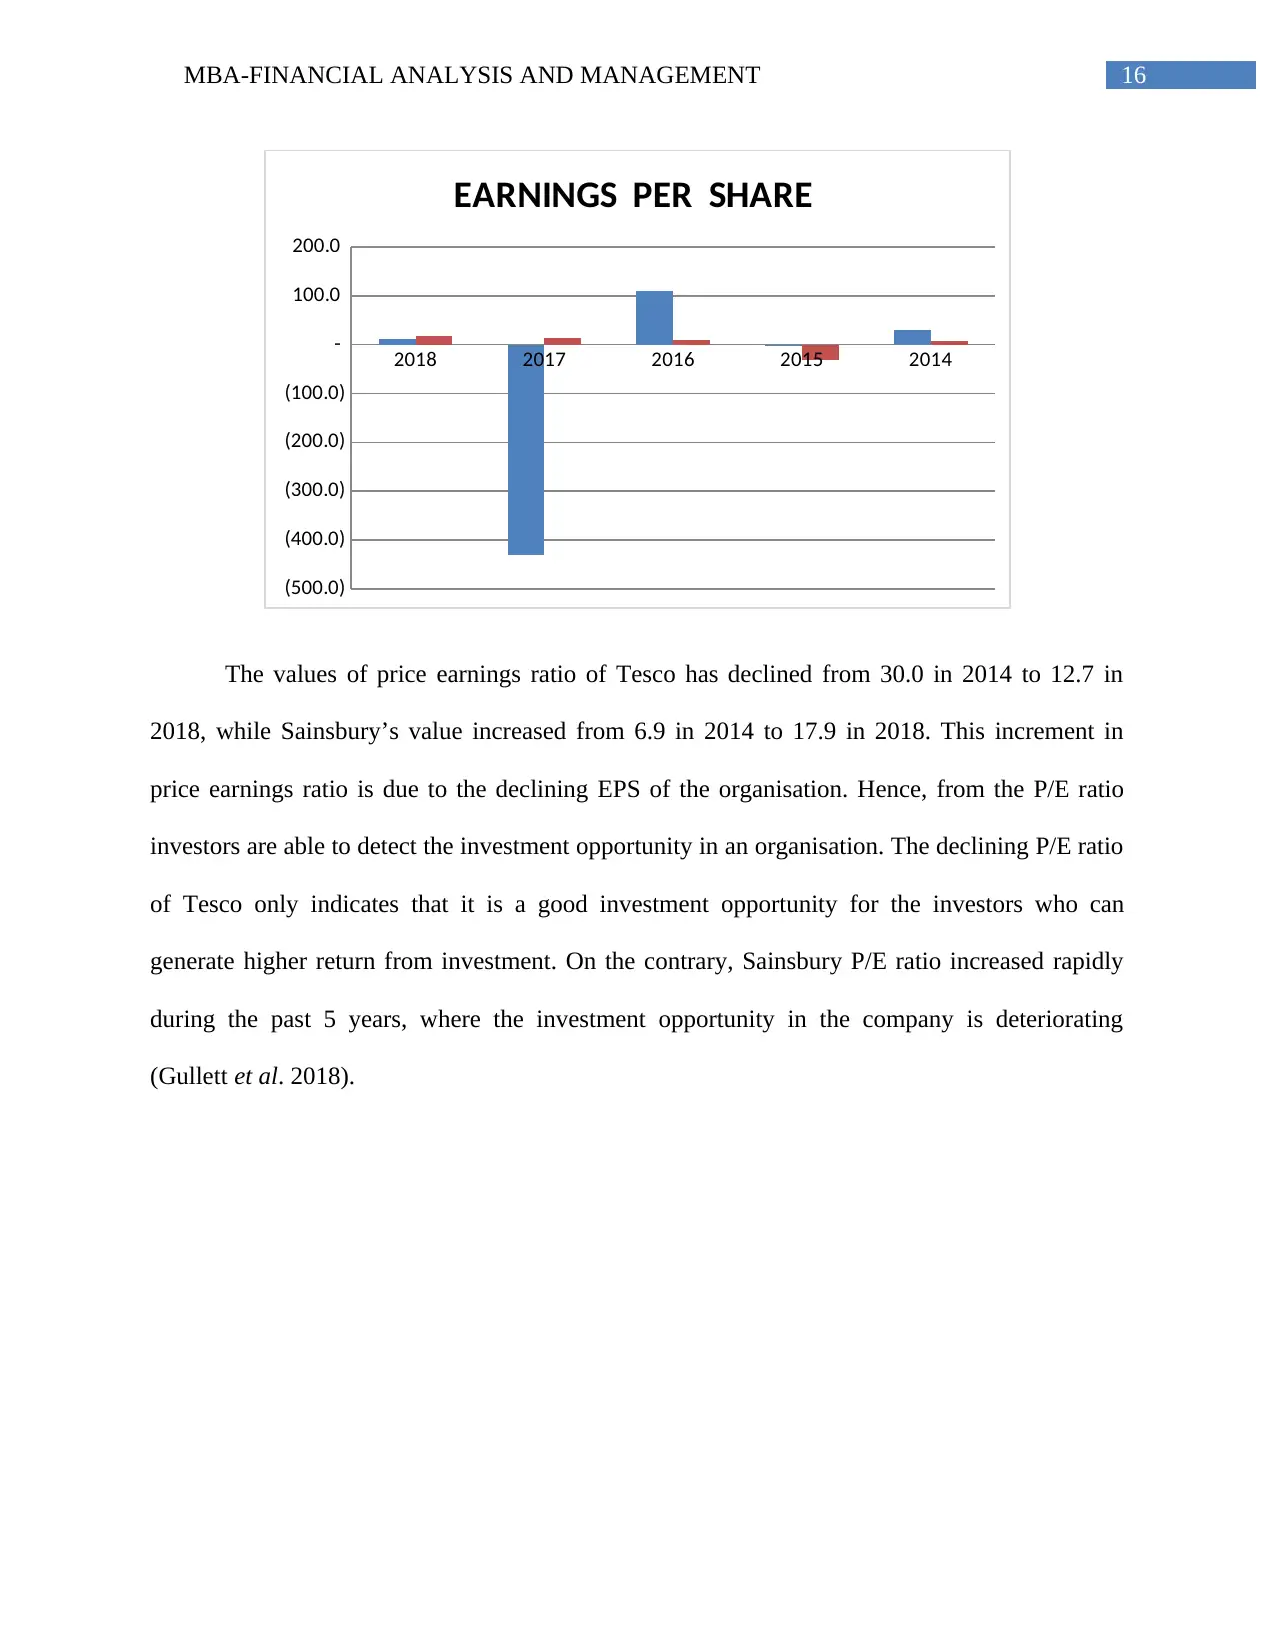
The values of price earnings ratio of Tesco has declined from 30.0 in 2014 to 12.7 in
2018, while Sainsbury’s value increased from 6.9 in 2014 to 17.9 in 2018. This increment in
price earnings ratio is due to the declining EPS of the organisation. Hence, from the P/E ratio
investors are able to detect the investment opportunity in an organisation. The declining P/E ratio
of Tesco only indicates that it is a good investment opportunity for the investors who can
generate higher return from investment. On the contrary, Sainsbury P/E ratio increased rapidly
during the past 5 years, where the investment opportunity in the company is deteriorating
(Gullett et al. 2018).
2018 2017 2016 2015 2014
(500.0)
(400.0)
(300.0)
(200.0)
(100.0)
-
100.0
200.0
EARNINGS PER SHARE
The values of price earnings ratio of Tesco has declined from 30.0 in 2014 to 12.7 in
2018, while Sainsbury’s value increased from 6.9 in 2014 to 17.9 in 2018. This increment in
price earnings ratio is due to the declining EPS of the organisation. Hence, from the P/E ratio
investors are able to detect the investment opportunity in an organisation. The declining P/E ratio
of Tesco only indicates that it is a good investment opportunity for the investors who can
generate higher return from investment. On the contrary, Sainsbury P/E ratio increased rapidly
during the past 5 years, where the investment opportunity in the company is deteriorating
(Gullett et al. 2018).
17MBA-FINANCIAL ANALYSIS AND MANAGEMENT
2018 2017 2016 2015 2014
(2.50)
(2.00)
(1.50)
(1.00)
(0.50)
-
0.50
1.00
1.50
Dividend payout ratio
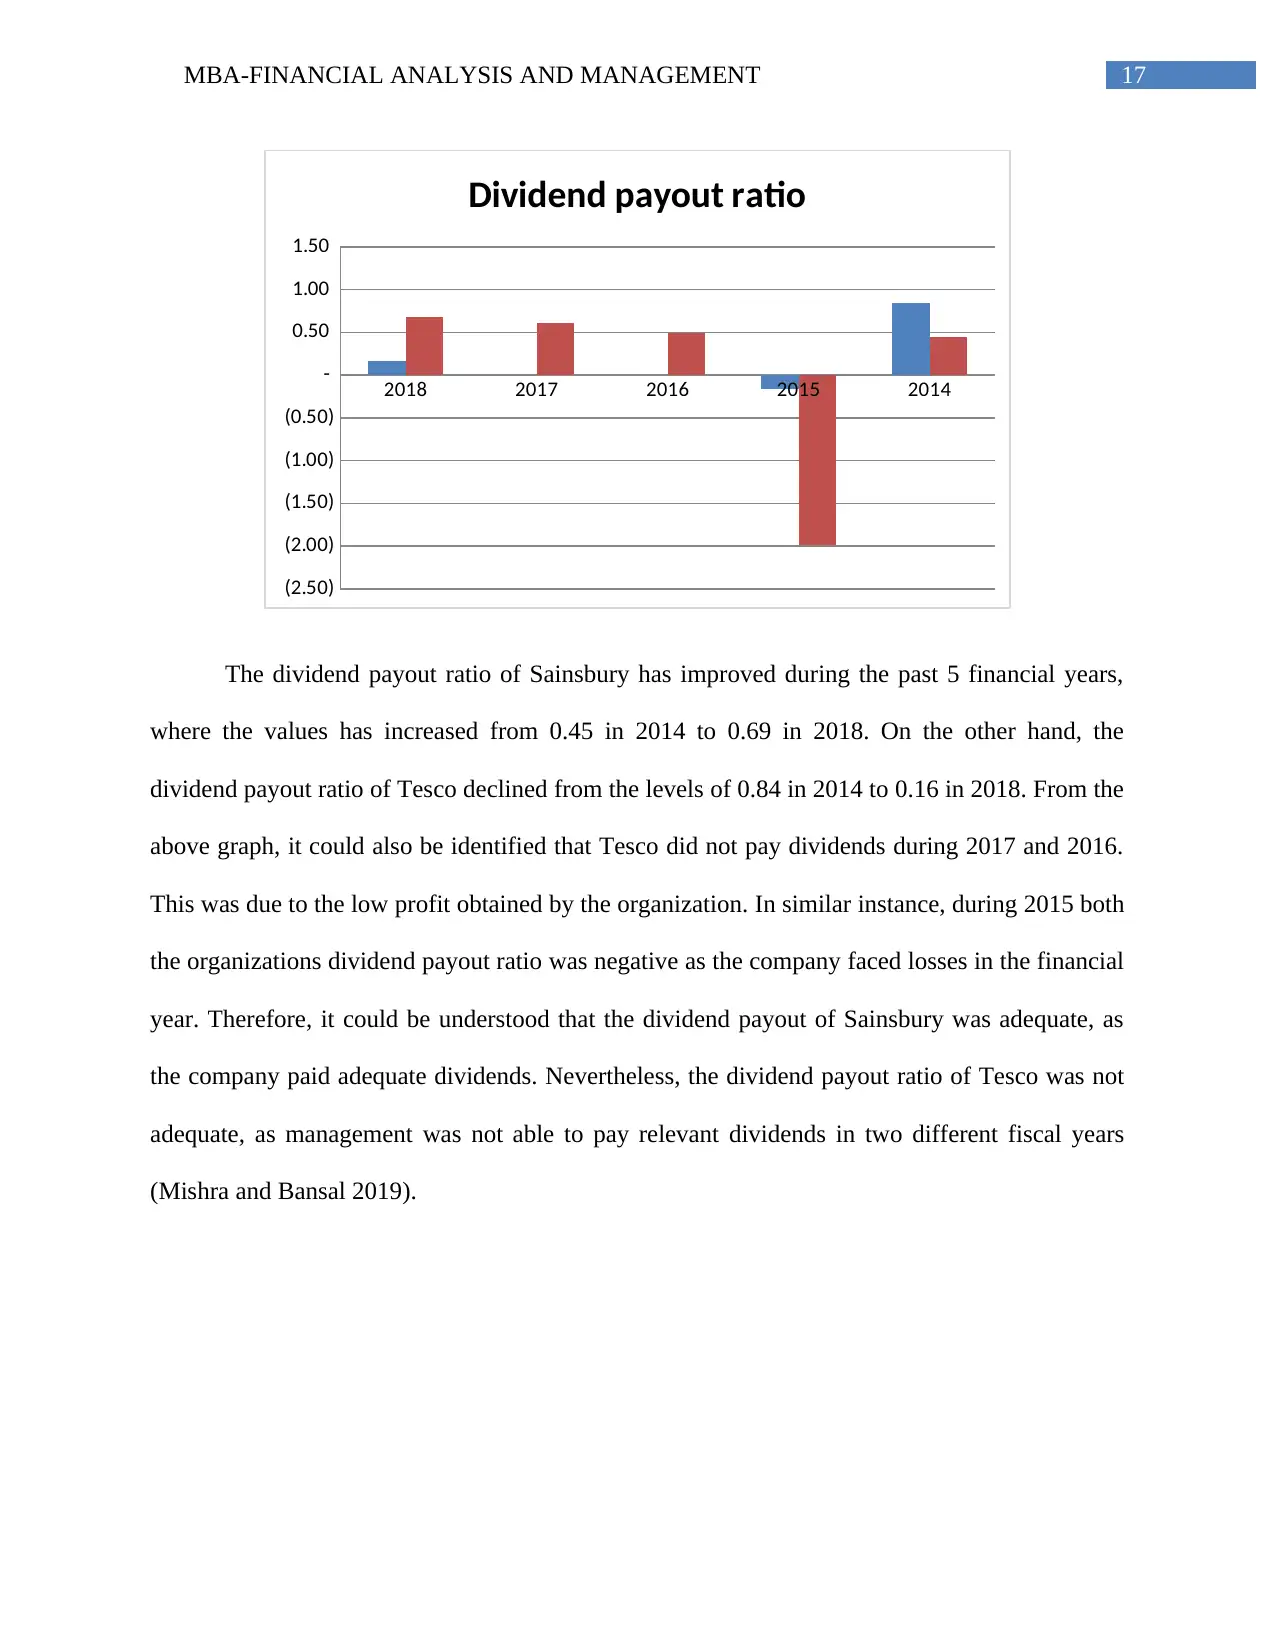
The dividend payout ratio of Sainsbury has improved during the past 5 financial years,
where the values has increased from 0.45 in 2014 to 0.69 in 2018. On the other hand, the
dividend payout ratio of Tesco declined from the levels of 0.84 in 2014 to 0.16 in 2018. From the
above graph, it could also be identified that Tesco did not pay dividends during 2017 and 2016.
This was due to the low profit obtained by the organization. In similar instance, during 2015 both
the organizations dividend payout ratio was negative as the company faced losses in the financial
year. Therefore, it could be understood that the dividend payout of Sainsbury was adequate, as
the company paid adequate dividends. Nevertheless, the dividend payout ratio of Tesco was not
adequate, as management was not able to pay relevant dividends in two different fiscal years
(Mishra and Bansal 2019).
2018 2017 2016 2015 2014
(2.50)
(2.00)
(1.50)
(1.00)
(0.50)
-
0.50
1.00
1.50
Dividend payout ratio
The dividend payout ratio of Sainsbury has improved during the past 5 financial years,
where the values has increased from 0.45 in 2014 to 0.69 in 2018. On the other hand, the
dividend payout ratio of Tesco declined from the levels of 0.84 in 2014 to 0.16 in 2018. From the
above graph, it could also be identified that Tesco did not pay dividends during 2017 and 2016.
This was due to the low profit obtained by the organization. In similar instance, during 2015 both
the organizations dividend payout ratio was negative as the company faced losses in the financial
year. Therefore, it could be understood that the dividend payout of Sainsbury was adequate, as
the company paid adequate dividends. Nevertheless, the dividend payout ratio of Tesco was not
adequate, as management was not able to pay relevant dividends in two different fiscal years
(Mishra and Bansal 2019).
18MBA-FINANCIAL ANALYSIS AND MANAGEMENT
2018 2017 2016 2015 2014
0.00%
1.00%
2.00%
3.00%
4.00%
5.00%
6.00%
7.00%
Dividend yield
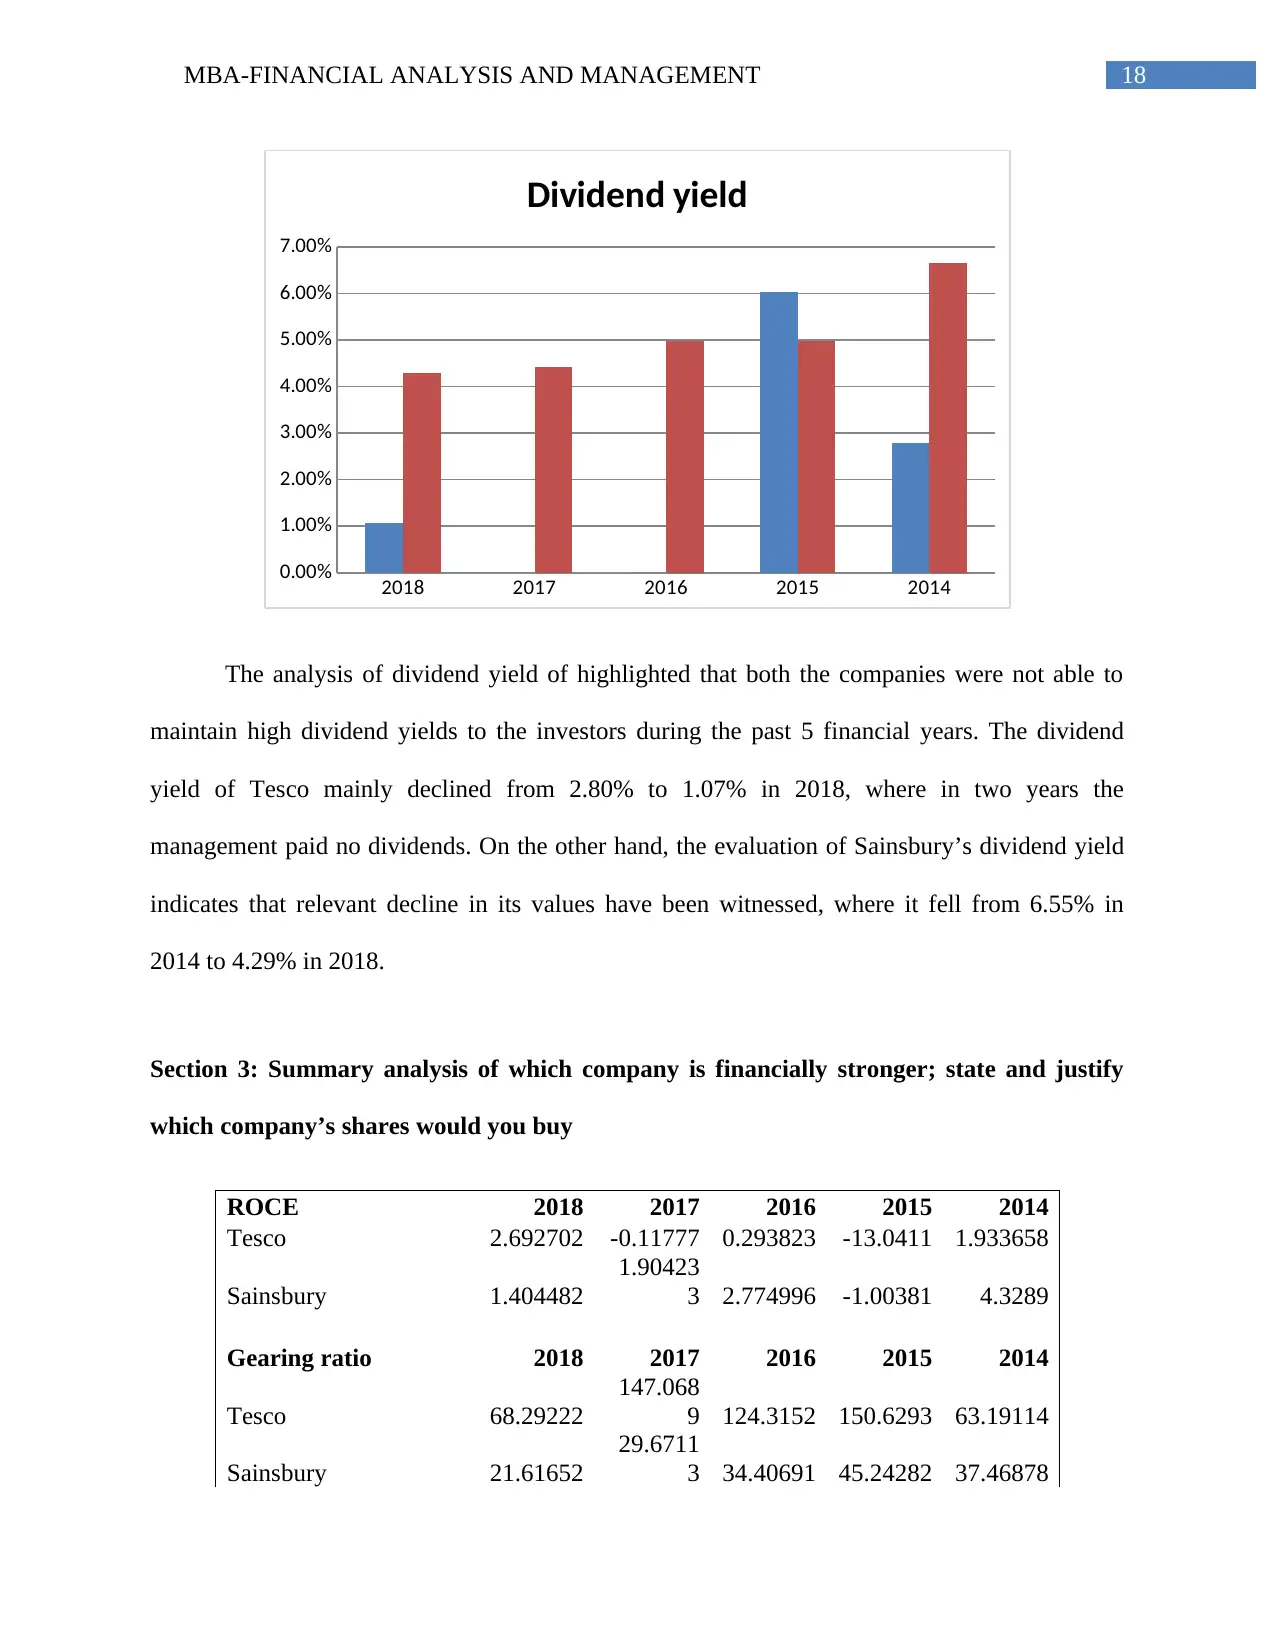
The analysis of dividend yield of highlighted that both the companies were not able to
maintain high dividend yields to the investors during the past 5 financial years. The dividend
yield of Tesco mainly declined from 2.80% to 1.07% in 2018, where in two years the
management paid no dividends. On the other hand, the evaluation of Sainsbury’s dividend yield
indicates that relevant decline in its values have been witnessed, where it fell from 6.55% in
2014 to 4.29% in 2018.
Section 3: Summary analysis of which company is financially stronger; state and justify
which company’s shares would you buy
ROCE 2018 2017 2016 2015 2014
Tesco 2.692702 -0.11777 0.293823 -13.0411 1.933658
Sainsbury 1.404482
1.90423
3 2.774996 -1.00381 4.3289
Gearing ratio 2018 2017 2016 2015 2014
Tesco 68.29222
147.068
9 124.3152 150.6293 63.19114
Sainsbury 21.61652
29.6711
3 34.40691 45.24282 37.46878
2018 2017 2016 2015 2014
0.00%
1.00%
2.00%
3.00%
4.00%
5.00%
6.00%
7.00%
Dividend yield
The analysis of dividend yield of highlighted that both the companies were not able to
maintain high dividend yields to the investors during the past 5 financial years. The dividend
yield of Tesco mainly declined from 2.80% to 1.07% in 2018, where in two years the
management paid no dividends. On the other hand, the evaluation of Sainsbury’s dividend yield
indicates that relevant decline in its values have been witnessed, where it fell from 6.55% in
2014 to 4.29% in 2018.
Section 3: Summary analysis of which company is financially stronger; state and justify
which company’s shares would you buy
ROCE 2018 2017 2016 2015 2014
Tesco 2.692702 -0.11777 0.293823 -13.0411 1.933658
Sainsbury 1.404482
1.90423
3 2.774996 -1.00381 4.3289
Gearing ratio 2018 2017 2016 2015 2014
Tesco 68.29222
147.068
9 124.3152 150.6293 63.19114
Sainsbury 21.61652
29.6711
3 34.40691 45.24282 37.46878
Paraphrase This Document
Need a fresh take? Get an instant paraphrase of this document with our AI Paraphraser
19MBA-FINANCIAL ANALYSIS AND MANAGEMENT
ROE 2018 2017 2016 2015 2014
Tesco 11.55097 -0.84191 1.497214 -81.5443 6.588779
Sainsbury 4.169478 5.48603 7.399843 -2.99693 11.9234
EPS 2018 2017 2016 2015 2014
Tesco 0.1477 -0.0049 0.017 -0.7082 0.1207
Sainsbury 0.1333 0.175 0.239 -0.087 0.377
P/E 2018 2017 2016 2015 2014
Tesco 12.6608 -430.612 110.8824 -2.6405 29.99171
Sainsbury 17.85446 13.2 10.16736 -30.4598 6.896552
Share price movement 2018 2017 2016 2015 2014
Tesco 1.87 2.11 1.885 1.87 3.62
Sainsbury 2.38 2.31 2.43 2.65 2.6
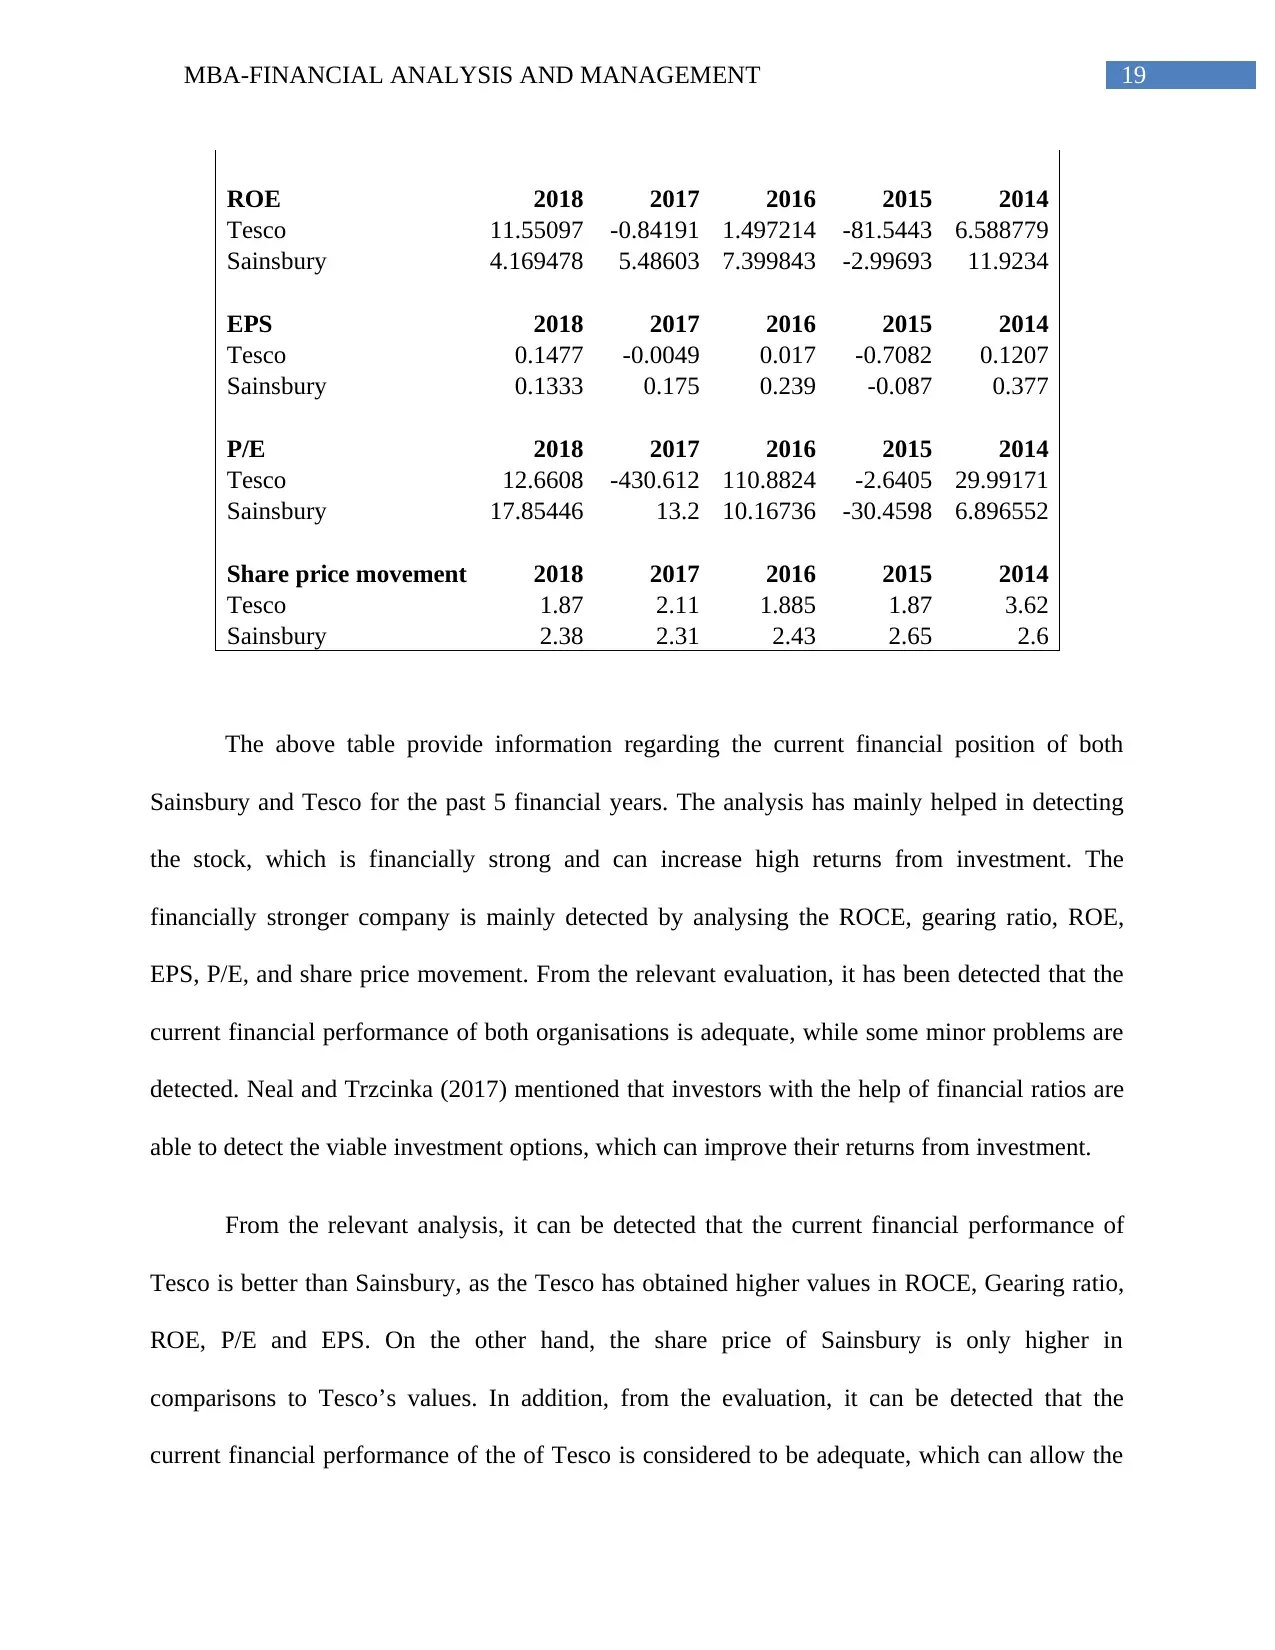
The above table provide information regarding the current financial position of both
Sainsbury and Tesco for the past 5 financial years. The analysis has mainly helped in detecting
the stock, which is financially strong and can increase high returns from investment. The
financially stronger company is mainly detected by analysing the ROCE, gearing ratio, ROE,
EPS, P/E, and share price movement. From the relevant evaluation, it has been detected that the
current financial performance of both organisations is adequate, while some minor problems are
detected. Neal and Trzcinka (2017) mentioned that investors with the help of financial ratios are
able to detect the viable investment options, which can improve their returns from investment.
From the relevant analysis, it can be detected that the current financial performance of
Tesco is better than Sainsbury, as the Tesco has obtained higher values in ROCE, Gearing ratio,
ROE, P/E and EPS. On the other hand, the share price of Sainsbury is only higher in
comparisons to Tesco’s values. In addition, from the evaluation, it can be detected that the
current financial performance of the of Tesco is considered to be adequate, which can allow the
ROE 2018 2017 2016 2015 2014
Tesco 11.55097 -0.84191 1.497214 -81.5443 6.588779
Sainsbury 4.169478 5.48603 7.399843 -2.99693 11.9234
EPS 2018 2017 2016 2015 2014
Tesco 0.1477 -0.0049 0.017 -0.7082 0.1207
Sainsbury 0.1333 0.175 0.239 -0.087 0.377
P/E 2018 2017 2016 2015 2014
Tesco 12.6608 -430.612 110.8824 -2.6405 29.99171
Sainsbury 17.85446 13.2 10.16736 -30.4598 6.896552
Share price movement 2018 2017 2016 2015 2014
Tesco 1.87 2.11 1.885 1.87 3.62
Sainsbury 2.38 2.31 2.43 2.65 2.6
The above table provide information regarding the current financial position of both
Sainsbury and Tesco for the past 5 financial years. The analysis has mainly helped in detecting
the stock, which is financially strong and can increase high returns from investment. The
financially stronger company is mainly detected by analysing the ROCE, gearing ratio, ROE,
EPS, P/E, and share price movement. From the relevant evaluation, it has been detected that the
current financial performance of both organisations is adequate, while some minor problems are
detected. Neal and Trzcinka (2017) mentioned that investors with the help of financial ratios are
able to detect the viable investment options, which can improve their returns from investment.
From the relevant analysis, it can be detected that the current financial performance of
Tesco is better than Sainsbury, as the Tesco has obtained higher values in ROCE, Gearing ratio,
ROE, P/E and EPS. On the other hand, the share price of Sainsbury is only higher in
comparisons to Tesco’s values. In addition, from the evaluation, it can be detected that the
current financial performance of the of Tesco is considered to be adequate, which can allow the
20MBA-FINANCIAL ANALYSIS AND MANAGEMENT
investor to generate high level of income from operations. However, the share price of Sainsbury
is considered to be high in comparison to Tesco, which indicates that the investors would
increase their investment value.
Section 4: Identify problems/limitations of the ratio analysis and assumptions you made in
comparative analysis
There are relevant problems that can be identified for the ratio analysis, which have
negative impact on the overall investment options of the investors. The financial performance of
the organisation is mainly derived from relevant ratios, which can be maintained by the wrong
information presented in the annual report. There are many instances, where the organisation has
presented manipulative annual report to project higher financial performance to their
investments. In this instance the investors are not able to gather the required information
regarding the current financial performance of the company, which helps in their investment
decisions. Moreover, the major limitation of the financial ratios is that it can evaluate the
historical performance of the company and do not provide relevant information on the future
prospects of the company (Ozturk and Serçemeli 2016). The financial ratios are not able to
analyse all the relevant information of and organisation to detect its future growth, whereas the
trend analysis does not present the actual fluctuations in profitability that would be maintained
by the company under different economic and global conditions. Hence, investors can use both
fundamental and technical analysis to determine the overall financial performance of the
organisation, which could help in generating high level of income from investment.
21MBA-FINANCIAL ANALYSIS AND MANAGEMENT
Conclusion:
The overall financial performance of Tesco and Sainsbury is mainly evaluated in the
above assessment, which can eventually help in determining the accurate financial performance.
From the relevant analysis, it can be detected that the current financial performance of the both
Tesco and Sainsbury have depicted about the most viable investment option. Therefore, from the
relevant information, it can be detected that the current financial performance of the of Tesco is
much better than Sainsbury, which can allow the investor to generate higher returns on
investment. Hence, investment needs to be conducted in Tesco plc, while no investment in
Sainsbury.
Secure Best Marks with AI Grader
Need help grading? Try our AI Grader for instant feedback on your assignments.
22MBA-FINANCIAL ANALYSIS AND MANAGEMENT
Reference and Bibliography:
About.sainsburys.co.uk. 2019. Welcome to Sainsburys Home. [online] Available at:
https://www.about.sainsburys.co.uk/ [Accessed 17 Apr. 2019].
Arkan, T., 2016. The importance of financial ratios in predicting stock price trends: A case study
in emerging markets. Finanse, Rynki Finansowe, Ubezpieczenia, 79(1), pp.13-26.
Atoom, R., Malkawi, E. and Al Share, B., 2017. Utilizing Australian Shareholders' Association
(ASA): Fifteen Top Financial Ratios to Evaluate Jordanian Banks' Performance. Journal of
Applied Finance and Banking, 7(1), p.119.
Bawa, J.K., Goyal, V., Mitra, S.K. and Basu, S., 2018. An analysis of NPAs of Indian banks:
Using a comprehensive framework of 31 financial ratios. IIMB Management Review.
Chiaramonte, L. and Casu, B., 2017. Capital and liquidity ratios and financial distress. Evidence
from the European banking industry. The British Accounting Review, 49(2), pp.138-161.
Goyal, S. and Bhatia, A., 2016. Analysis of Financial Ratios for Measuring Performance of
Indian Public Sector Banks. International Journal of Engineering and Management Research
(IJEMR), 6(2), pp.152-162.
Gullett, N.S., Kilgore, R.W. and Geddie, M.F., 2018. Use of Financial Ratios to Measure the
Quality of Earnings. Academy of Accounting and Financial Studies Journal.
Haskins, M.E. and Haskins, M.E., 2017. Remington, Inc.: Instant Insights for Financial
Ratios. Darden Business Publishing Cases, pp.1-7.
23MBA-FINANCIAL ANALYSIS AND MANAGEMENT
Hosaka, T., 2019. Bankruptcy prediction using imaged financial ratios and convolutional neural
networks. Expert Systems with Applications, 117, pp.287-299.
Le, H.H. and Viviani, J.L., 2018. Predicting bank failure: An improvement by implementing a
machine-learning approach to classical financial ratios. Research in International Business and
Finance, 44, pp.16-25.
Lukason, O., Laitinen, E.K. and Suvas, A., 2015. Growth patterns of small manufacturing firms
before failure: interconnections with financial ratios and nonfinancial variables. International
Journal of Industrial Engineering and Management, 6(2), pp.59-66.
Meriç, E., Kamışlı, M. and Temizel, F., 2017. Interactions among Stock Price and Financial
Ratios: The Case of Turkish Banking Sector. Applied Economics and Finance, 4(6), pp.107-115.
Mishra, S. and Bansal, R., 2019. Credit Rating and Its Interaction With Financial Ratios: A
Study of BSE 500 Companies. In Behavioral Finance and Decision-Making Models (pp. 251-
268). IGI Global.
Misund, B., 2017. Financial ratios and prediction on corporate bankruptcy in the Atlantic salmon
industry. Aquaculture economics & management, 21(2), pp.241-260.
Morales-Díaz, J. and Zamora-Ramírez, C., 2018. The impact of IFRS 16 on key financial ratios:
a new methodological approach. Accounting in Europe, 15(1), pp.105-133.
Neal, R.S. and Trzcinka, C., 2016. Financial markets 2017: Make P/E ratios great again. Indiana
Business Review, 91(4), pp.1-4.
Neal, R.S. and Trzcinka, C., 2017. Financial markets 2018: P/E ratios are great again. Indiana
Business Review, 92(4), pp.1-4.
24MBA-FINANCIAL ANALYSIS AND MANAGEMENT
Nia, S.H., 2015. Financial ratios between fraudulent and non-fraudulent firms: Evidence from
Tehran Stock Exchange. Journal of Accounting and Taxation, 7(3), pp.38-44.
Nuryani, N., Heng, T.T. and Juliesta, N., 2015. Capitalization of Operating Lease and Its Impact
on Firm's Financial Ratios. Procedia-Social and Behavioral Sciences, 211, pp.268-276.
Öztürk, M. and Serçemeli, M., 2016. Impact of New Standard" IFRS 16 Leases" on Statement of
Financial Position and Key Ratios: A Case Study on an Airline Company in Turkey. Business
and Economics Research Journal, 7(4), p.143.
Shaverdi, M., Ramezani, I., Tahmasebi, R. and Rostamy, A.A.A., 2016. Combining fuzzy AHP
and fuzzy TOPSIS with financial ratios to design a novel performance evaluation
model. International Journal of Fuzzy Systems, 18(2), pp.248-262.
Tesco plc. 2019. Tesco PLC. [online] Available at: https://www.tescoplc.com/ [Accessed 17 Apr.
2019].
Tian, S. and Yu, Y., 2017. Financial ratios and bankruptcy predictions: An international
evidence. International Review of Economics & Finance, 51, pp.510-526.
Wong, K. and Joshi, M., 2015. The impact of lease capitalisation on financial statements and key
ratios: Evidence from Australia. Australasian Accounting, Business and Finance Journal, 9(3),
pp.27-44.
Paraphrase This Document
Need a fresh take? Get an instant paraphrase of this document with our AI Paraphraser
25MBA-FINANCIAL ANALYSIS AND MANAGEMENT
Appendices:
RATIO ANALYSIS
TESC
O 2018 2017 2016 2015 2014
1
PROFITABILITY
RATIOS
1
.
1
ASSET
UTILISATION Revenue
57,49
1 55,917 54,433 56,925 63,557
Total Assets
44,86
2 45,853 43,904 44,214 50,164
1.28 1.22 1.24 1.29 1.27
1
.
2 MARGINS
Operating
Margin
TESCO Operating Profit 1,837 1,017 1,046 (5,750) 2,631
Revenue
57,49
1 55,917 54,433 56,925 63,557
3.2 1.8 1.9 (10.1) 4.1
Net Margin
TESCO
Profit for the
Year 1,208 (54) 129 (5,766) 970
Revenue
57,49
1 55,917 54,433 56,925 63,557
2.1 (0.1) 0.2 (10.1) 1.5
1
.
3 RETURNS
Operating
Returns
TESCO Operating Profit 1,837 1,017 1,046 (5,750) 2,631
Total Assets
44,86 45,853 43,904 44,214 50,164
26MBA-FINANCIAL ANALYSIS AND MANAGEMENT
2
4.1 2.2 2.4 (13.0) 5.2
Net ROI
TESCO
Profit for the
Year 1,208 (54) 129 (5,766) 970
Total Assets
44,86
2 45,853 43,904 44,214 50,164
2.7 (0.1) 0.3 (13.0) 1.9
2
LIQUIDITY
RATIOS
2.
1
Acid Test
Ratio
TESCO CCE + AR 5,541 5,296 4,689 4,286 4,696
Total Current
Liabilities
19,23
8 19,234 19,714 19,805 20,206
28.8 27.5 23.8 21.6 23.2
2.
2
Cash Ratio
TESCO
Cash and Cash
Equivalents 4,059 3,821 3,082 2,165 2,506
Total Current
Liabilities
19,23
8 19,234 19,714 19,805 20,206
21.1 19.9 15.6 10.9 12.4
Therefore AR per $ of
Current Liabilities = 7.70 7.67 8.15 10.71 10.84
3
WORKING CAPITAL RATIOS (OR
EFFICIENCY RATIOS)
3.
1
CURRENT
Ratio
TESCO Current Assets
13,57
7 15,073 14,592 11,819 13,085
Current
Liabilities
19,23
8 19,234 19,714 19,805 20,206
0.7 0.8 0.7 0.6 0.6
3. INVENTOR Inventory * 365
2
4.1 2.2 2.4 (13.0) 5.2
Net ROI
TESCO
Profit for the
Year 1,208 (54) 129 (5,766) 970
Total Assets
44,86
2 45,853 43,904 44,214 50,164
2.7 (0.1) 0.3 (13.0) 1.9
2
LIQUIDITY
RATIOS
2.
1
Acid Test
Ratio
TESCO CCE + AR 5,541 5,296 4,689 4,286 4,696
Total Current
Liabilities
19,23
8 19,234 19,714 19,805 20,206
28.8 27.5 23.8 21.6 23.2
2.
2
Cash Ratio
TESCO
Cash and Cash
Equivalents 4,059 3,821 3,082 2,165 2,506
Total Current
Liabilities
19,23
8 19,234 19,714 19,805 20,206
21.1 19.9 15.6 10.9 12.4
Therefore AR per $ of
Current Liabilities = 7.70 7.67 8.15 10.71 10.84
3
WORKING CAPITAL RATIOS (OR
EFFICIENCY RATIOS)
3.
1
CURRENT
Ratio
TESCO Current Assets
13,57
7 15,073 14,592 11,819 13,085
Current
Liabilities
19,23
8 19,234 19,714 19,805 20,206
0.7 0.8 0.7 0.6 0.6
3. INVENTOR Inventory * 365
27MBA-FINANCIAL ANALYSIS AND MANAGEMENT
2
Y PERIOD
TESCO
825,9
95
839,86
5 886,950
1,079,3
05
1,305,
240
Cost of Sales
53,01
5 54,141 59,128 51,579 59,547
15.6 15.5 15.0 20.9 21.9
3.
3
AR
PERIOD
TESCO
Accounts
Receivable * 365
540,9
30
538,37
5 586,555
774,16
5
799,35
0
Revenue
57,49
1 55,917 54,433 56,925 63,557
3,434.
3
3,514.
3 3,933.1 4,963.9
4,590.
6
GROSS ASSET CONVERSION =
Inventory Period + AR Period =
3,449.
8
3,529.
8 3,948.1 4,984.8
4,612.
5
3.
4
AP
PERIOD
TESCO
Accounts
Payable * 365
3,283,
540
3,239,
375
3,127,3
20
3,621,5
30
3,867,
175
(Accts
Payable ) Cost of Sales
53,01
5 54,141 59,128 51,579 59,547
22,60
6.7
21,838
.8
19,305.
1
25,627.
8
23,704
.3
WORKING CAPITAL CYCLE =
(3.2 + 3.3) - 3.4
-
19156
.8128
7
-
18308.
97953
-
15356.9
5754
-
20643.
01266
-
19091.
79411
4 DEBT MANAGEMENT
4.
1
Gearing %
TESCO
Total Long
Term Liabilities 7,142 9,433 10,711 10,651 9,303
Total Equity
10,45
8 6,414 8,616 7,071 14,722
68.3 147.1 124.3 150.6 63.2
4.
2
Asset
Financing
Total Borrowing
8,621 11,993 13,537 12,659 9,402
2
Y PERIOD
TESCO
825,9
95
839,86
5 886,950
1,079,3
05
1,305,
240
Cost of Sales
53,01
5 54,141 59,128 51,579 59,547
15.6 15.5 15.0 20.9 21.9
3.
3
AR
PERIOD
TESCO
Accounts
Receivable * 365
540,9
30
538,37
5 586,555
774,16
5
799,35
0
Revenue
57,49
1 55,917 54,433 56,925 63,557
3,434.
3
3,514.
3 3,933.1 4,963.9
4,590.
6
GROSS ASSET CONVERSION =
Inventory Period + AR Period =
3,449.
8
3,529.
8 3,948.1 4,984.8
4,612.
5
3.
4
AP
PERIOD
TESCO
Accounts
Payable * 365
3,283,
540
3,239,
375
3,127,3
20
3,621,5
30
3,867,
175
(Accts
Payable ) Cost of Sales
53,01
5 54,141 59,128 51,579 59,547
22,60
6.7
21,838
.8
19,305.
1
25,627.
8
23,704
.3
WORKING CAPITAL CYCLE =
(3.2 + 3.3) - 3.4
-
19156
.8128
7
-
18308.
97953
-
15356.9
5754
-
20643.
01266
-
19091.
79411
4 DEBT MANAGEMENT
4.
1
Gearing %
TESCO
Total Long
Term Liabilities 7,142 9,433 10,711 10,651 9,303
Total Equity
10,45
8 6,414 8,616 7,071 14,722
68.3 147.1 124.3 150.6 63.2
4.
2
Asset
Financing
Total Borrowing
8,621 11,993 13,537 12,659 9,402
Secure Best Marks with AI Grader
Need help grading? Try our AI Grader for instant feedback on your assignments.
28MBA-FINANCIAL ANALYSIS AND MANAGEMENT
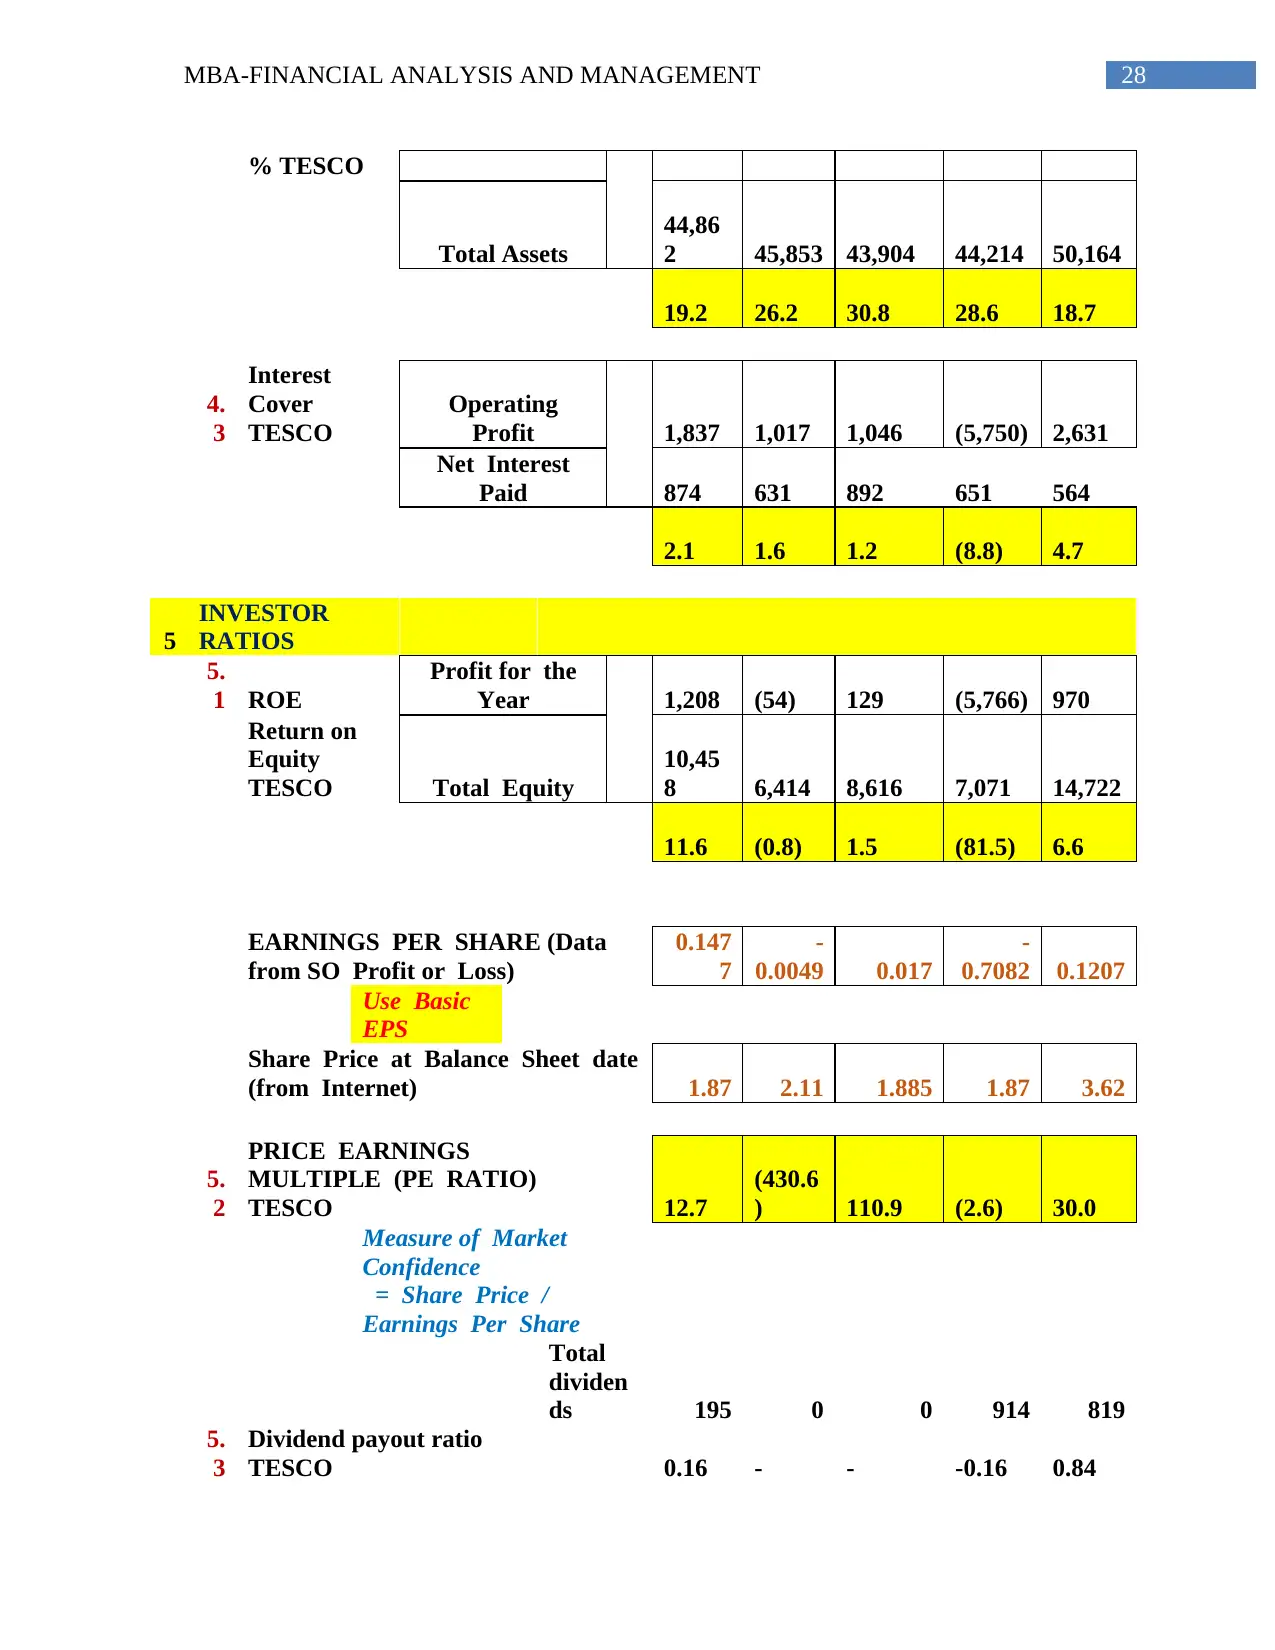
% TESCO
Total Assets
44,86
2 45,853 43,904 44,214 50,164
19.2 26.2 30.8 28.6 18.7
4.
3
Interest
Cover
TESCO
Operating
Profit 1,837 1,017 1,046 (5,750) 2,631
Net Interest
Paid 874 631 892 651 564
2.1 1.6 1.2 (8.8) 4.7
5
INVESTOR
RATIOS
5.
1 ROE
Profit for the
Year 1,208 (54) 129 (5,766) 970
Return on
Equity
TESCO Total Equity
10,45
8 6,414 8,616 7,071 14,722
11.6 (0.8) 1.5 (81.5) 6.6
EARNINGS PER SHARE (Data
from SO Profit or Loss)
0.147
7
-
0.0049 0.017
-
0.7082 0.1207
Use Basic
EPS
Share Price at Balance Sheet date
(from Internet) 1.87 2.11 1.885 1.87 3.62
5.
2
PRICE EARNINGS
MULTIPLE (PE RATIO)
TESCO 12.7
(430.6
) 110.9 (2.6) 30.0
Measure of Market
Confidence
= Share Price /
Earnings Per Share
Total
dividen
ds 195 0 0 914 819
5.
3
Dividend payout ratio
TESCO 0.16 - - -0.16 0.84
29MBA-FINANCIAL ANALYSIS AND MANAGEMENT
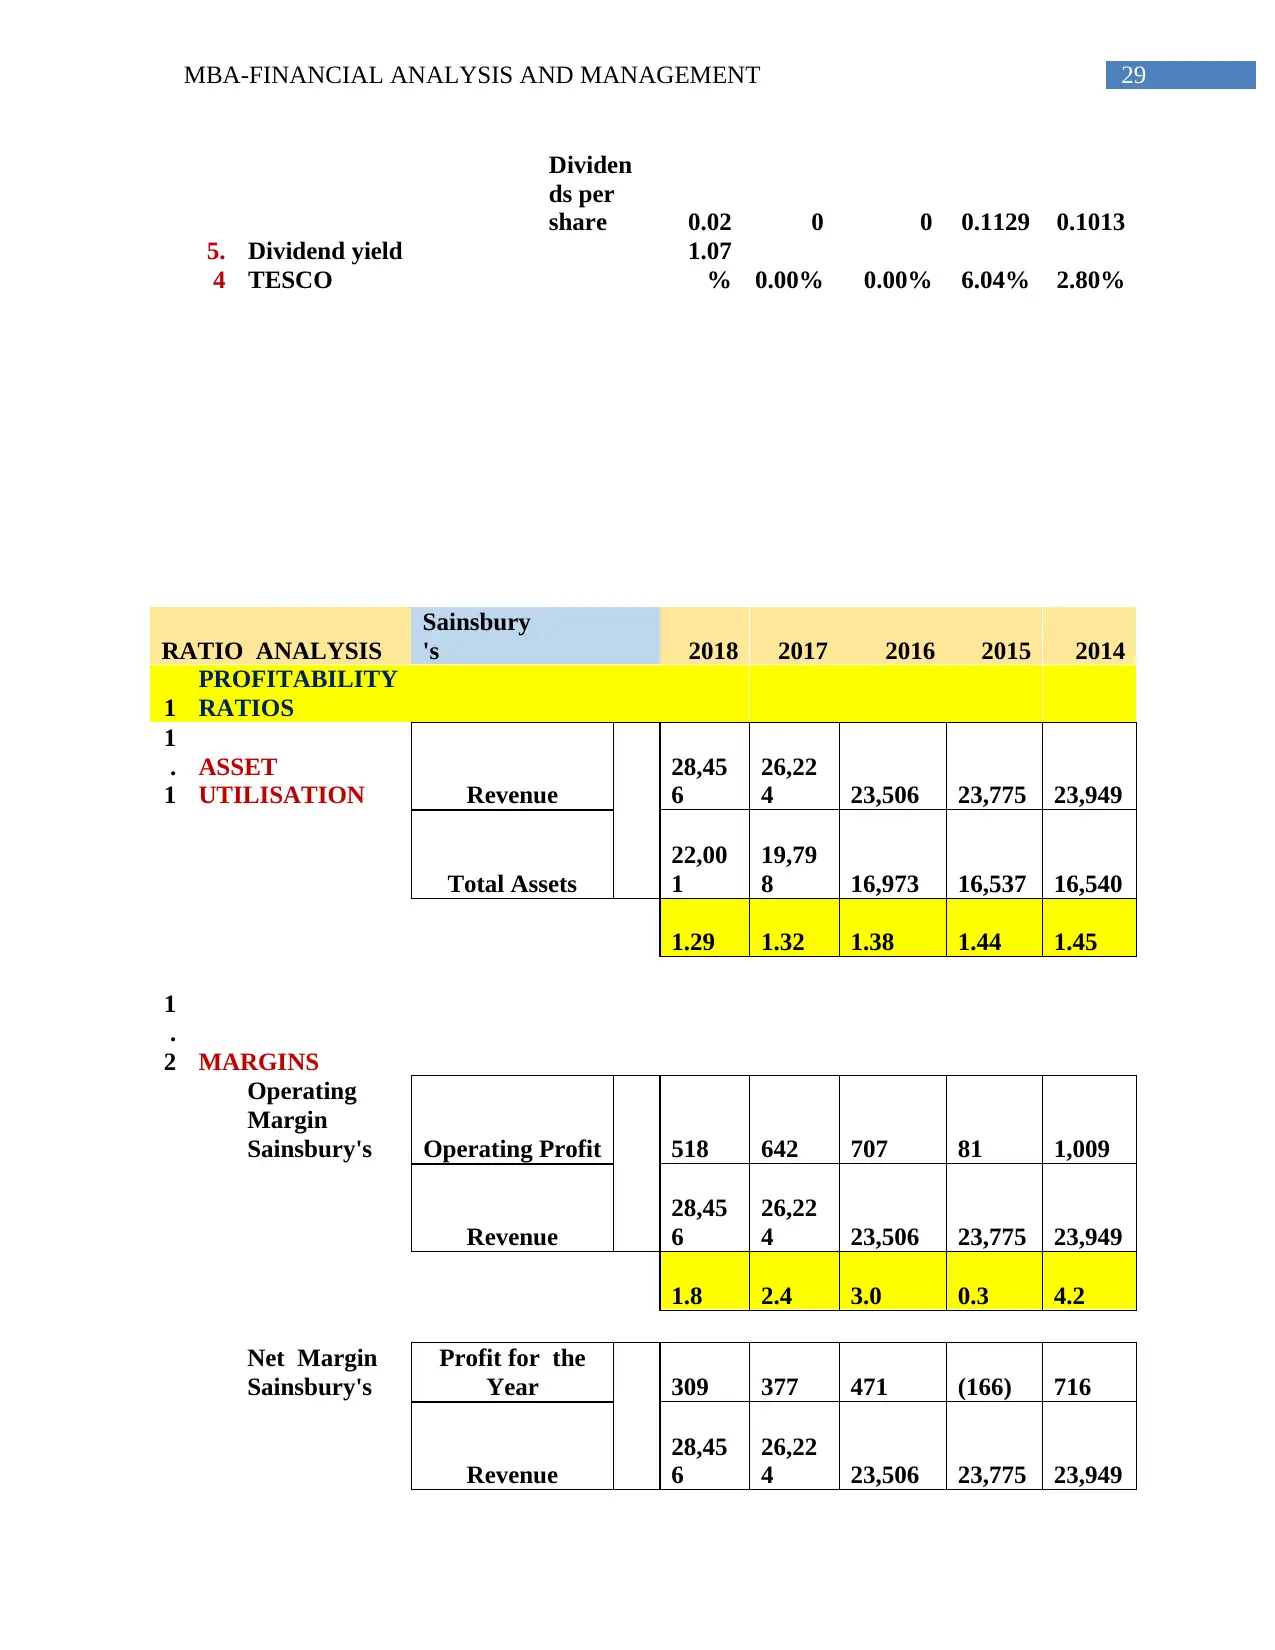
Dividen
ds per
share 0.02 0 0 0.1129 0.1013
5.
4
Dividend yield
TESCO
1.07
% 0.00% 0.00% 6.04% 2.80%
RATIO ANALYSIS
Sainsbury
's 2018 2017 2016 2015 2014
1
PROFITABILITY
RATIOS
1
.
1
ASSET
UTILISATION Revenue
28,45
6
26,22
4 23,506 23,775 23,949
Total Assets
22,00
1
19,79
8 16,973 16,537 16,540
1.29 1.32 1.38 1.44 1.45
1
.
2 MARGINS
Operating
Margin
Sainsbury's Operating Profit 518 642 707 81 1,009
Revenue
28,45
6
26,22
4 23,506 23,775 23,949
1.8 2.4 3.0 0.3 4.2
Net Margin
Sainsbury's
Profit for the
Year 309 377 471 (166) 716
Revenue
28,45
6
26,22
4 23,506 23,775 23,949
30MBA-FINANCIAL ANALYSIS AND MANAGEMENT
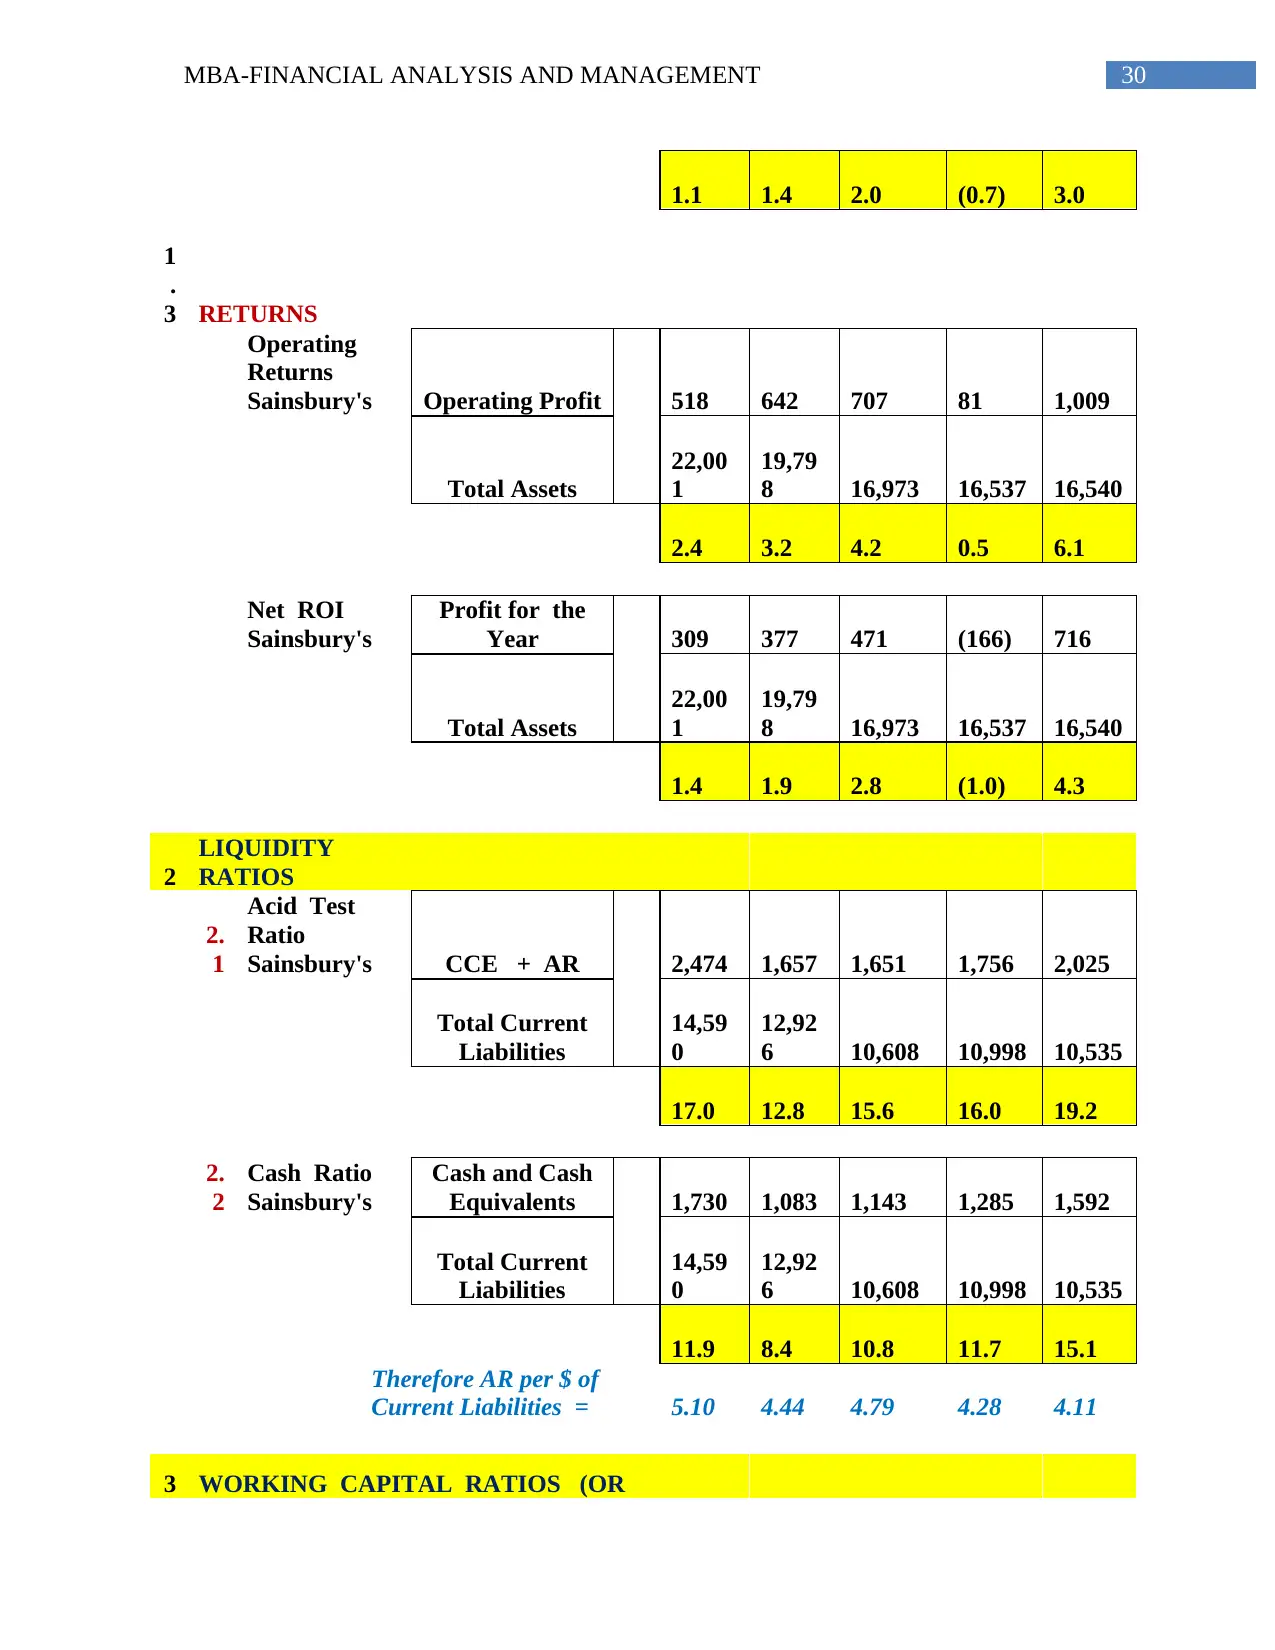
1.1 1.4 2.0 (0.7) 3.0
1
.
3 RETURNS
Operating
Returns
Sainsbury's Operating Profit 518 642 707 81 1,009
Total Assets
22,00
1
19,79
8 16,973 16,537 16,540
2.4 3.2 4.2 0.5 6.1
Net ROI
Sainsbury's
Profit for the
Year 309 377 471 (166) 716
Total Assets
22,00
1
19,79
8 16,973 16,537 16,540
1.4 1.9 2.8 (1.0) 4.3
2
LIQUIDITY
RATIOS
2.
1
Acid Test
Ratio
Sainsbury's CCE + AR 2,474 1,657 1,651 1,756 2,025
Total Current
Liabilities
14,59
0
12,92
6 10,608 10,998 10,535
17.0 12.8 15.6 16.0 19.2
2.
2
Cash Ratio
Sainsbury's
Cash and Cash
Equivalents 1,730 1,083 1,143 1,285 1,592
Total Current
Liabilities
14,59
0
12,92
6 10,608 10,998 10,535
11.9 8.4 10.8 11.7 15.1
Therefore AR per $ of
Current Liabilities = 5.10 4.44 4.79 4.28 4.11
3 WORKING CAPITAL RATIOS (OR
Paraphrase This Document
Need a fresh take? Get an instant paraphrase of this document with our AI Paraphraser
31MBA-FINANCIAL ANALYSIS AND MANAGEMENT
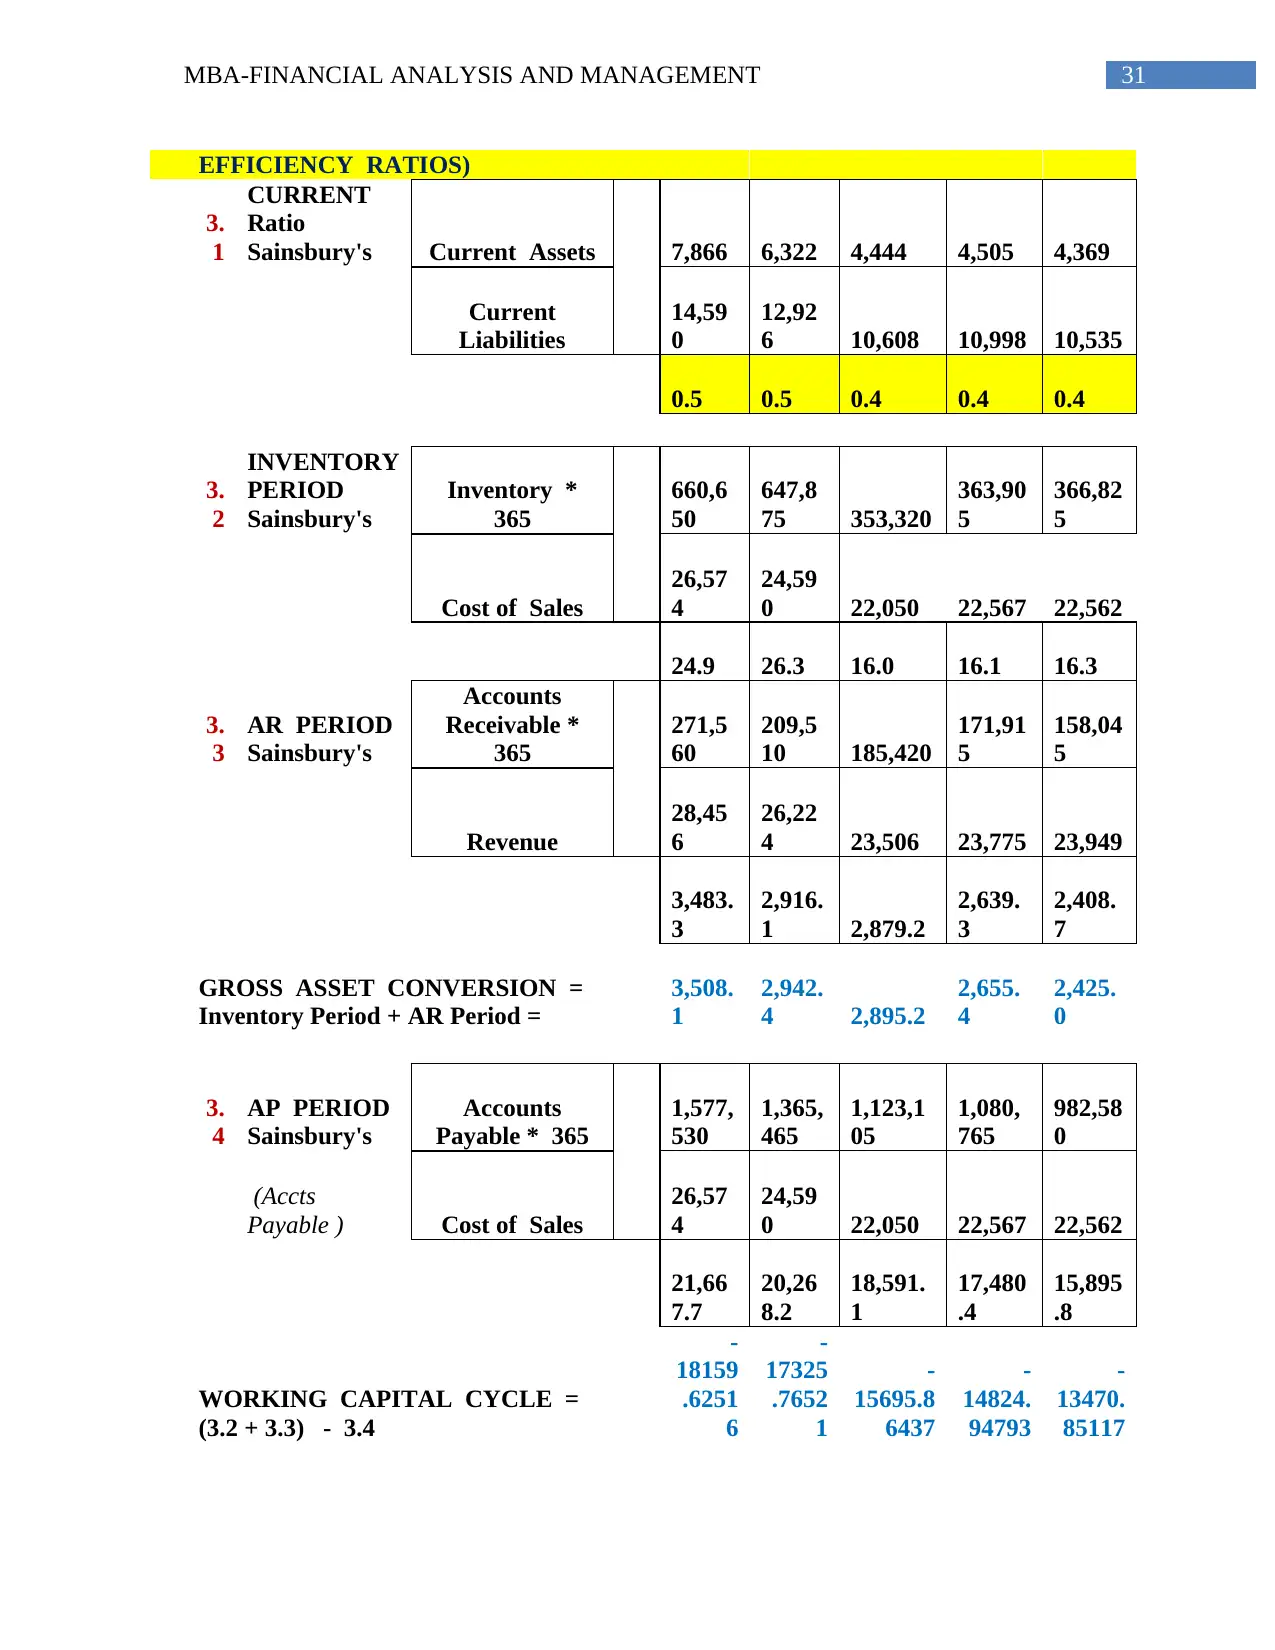
EFFICIENCY RATIOS)
3.
1
CURRENT
Ratio
Sainsbury's Current Assets 7,866 6,322 4,444 4,505 4,369
Current
Liabilities
14,59
0
12,92
6 10,608 10,998 10,535
0.5 0.5 0.4 0.4 0.4
3.
2
INVENTORY
PERIOD
Sainsbury's
Inventory *
365
660,6
50
647,8
75 353,320
363,90
5
366,82
5
Cost of Sales
26,57
4
24,59
0 22,050 22,567 22,562
24.9 26.3 16.0 16.1 16.3
3.
3
AR PERIOD
Sainsbury's
Accounts
Receivable *
365
271,5
60
209,5
10 185,420
171,91
5
158,04
5
Revenue
28,45
6
26,22
4 23,506 23,775 23,949
3,483.
3
2,916.
1 2,879.2
2,639.
3
2,408.
7
GROSS ASSET CONVERSION =
Inventory Period + AR Period =
3,508.
1
2,942.
4 2,895.2
2,655.
4
2,425.
0
3.
4
AP PERIOD
Sainsbury's
Accounts
Payable * 365
1,577,
530
1,365,
465
1,123,1
05
1,080,
765
982,58
0
(Accts
Payable ) Cost of Sales
26,57
4
24,59
0 22,050 22,567 22,562
21,66
7.7
20,26
8.2
18,591.
1
17,480
.4
15,895
.8
WORKING CAPITAL CYCLE =
(3.2 + 3.3) - 3.4
-
18159
.6251
6
-
17325
.7652
1
-
15695.8
6437
-
14824.
94793
-
13470.
85117
32MBA-FINANCIAL ANALYSIS AND MANAGEMENT
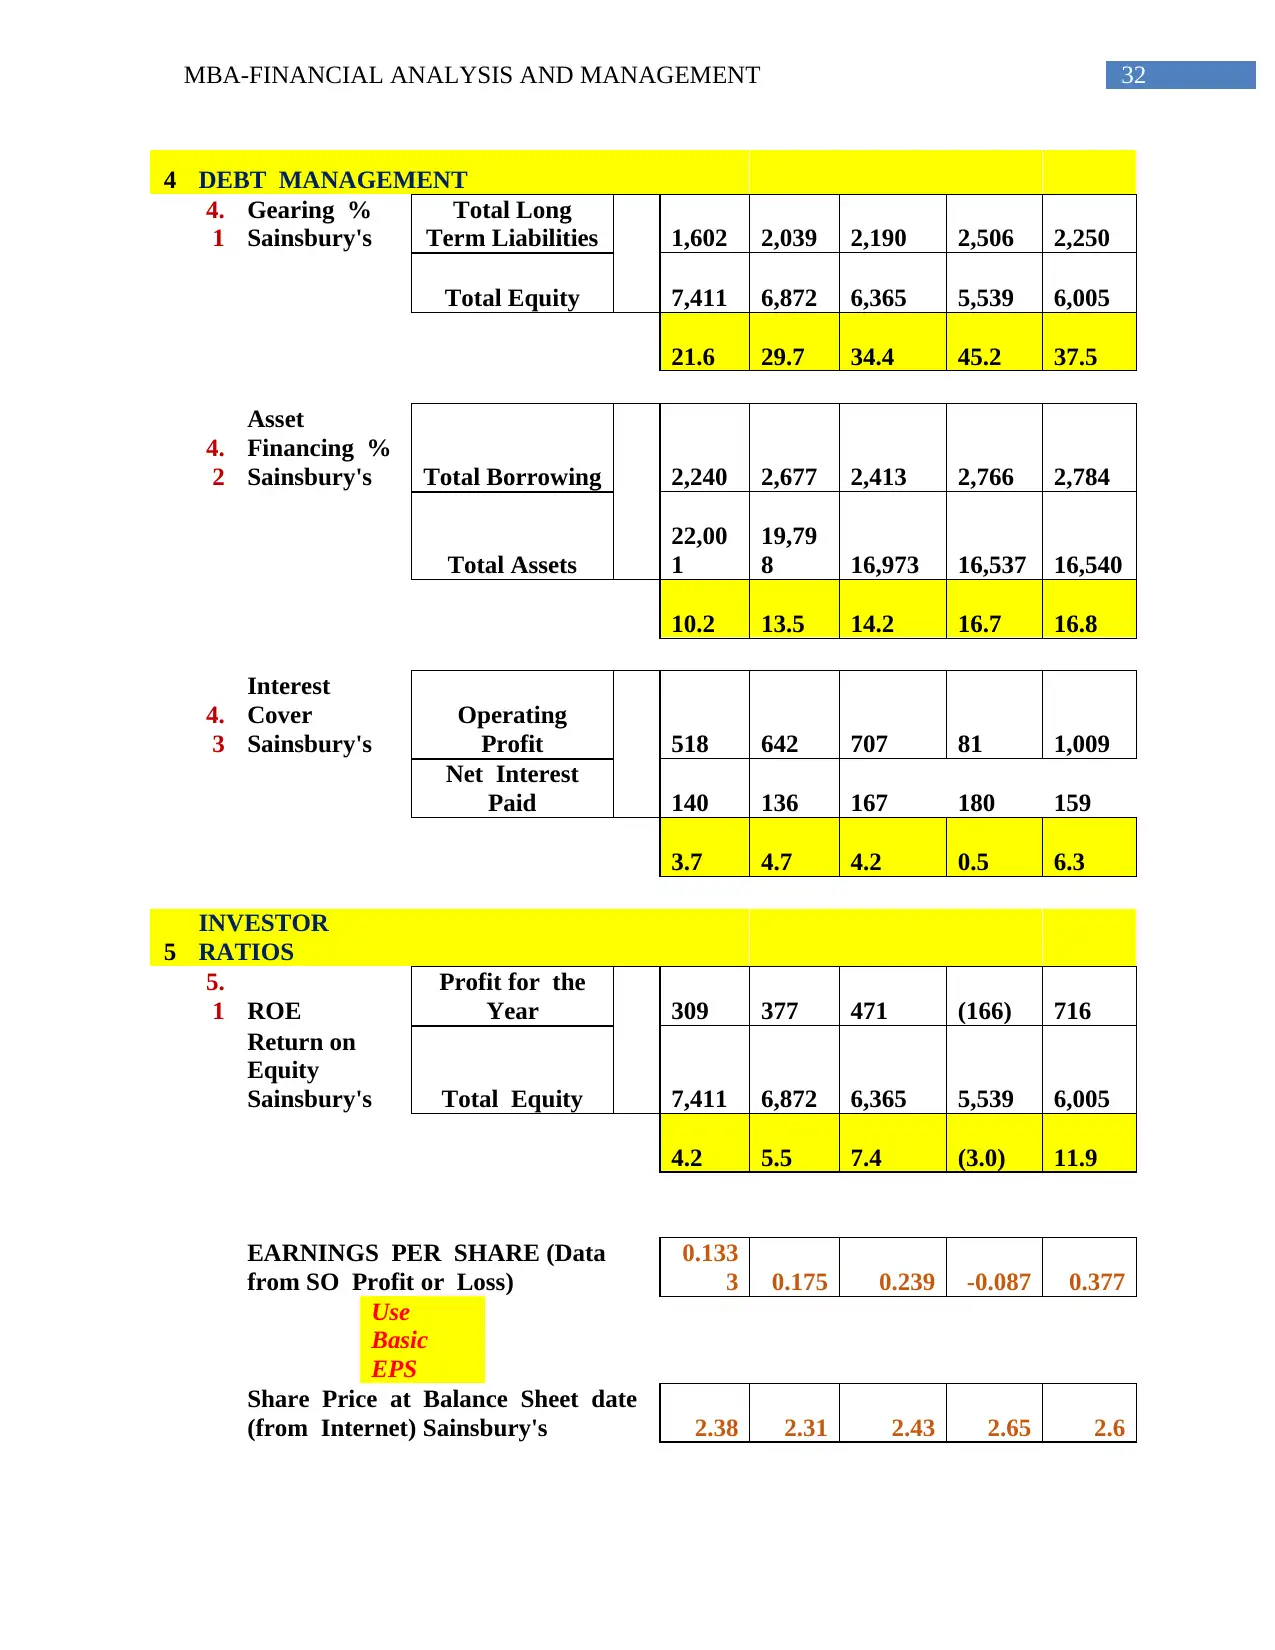
4 DEBT MANAGEMENT
4.
1
Gearing %
Sainsbury's
Total Long
Term Liabilities 1,602 2,039 2,190 2,506 2,250
Total Equity 7,411 6,872 6,365 5,539 6,005
21.6 29.7 34.4 45.2 37.5
4.
2
Asset
Financing %
Sainsbury's Total Borrowing 2,240 2,677 2,413 2,766 2,784
Total Assets
22,00
1
19,79
8 16,973 16,537 16,540
10.2 13.5 14.2 16.7 16.8
4.
3
Interest
Cover
Sainsbury's
Operating
Profit 518 642 707 81 1,009
Net Interest
Paid 140 136 167 180 159
3.7 4.7 4.2 0.5 6.3
5
INVESTOR
RATIOS
5.
1 ROE
Profit for the
Year 309 377 471 (166) 716
Return on
Equity
Sainsbury's Total Equity 7,411 6,872 6,365 5,539 6,005
4.2 5.5 7.4 (3.0) 11.9
EARNINGS PER SHARE (Data
from SO Profit or Loss)
0.133
3 0.175 0.239 -0.087 0.377
Use
Basic
EPS
Share Price at Balance Sheet date
(from Internet) Sainsbury's 2.38 2.31 2.43 2.65 2.6
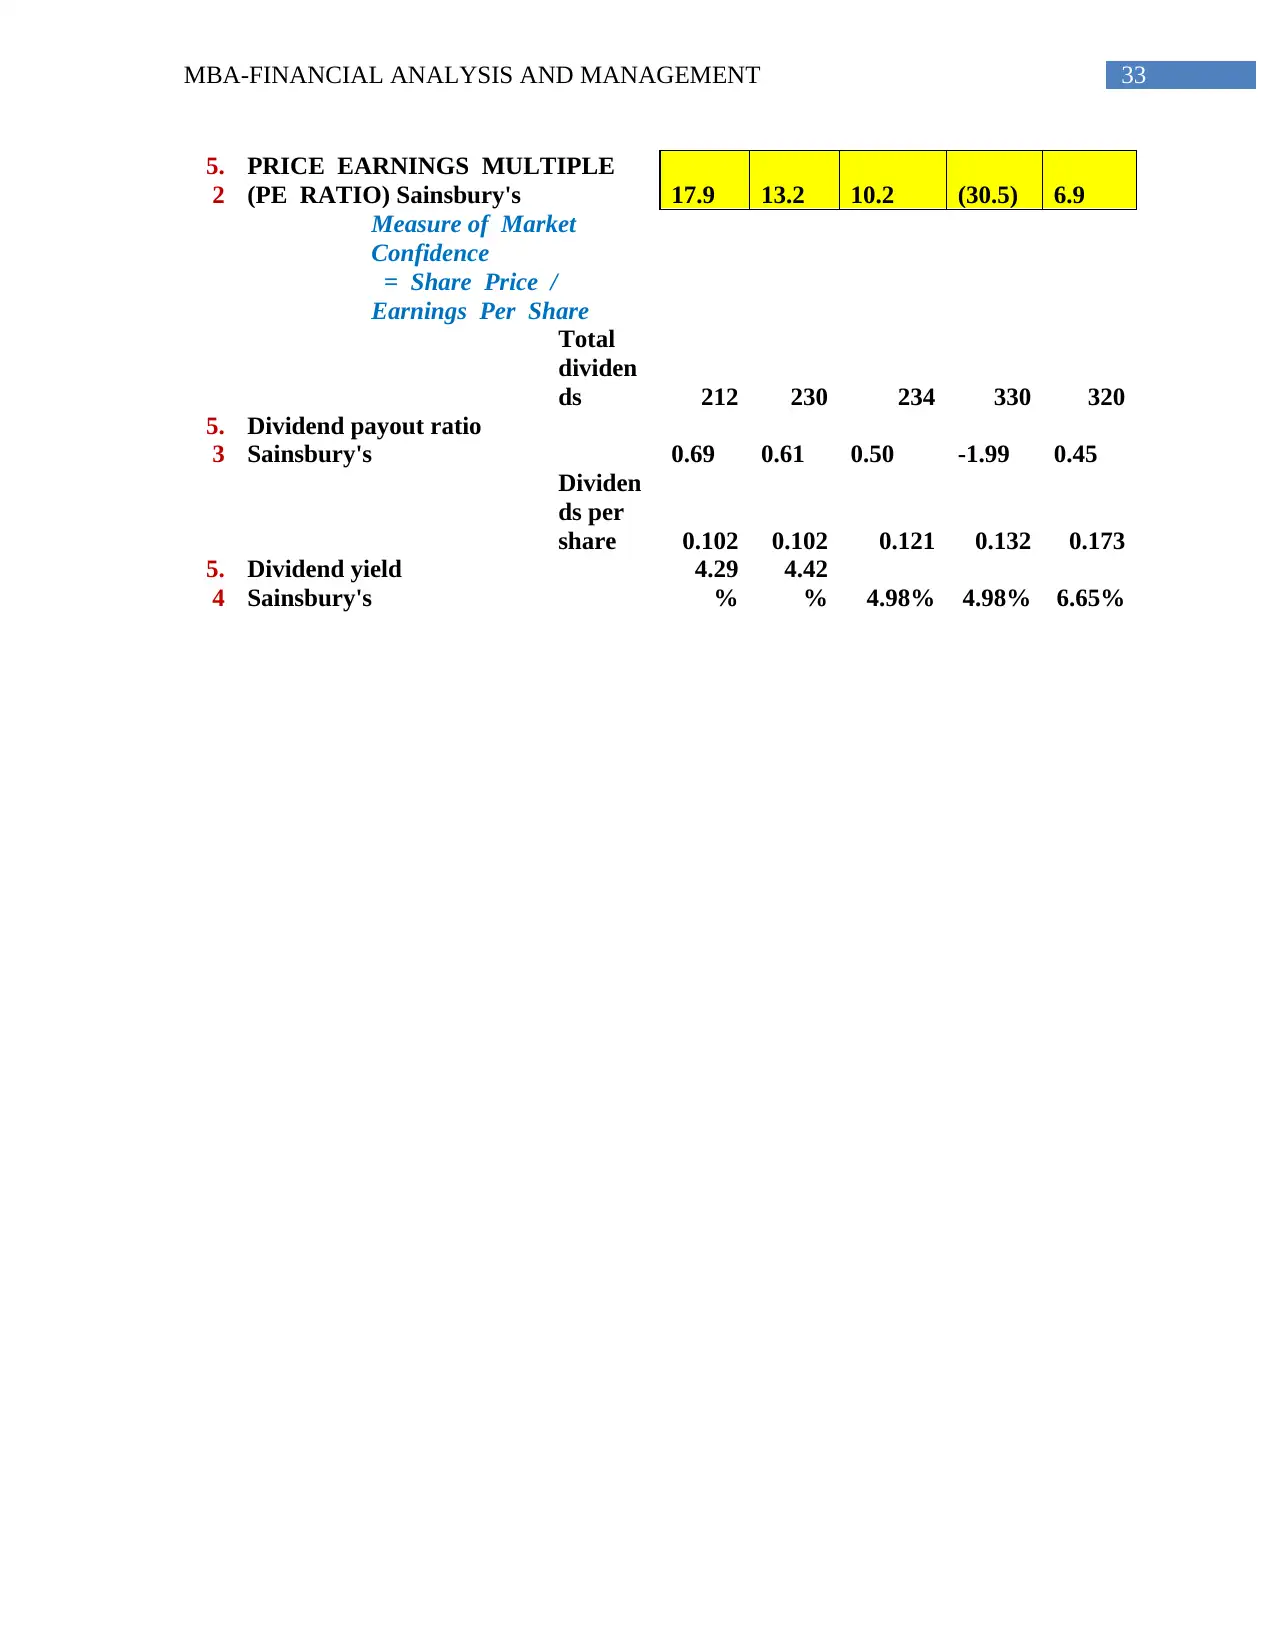
33MBA-FINANCIAL ANALYSIS AND MANAGEMENT
5.
2
PRICE EARNINGS MULTIPLE
(PE RATIO) Sainsbury's 17.9 13.2 10.2 (30.5) 6.9
Measure of Market
Confidence
= Share Price /
Earnings Per Share
Total
dividen
ds 212 230 234 330 320
5.
3
Dividend payout ratio
Sainsbury's 0.69 0.61 0.50 -1.99 0.45
Dividen
ds per
share 0.102 0.102 0.121 0.132 0.173
5.
4
Dividend yield
Sainsbury's
4.29
%
4.42
% 4.98% 4.98% 6.65%
5.
2
PRICE EARNINGS MULTIPLE
(PE RATIO) Sainsbury's 17.9 13.2 10.2 (30.5) 6.9
Measure of Market
Confidence
= Share Price /
Earnings Per Share
Total
dividen
ds 212 230 234 330 320
5.
3
Dividend payout ratio
Sainsbury's 0.69 0.61 0.50 -1.99 0.45
Dividen
ds per
share 0.102 0.102 0.121 0.132 0.173
5.
4
Dividend yield
Sainsbury's
4.29
%
4.42
% 4.98% 4.98% 6.65%
1 out of 34
Related Documents


Your All-in-One AI-Powered Toolkit for Academic Success.
+13062052269
info@desklib.com
Available 24*7 on WhatsApp / Email
![[object Object]](/_next/static/media/star-bottom.7253800d.svg)
Unlock your academic potential
© 2024 | Zucol Services PVT LTD | All rights reserved.