Financial Analysis of XYZ PLC's Investment Strategy - MBA Course
VerifiedAdded on 2023/06/08
|16
|4466
|408
Report
AI Summary
This report provides a financial statement analysis of XYZ plc, focusing on developing analytical and critical thinking skills. It evaluates the company's financial disclosures and other factors influencing its financial stability. The assessment utilizes various financial methods such as the Dividend Discount Model (DDM), Capital Asset Pricing Model (CAPM), Weighted Average Cost of Capital (WACC), Net Present Value (NPV), and Internal Rate of Return (IRR) to assess the organization's financial position. The analysis covers sources of financing, optimum cost of capital, restructuring decisions, sensitivity analysis of projected NPV, and the impact of BREXIT on the UK automobile manufacturing sector. Furthermore, it includes an internal management analysis of XYZ PLC, budget planning, and costing information for different products, ultimately providing a comprehensive understanding of the company's financial dynamics and strategic considerations.

FINANCIAL ANALYSIS
(FINA)
Assessment 2 - Resit
Course - Graduate MBA
Word Count - 3154
(FINA)
Assessment 2 - Resit
Course - Graduate MBA
Word Count - 3154
Paraphrase This Document
Need a fresh take? Get an instant paraphrase of this document with our AI Paraphraser
Overview
This paper presents a financial statement analysis, and the primary goal of the
assessment is to develop analytical, critical thinking and communication
skills using which we can provide a review on the findings, I have reviewed
and analysed few key aspects of XYZ plc financial disclosures, this
document evaluates organisational financial disclosures and other items,
which influences the company’s financial ability. This assessment provides
an understanding of dynamics, which reflect the ability of financial position
of an organisation. Various financial methods and techniques are used in
this assessment like Dividend discount model (DDM), Capital Asset Pricing
Model (CAPM) ; Weighted Average Cost of Capital (WACC); Net Present
Value (NPV), Internal Rate of Return (IRR) etc.,
CONTENTS
Overview
A. Financial analysis related to investment strategy
1. Source of financing
1.i.Dividend Discount Model (DDM) 3
1.ii.Capital Asset Pricing Model (CAPM) 3
1.iii.Merits & Demerits 4
2. Optimum Cost of Capital 5
3. Evaluate the restructuring decision
3.i.Net Present Value (NPV) 5
3.ii.Internal Rate of Return (IRR) 5
4. Analysing the sensitivity of projected NPV
5. Impact of BREXIT 6
B. Financial analysis for internal management
1. XYZ PLC 6
2. Phase 3 Sports Club 8
3. Budget Planning 12
⊘ This is a preview!⊘
Do you want full access?
Subscribe today to unlock all pages.
Trusted by 1+ million students worldwide
A(1) What will be the cost for each source of financing? Consider both DDM
(i.e. Dividend Discount Model) and CAPM (i.e. Capital Asset Pricing
Model) method for common equity. Please provide your comments on
the assumptions of each approach and their merits and limitations.
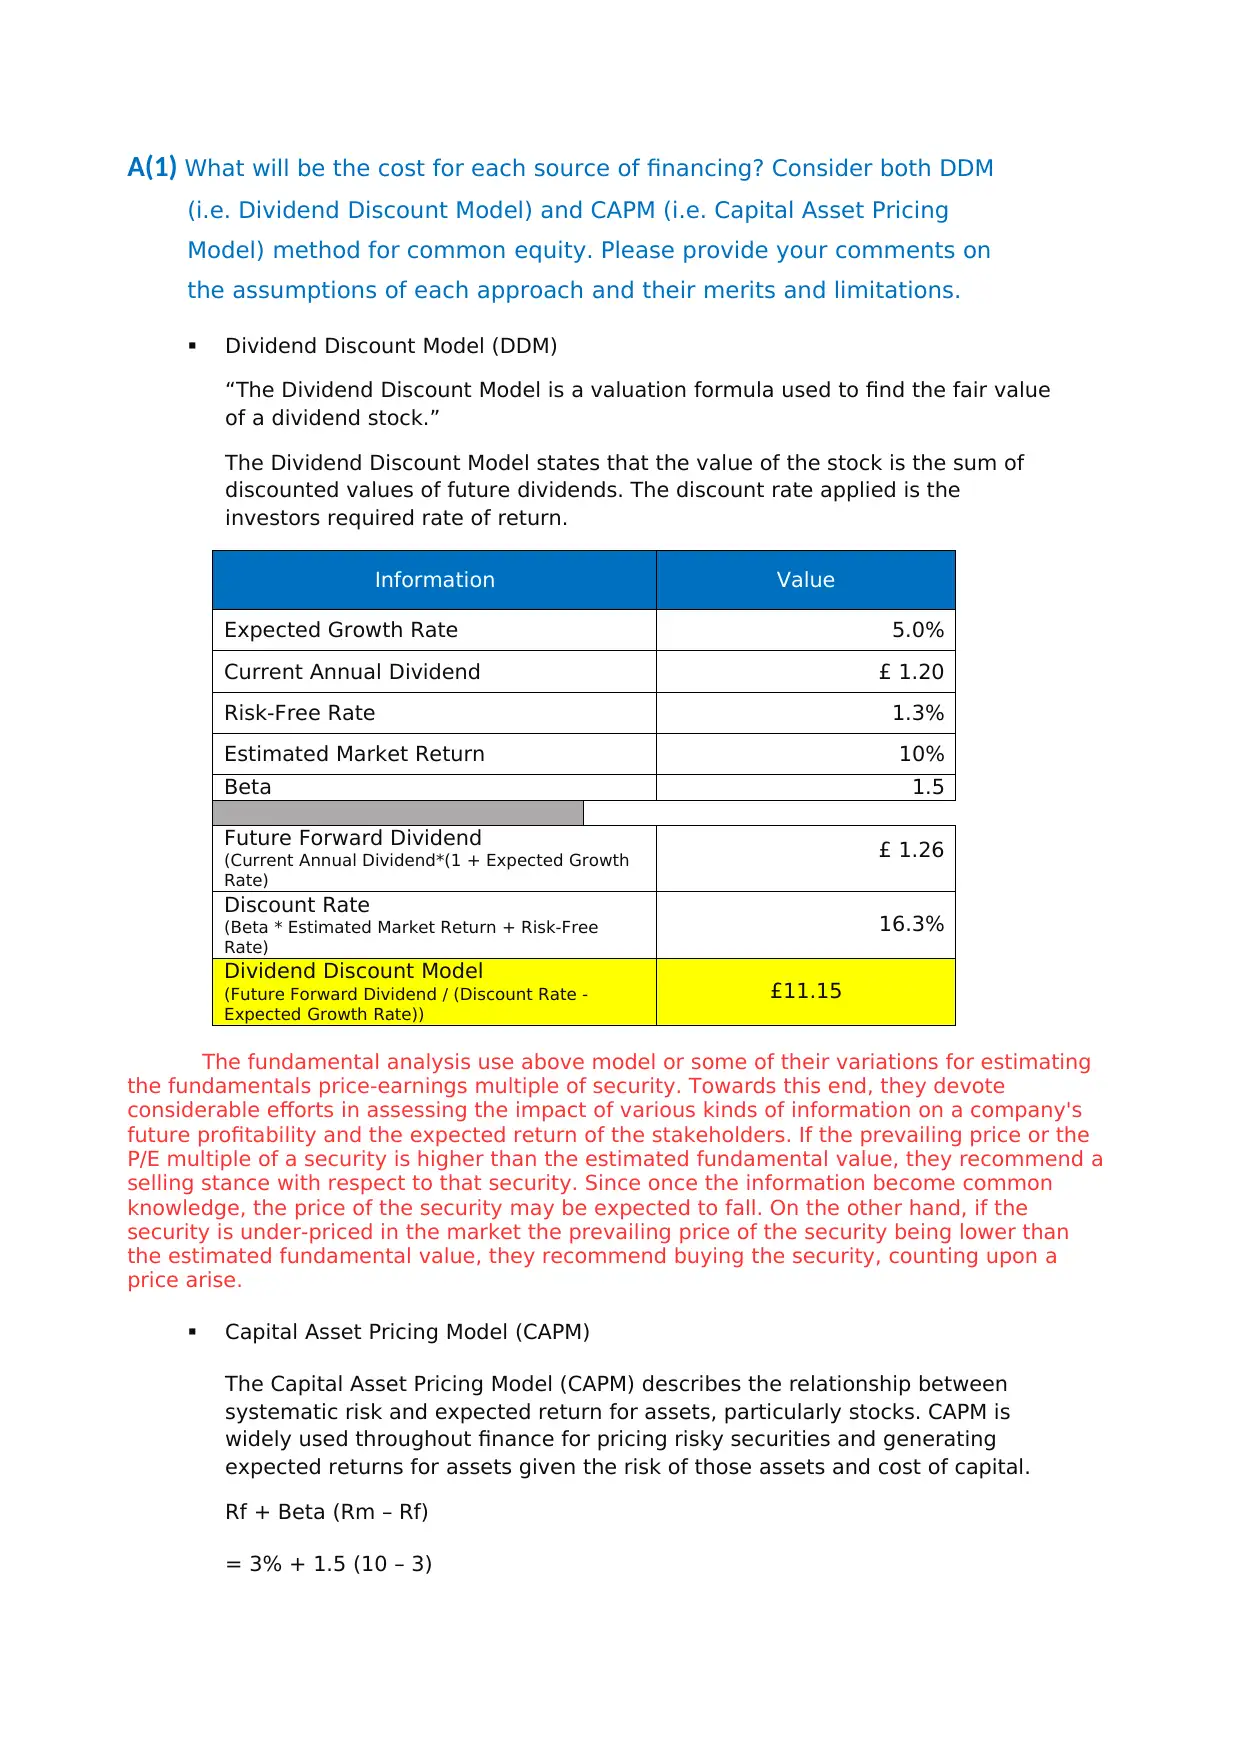
Dividend Discount Model (DDM)
“The Dividend Discount Model is a valuation formula used to find the fair value
of a dividend stock.”
The Dividend Discount Model states that the value of the stock is the sum of
discounted values of future dividends. The discount rate applied is the
investors required rate of return.
Information Value
Expected Growth Rate 5.0%
Current Annual Dividend £ 1.20
Risk-Free Rate 1.3%
Estimated Market Return 10%
Beta 1.5
Future Forward Dividend
(Current Annual Dividend*(1 + Expected Growth
Rate)
£ 1.26
Discount Rate
(Beta * Estimated Market Return + Risk-Free
Rate)
16.3%
Dividend Discount Model
(Future Forward Dividend / (Discount Rate -
Expected Growth Rate))
£11.15
The fundamental analysis use above model or some of their variations for estimating
the fundamentals price-earnings multiple of security. Towards this end, they devote
considerable efforts in assessing the impact of various kinds of information on a company's
future profitability and the expected return of the stakeholders. If the prevailing price or the
P/E multiple of a security is higher than the estimated fundamental value, they recommend a
selling stance with respect to that security. Since once the information become common
knowledge, the price of the security may be expected to fall. On the other hand, if the
security is under-priced in the market the prevailing price of the security being lower than
the estimated fundamental value, they recommend buying the security, counting upon a
price arise.
Capital Asset Pricing Model (CAPM)
The Capital Asset Pricing Model (CAPM) describes the relationship between
systematic risk and expected return for assets, particularly stocks. CAPM is
widely used throughout finance for pricing risky securities and generating
expected returns for assets given the risk of those assets and cost of capital.
Rf + Beta (Rm – Rf)
= 3% + 1.5 (10 – 3)
(i.e. Dividend Discount Model) and CAPM (i.e. Capital Asset Pricing
Model) method for common equity. Please provide your comments on
the assumptions of each approach and their merits and limitations.
Dividend Discount Model (DDM)
“The Dividend Discount Model is a valuation formula used to find the fair value
of a dividend stock.”
The Dividend Discount Model states that the value of the stock is the sum of
discounted values of future dividends. The discount rate applied is the
investors required rate of return.
Information Value
Expected Growth Rate 5.0%
Current Annual Dividend £ 1.20
Risk-Free Rate 1.3%
Estimated Market Return 10%
Beta 1.5
Future Forward Dividend
(Current Annual Dividend*(1 + Expected Growth
Rate)
£ 1.26
Discount Rate
(Beta * Estimated Market Return + Risk-Free
Rate)
16.3%
Dividend Discount Model
(Future Forward Dividend / (Discount Rate -
Expected Growth Rate))
£11.15
The fundamental analysis use above model or some of their variations for estimating
the fundamentals price-earnings multiple of security. Towards this end, they devote
considerable efforts in assessing the impact of various kinds of information on a company's
future profitability and the expected return of the stakeholders. If the prevailing price or the
P/E multiple of a security is higher than the estimated fundamental value, they recommend a
selling stance with respect to that security. Since once the information become common
knowledge, the price of the security may be expected to fall. On the other hand, if the
security is under-priced in the market the prevailing price of the security being lower than
the estimated fundamental value, they recommend buying the security, counting upon a
price arise.
Capital Asset Pricing Model (CAPM)
The Capital Asset Pricing Model (CAPM) describes the relationship between
systematic risk and expected return for assets, particularly stocks. CAPM is
widely used throughout finance for pricing risky securities and generating
expected returns for assets given the risk of those assets and cost of capital.
Rf + Beta (Rm – Rf)
= 3% + 1.5 (10 – 3)
Paraphrase This Document
Need a fresh take? Get an instant paraphrase of this document with our AI Paraphraser
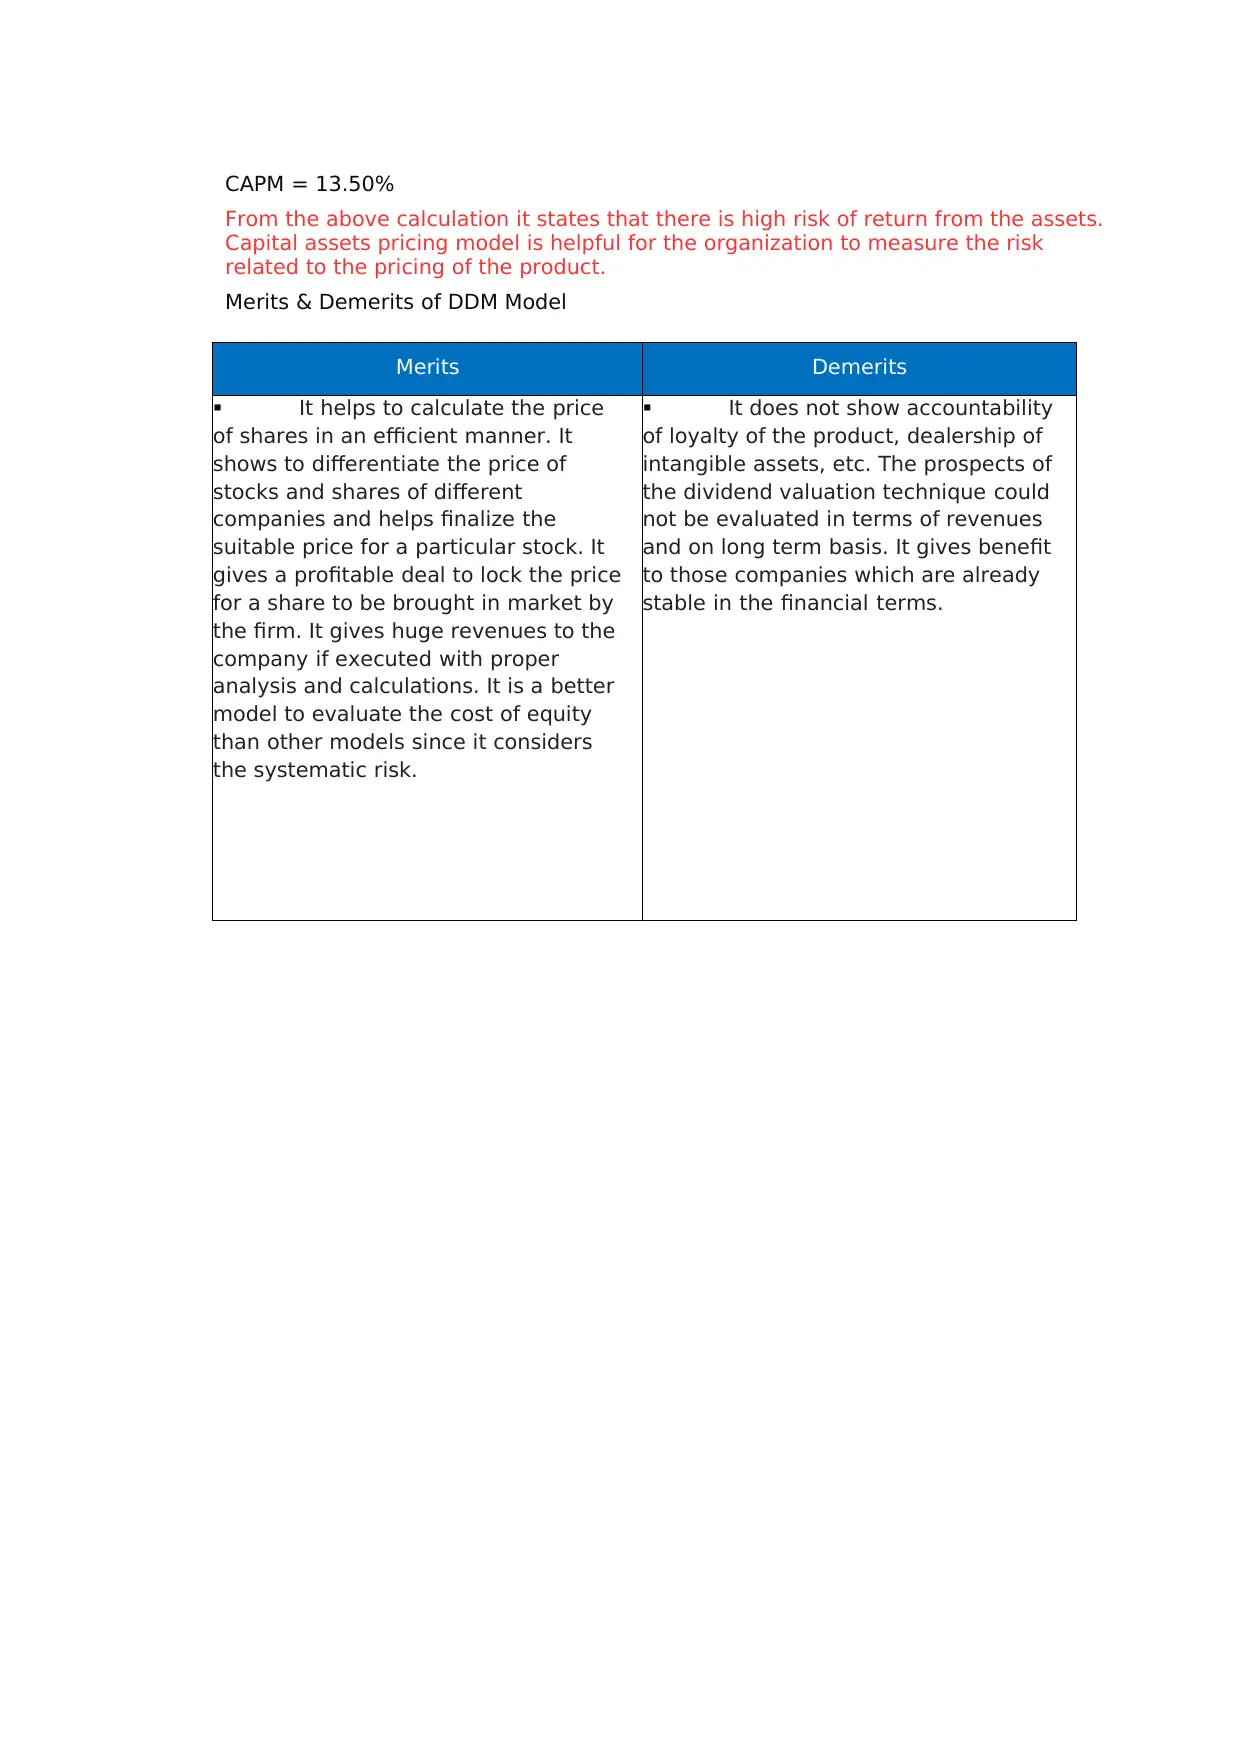
CAPM = 13.50%
From the above calculation it states that there is high risk of return from the assets.
Capital assets pricing model is helpful for the organization to measure the risk
related to the pricing of the product.
Merits & Demerits of DDM Model
Merits Demerits
It helps to calculate the price
of shares in an efficient manner. It
shows to differentiate the price of
stocks and shares of different
companies and helps finalize the
suitable price for a particular stock. It
gives a profitable deal to lock the price
for a share to be brought in market by
the firm. It gives huge revenues to the
company if executed with proper
analysis and calculations. It is a better
model to evaluate the cost of equity
than other models since it considers
the systematic risk.
It does not show accountability
of loyalty of the product, dealership of
intangible assets, etc. The prospects of
the dividend valuation technique could
not be evaluated in terms of revenues
and on long term basis. It gives benefit
to those companies which are already
stable in the financial terms.
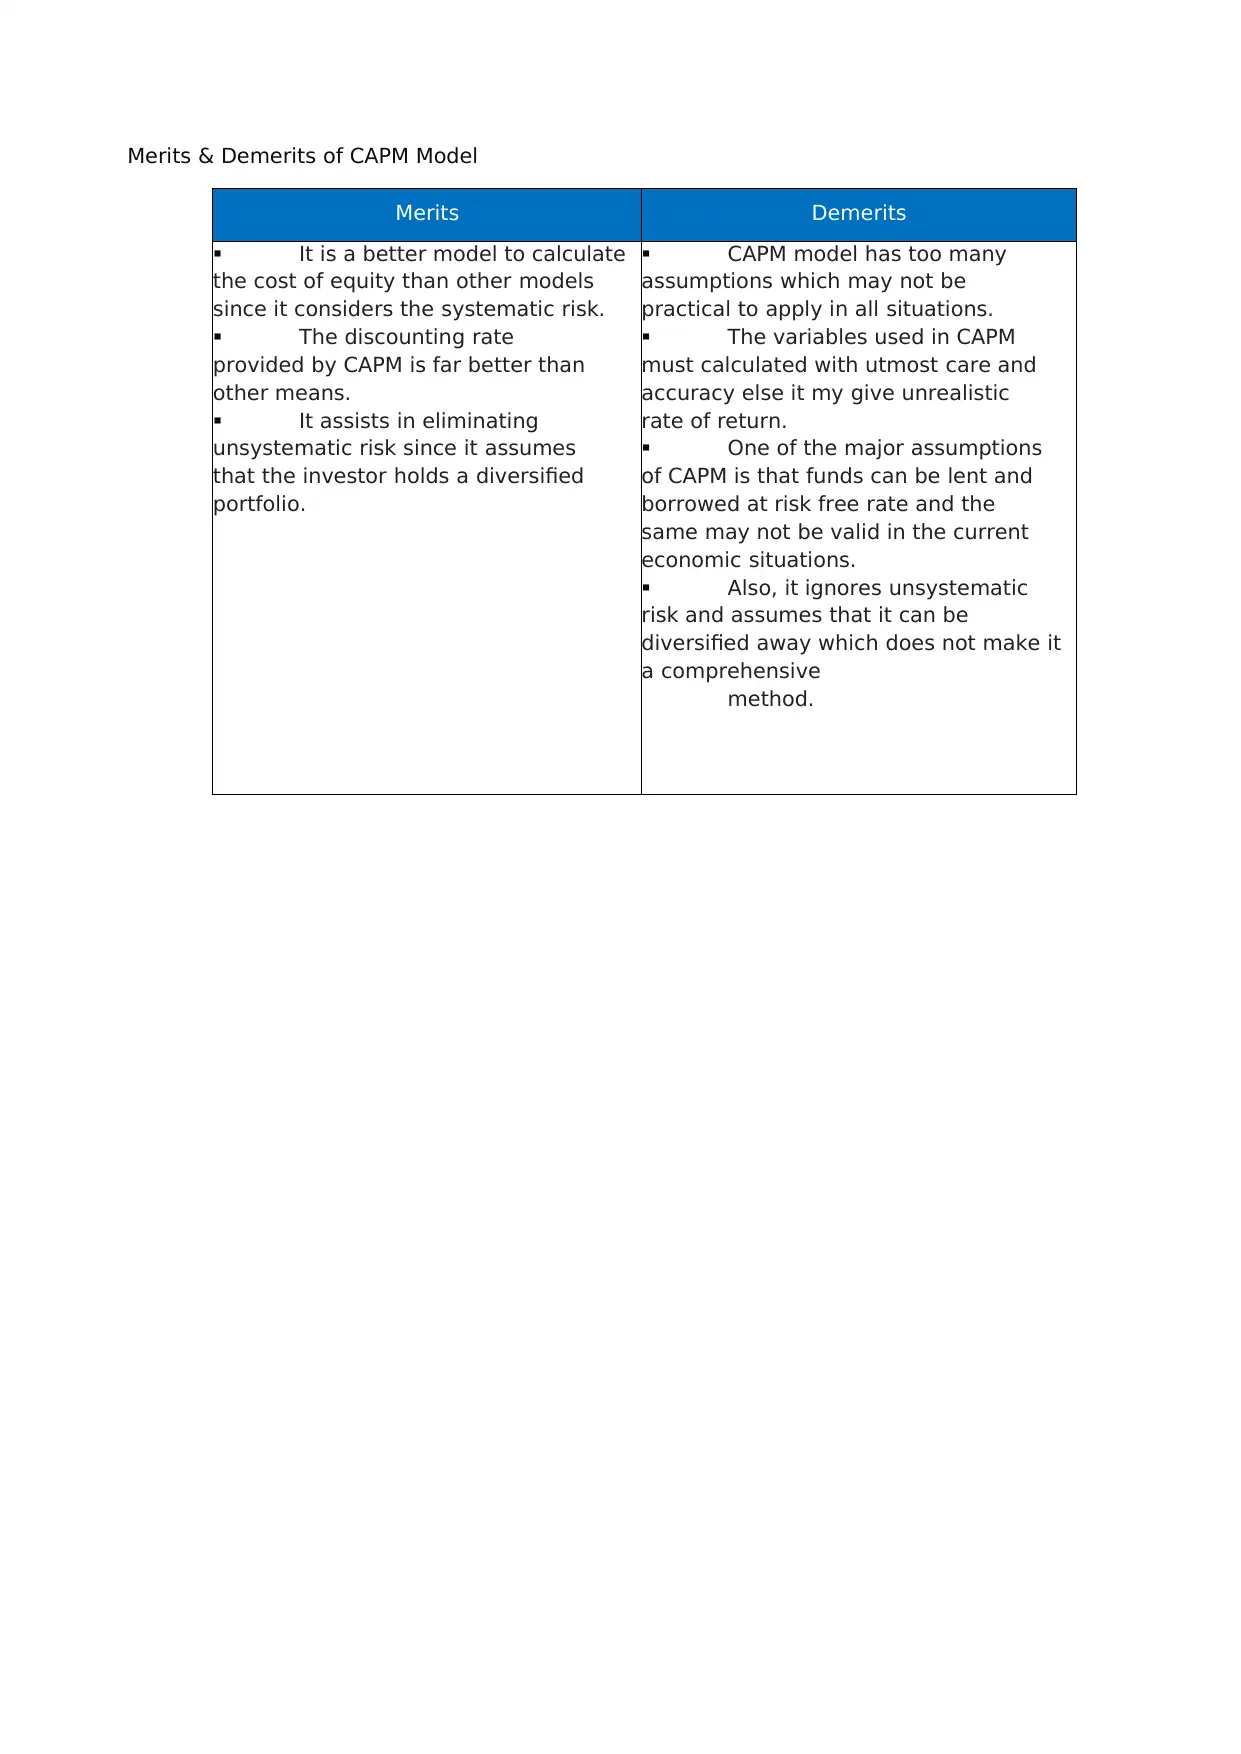
Merits & Demerits of CAPM Model
Merits Demerits
It is a better model to calculate
the cost of equity than other models
since it considers the systematic risk.
The discounting rate
provided by CAPM is far better than
other means.
It assists in eliminating
unsystematic risk since it assumes
that the investor holds a diversified
portfolio.
CAPM model has too many
assumptions which may not be
practical to apply in all situations.
The variables used in CAPM
must calculated with utmost care and
accuracy else it my give unrealistic
rate of return.
One of the major assumptions
of CAPM is that funds can be lent and
borrowed at risk free rate and the
same may not be valid in the current
economic situations.
Also, it ignores unsystematic
risk and assumes that it can be
diversified away which does not make it
a comprehensive
method.
⊘ This is a preview!⊘
Do you want full access?
Subscribe today to unlock all pages.
Trusted by 1+ million students worldwide
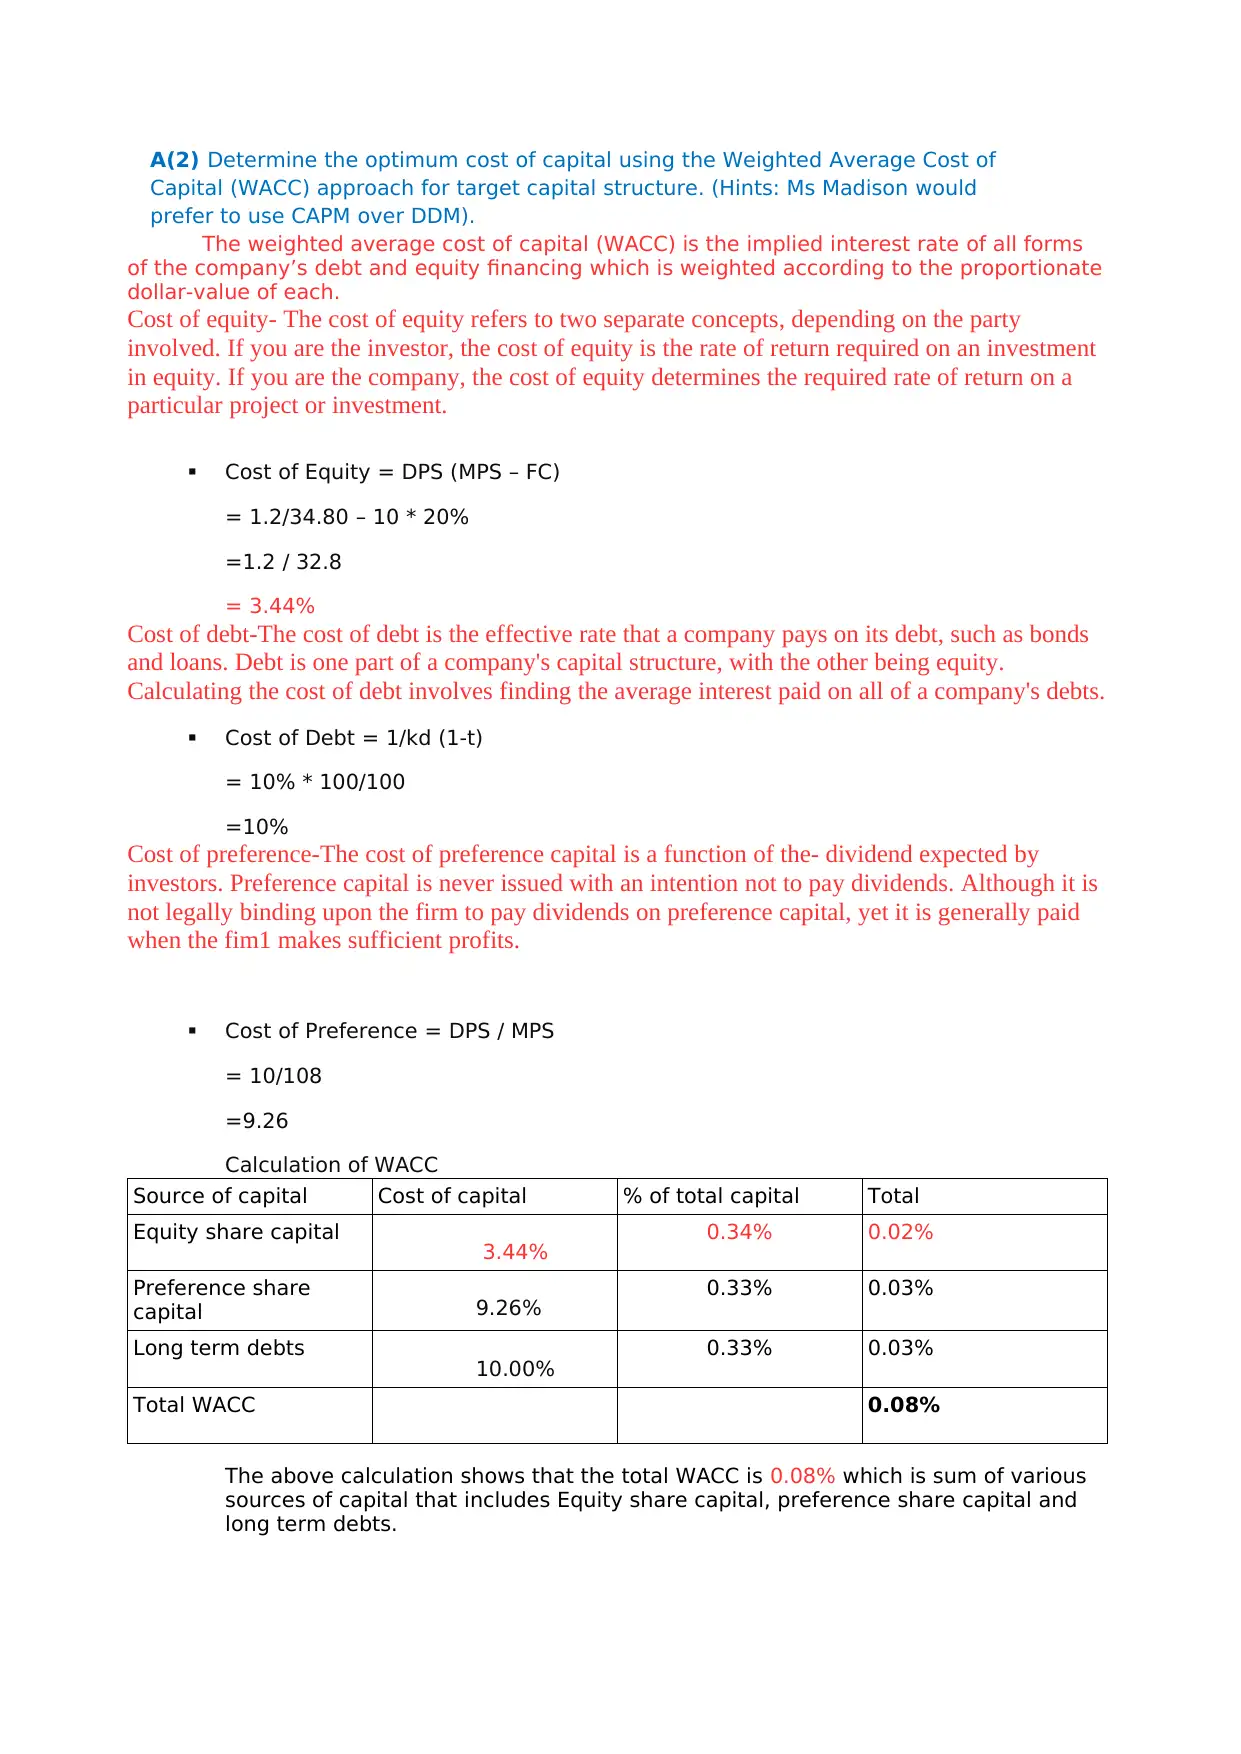
A(2) Determine the optimum cost of capital using the Weighted Average Cost of
Capital (WACC) approach for target capital structure. (Hints: Ms Madison would
prefer to use CAPM over DDM).
The weighted average cost of capital (WACC) is the implied interest rate of all forms
of the company’s debt and equity financing which is weighted according to the proportionate
dollar-value of each.
Cost of equity- The cost of equity refers to two separate concepts, depending on the party
involved. If you are the investor, the cost of equity is the rate of return required on an investment
in equity. If you are the company, the cost of equity determines the required rate of return on a
particular project or investment.
Cost of Equity = DPS (MPS – FC)
= 1.2/34.80 – 10 * 20%
=1.2 / 32.8
= 3.44%
Cost of debt-The cost of debt is the effective rate that a company pays on its debt, such as bonds
and loans. Debt is one part of a company's capital structure, with the other being equity.
Calculating the cost of debt involves finding the average interest paid on all of a company's debts.
Cost of Debt = 1/kd (1-t)
= 10% * 100/100
=10%
Cost of preference-The cost of preference capital is a function of the- dividend expected by
investors. Preference capital is never issued with an intention not to pay dividends. Although it is
not legally binding upon the firm to pay dividends on preference capital, yet it is generally paid
when the fim1 makes sufficient profits.
Cost of Preference = DPS / MPS
= 10/108
=9.26
Calculation of WACC
Source of capital Cost of capital % of total capital Total
Equity share capital 3.44% 0.34% 0.02%
Preference share
capital 9.26% 0.33% 0.03%
Long term debts 10.00% 0.33% 0.03%
Total WACC 0.08%
The above calculation shows that the total WACC is 0.08% which is sum of various
sources of capital that includes Equity share capital, preference share capital and
long term debts.
Paraphrase This Document
Need a fresh take? Get an instant paraphrase of this document with our AI Paraphraser
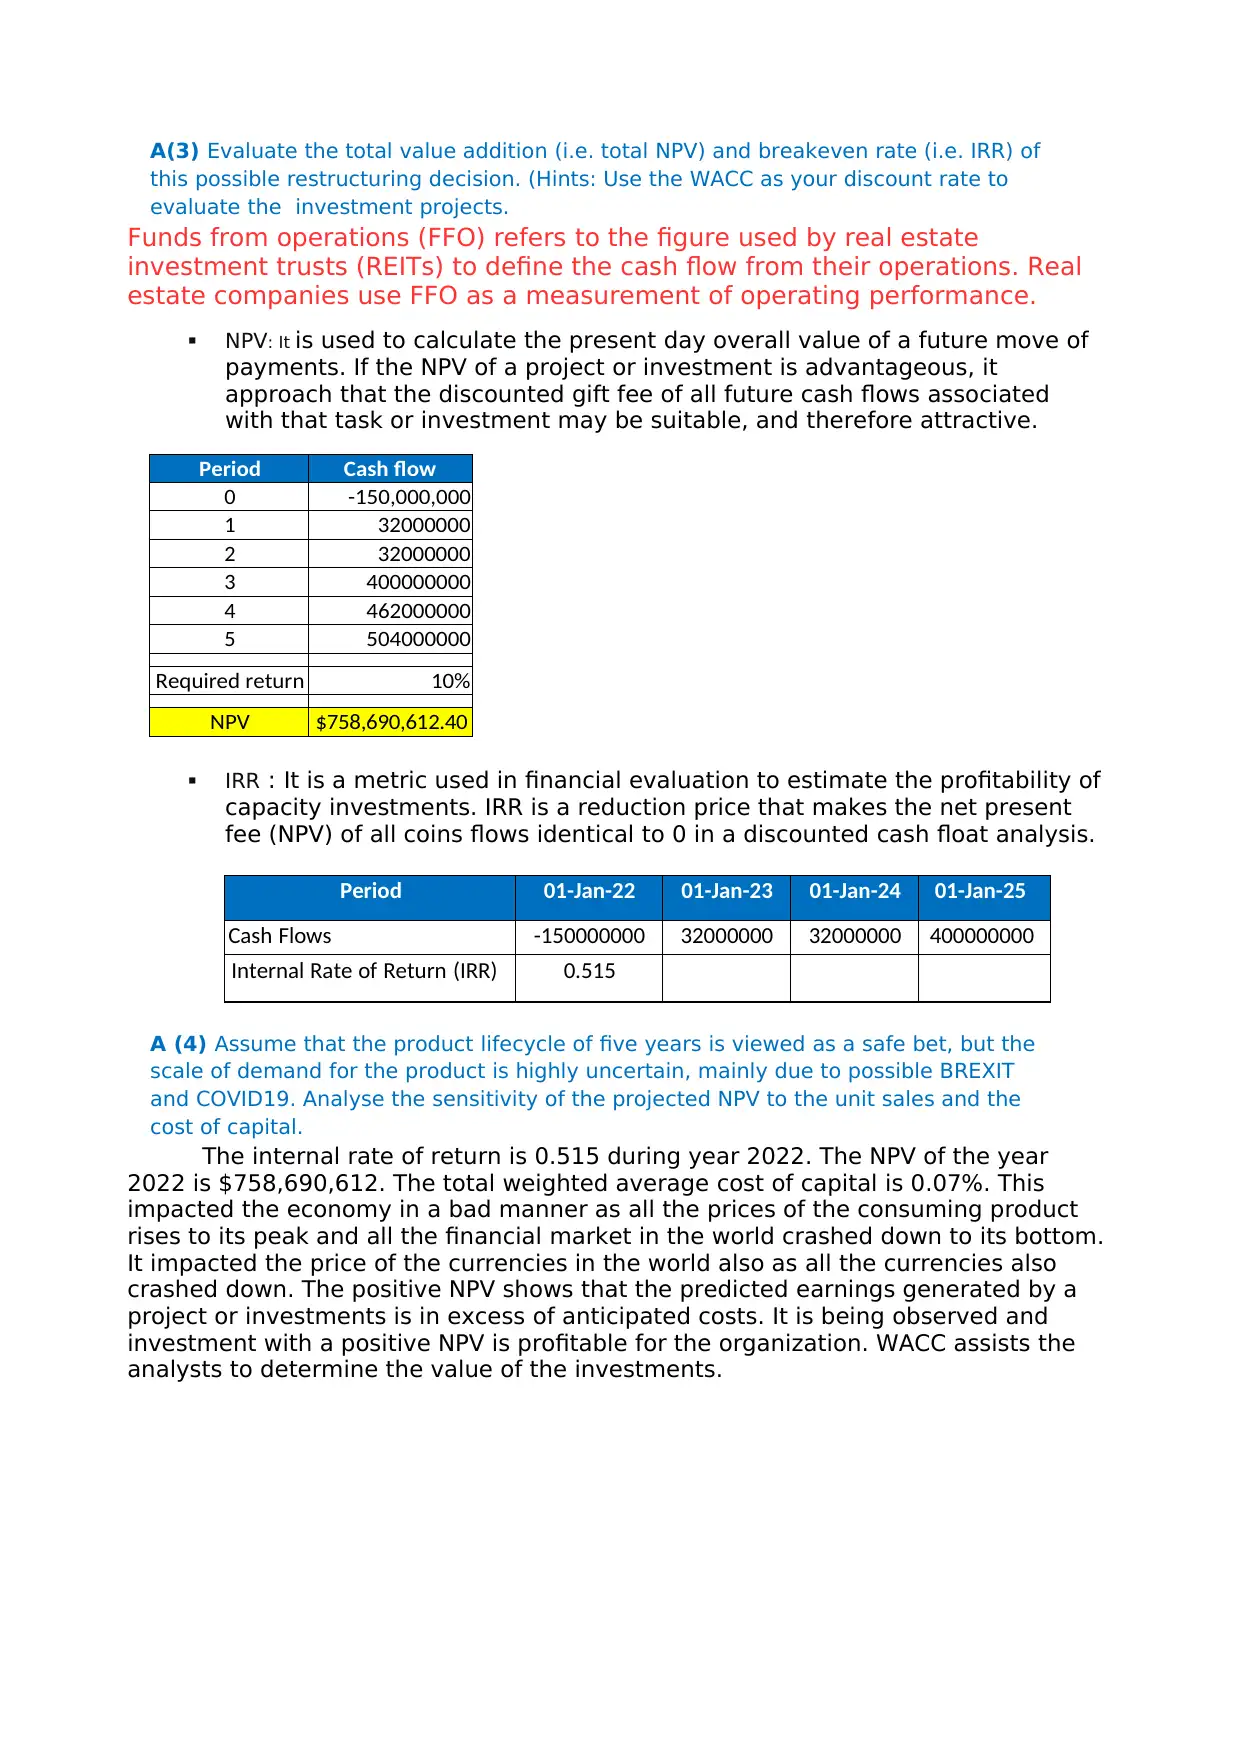
A(3) Evaluate the total value addition (i.e. total NPV) and breakeven rate (i.e. IRR) of
this possible restructuring decision. (Hints: Use the WACC as your discount rate to
evaluate the investment projects.
Funds from operations (FFO) refers to the figure used by real estate
investment trusts (REITs) to define the cash flow from their operations. Real
estate companies use FFO as a measurement of operating performance.
NPV: It is used to calculate the present day overall value of a future move of
payments. If the NPV of a project or investment is advantageous, it
approach that the discounted gift fee of all future cash flows associated
with that task or investment may be suitable, and therefore attractive.
Period Cash flow
0 -150,000,000
1 32000000
2 32000000
3 400000000
4 462000000
5 504000000
Required return 10%
NPV $758,690,612.40
IRR : It is a metric used in financial evaluation to estimate the profitability of
capacity investments. IRR is a reduction price that makes the net present
fee (NPV) of all coins flows identical to 0 in a discounted cash float analysis.
Period 01-Jan-22 01-Jan-23 01-Jan-24 01-Jan-25
Cash Flows -150000000 32000000 32000000 400000000
Internal Rate of Return (IRR) 0.515
A (4) Assume that the product lifecycle of five years is viewed as a safe bet, but the
scale of demand for the product is highly uncertain, mainly due to possible BREXIT
and COVID19. Analyse the sensitivity of the projected NPV to the unit sales and the
cost of capital.
The internal rate of return is 0.515 during year 2022. The NPV of the year
2022 is $758,690,612. The total weighted average cost of capital is 0.07%. This
impacted the economy in a bad manner as all the prices of the consuming product
rises to its peak and all the financial market in the world crashed down to its bottom.
It impacted the price of the currencies in the world also as all the currencies also
crashed down. The positive NPV shows that the predicted earnings generated by a
project or investments is in excess of anticipated costs. It is being observed and
investment with a positive NPV is profitable for the organization. WACC assists the
analysts to determine the value of the investments.
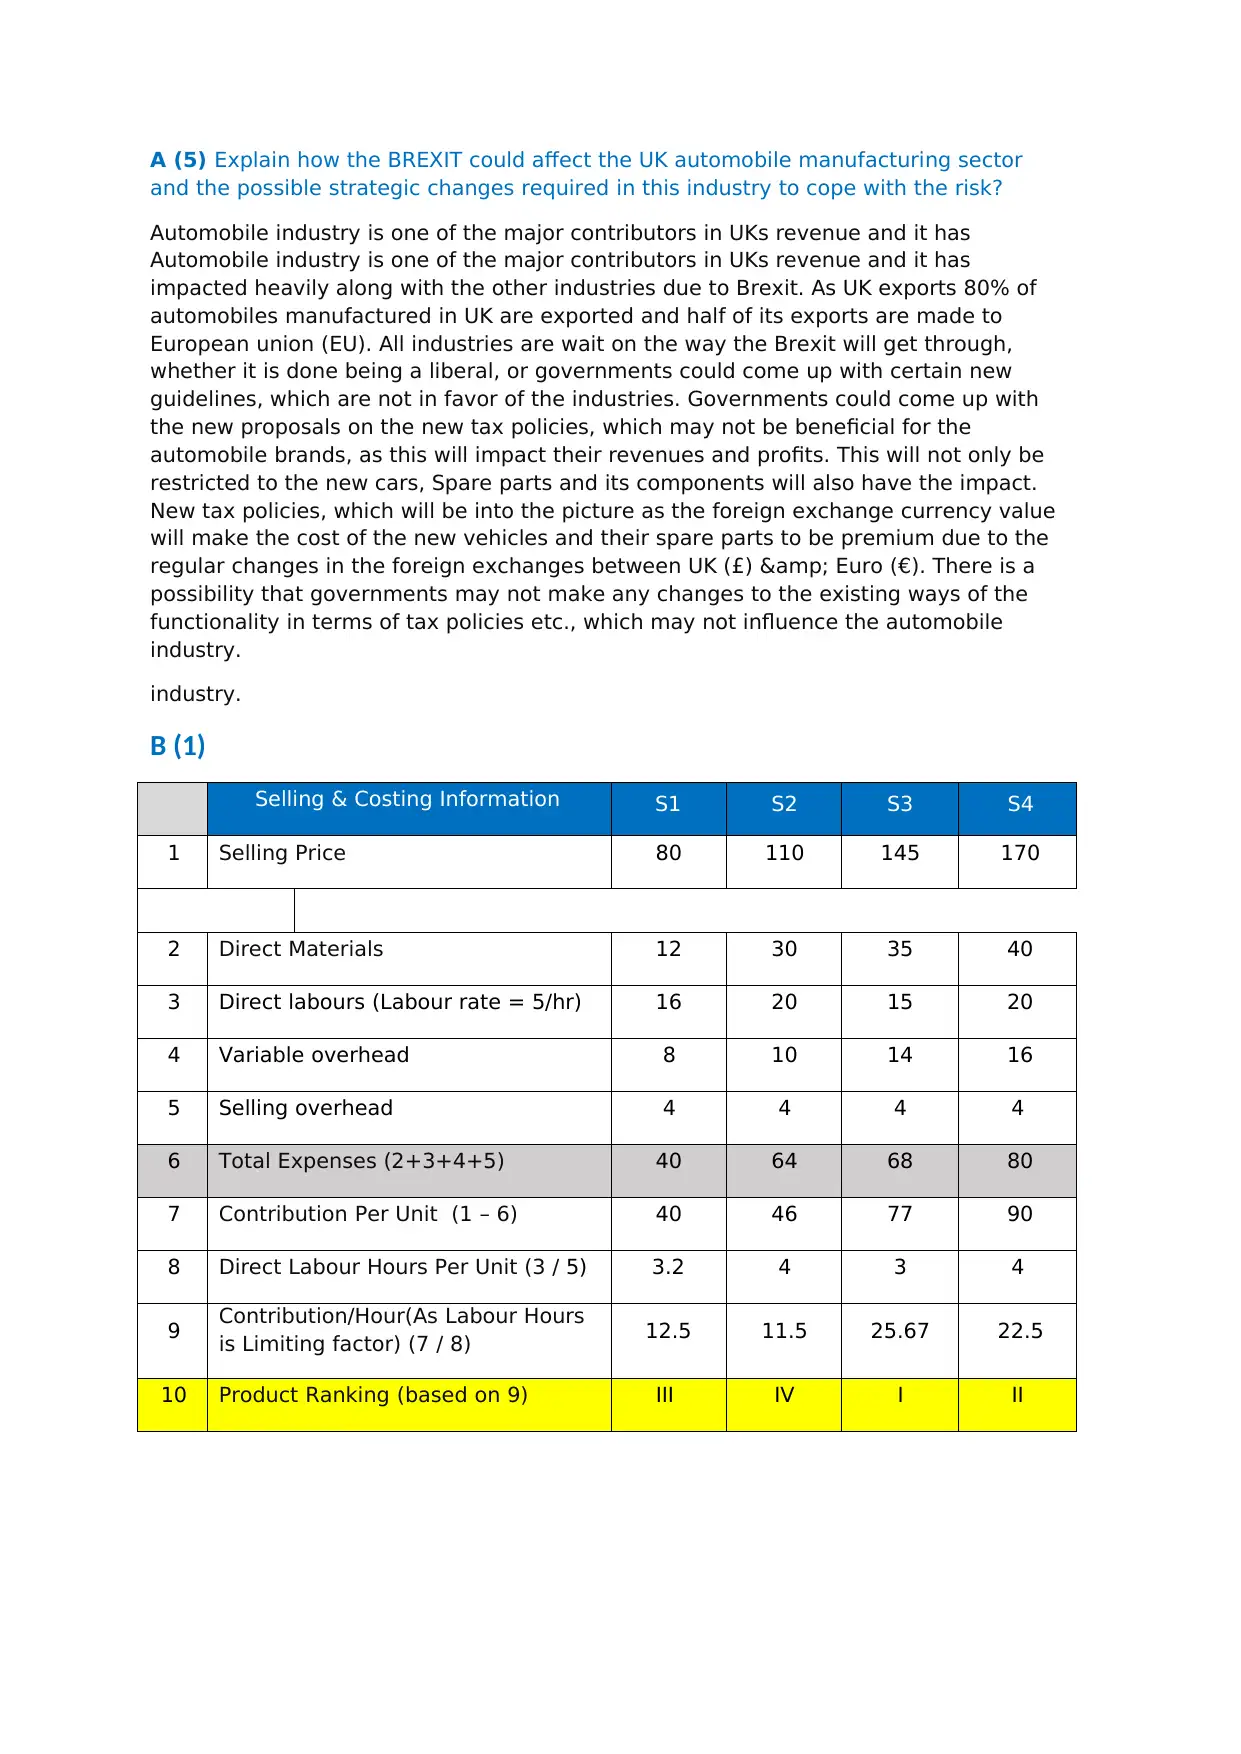
A (5) Explain how the BREXIT could affect the UK automobile manufacturing sector
and the possible strategic changes required in this industry to cope with the risk?
Automobile industry is one of the major contributors in UKs revenue and it has
Automobile industry is one of the major contributors in UKs revenue and it has
impacted heavily along with the other industries due to Brexit. As UK exports 80% of
automobiles manufactured in UK are exported and half of its exports are made to
European union (EU). All industries are wait on the way the Brexit will get through,
whether it is done being a liberal, or governments could come up with certain new
guidelines, which are not in favor of the industries. Governments could come up with
the new proposals on the new tax policies, which may not be beneficial for the
automobile brands, as this will impact their revenues and profits. This will not only be
restricted to the new cars, Spare parts and its components will also have the impact.
New tax policies, which will be into the picture as the foreign exchange currency value
will make the cost of the new vehicles and their spare parts to be premium due to the
regular changes in the foreign exchanges between UK (£) & Euro (€). There is a
possibility that governments may not make any changes to the existing ways of the
functionality in terms of tax policies etc., which may not influence the automobile
industry.
industry.
B (1)
Selling & Costing Information S1 S2 S3 S4
1 Selling Price 80 110 145 170
2 Direct Materials 12 30 35 40
3 Direct labours (Labour rate = 5/hr) 16 20 15 20
4 Variable overhead 8 10 14 16
5 Selling overhead 4 4 4 4
6 Total Expenses (2+3+4+5) 40 64 68 80
7 Contribution Per Unit (1 – 6) 40 46 77 90
8 Direct Labour Hours Per Unit (3 / 5) 3.2 4 3 4
9 Contribution/Hour(As Labour Hours
is Limiting factor) (7 / 8) 12.5 11.5 25.67 22.5
10 Product Ranking (based on 9) III IV I II
⊘ This is a preview!⊘
Do you want full access?
Subscribe today to unlock all pages.
Trusted by 1+ million students worldwide
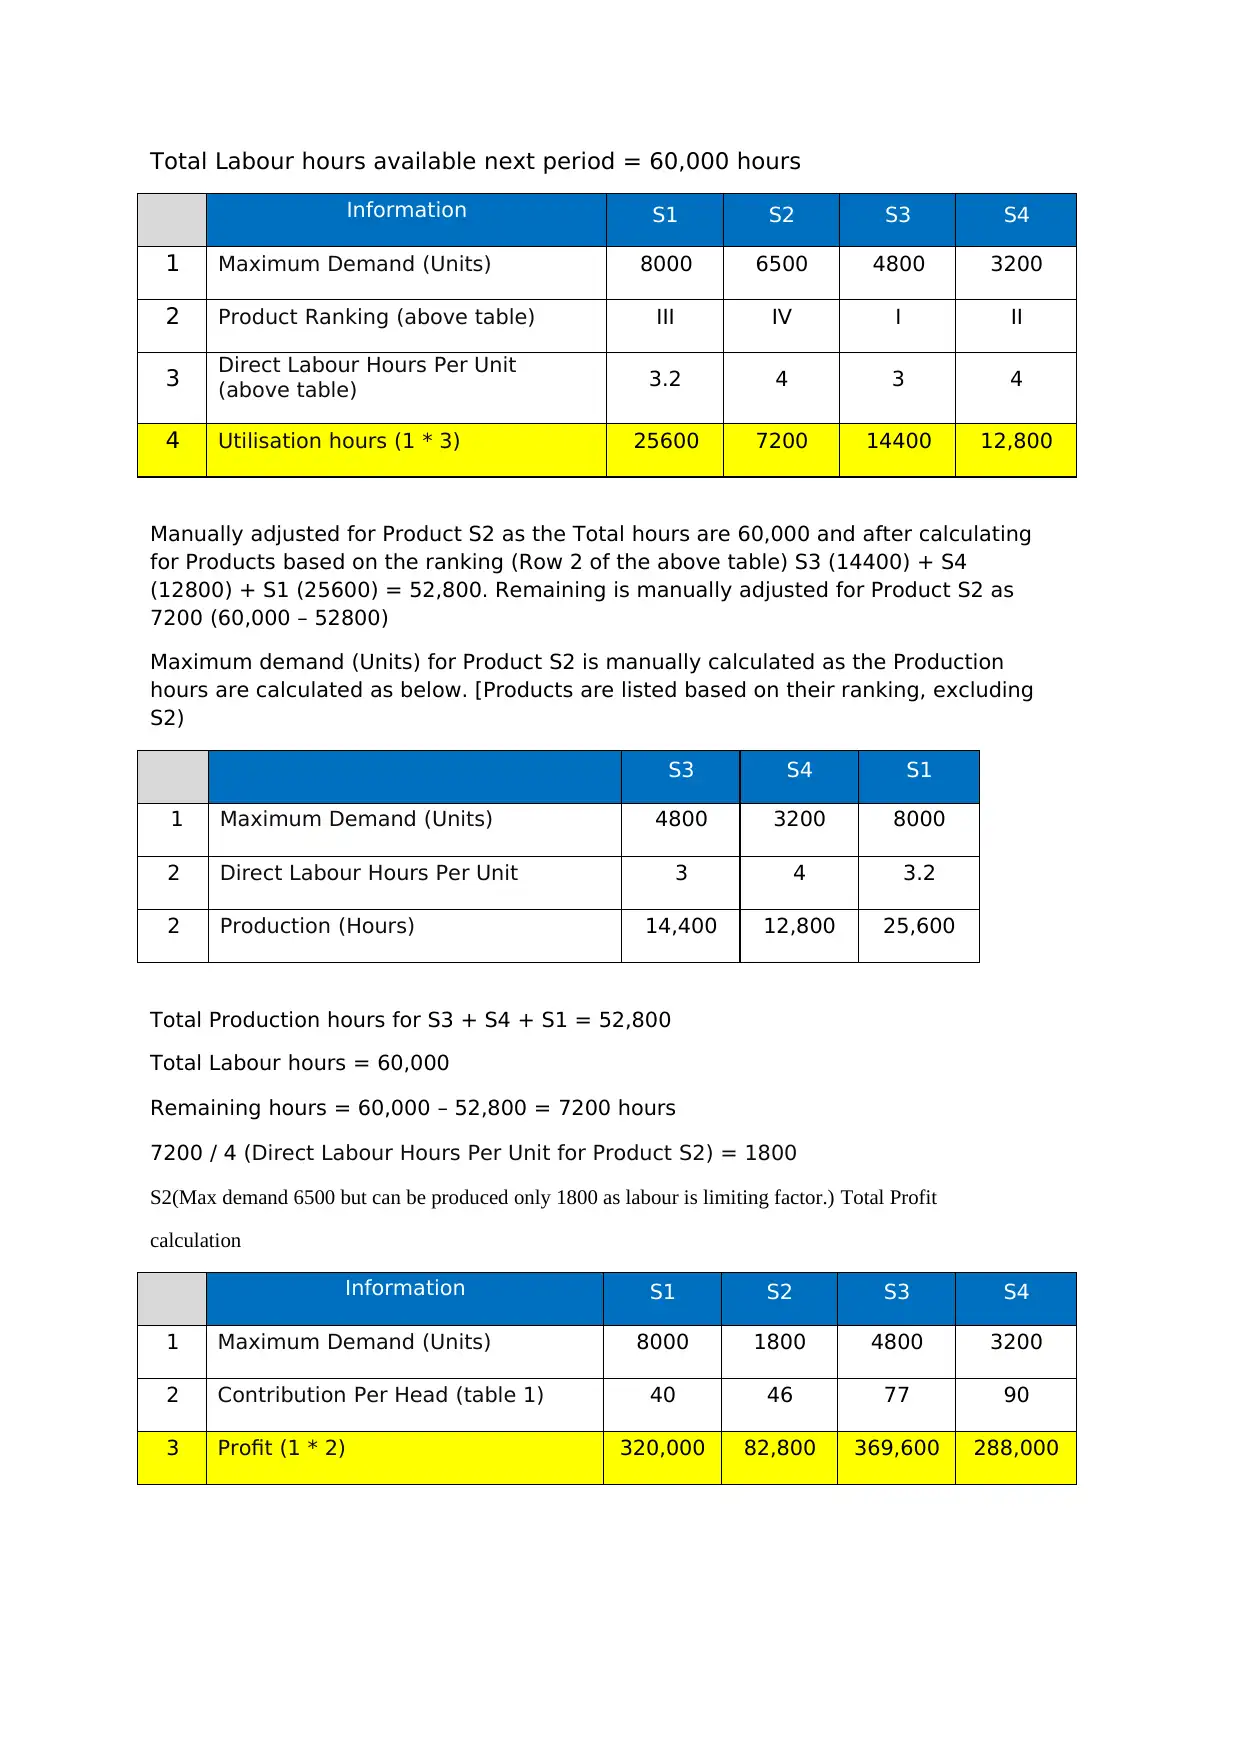
Total Labour hours available next period = 60,000 hours
Information S1 S2 S3 S4
1 Maximum Demand (Units) 8000 6500 4800 3200
2 Product Ranking (above table) III IV I II
3 Direct Labour Hours Per Unit
(above table) 3.2 4 3 4
4 Utilisation hours (1 * 3) 25600 7200 14400 12,800
Manually adjusted for Product S2 as the Total hours are 60,000 and after calculating
for Products based on the ranking (Row 2 of the above table) S3 (14400) + S4
(12800) + S1 (25600) = 52,800. Remaining is manually adjusted for Product S2 as
7200 (60,000 – 52800)
Maximum demand (Units) for Product S2 is manually calculated as the Production
hours are calculated as below. [Products are listed based on their ranking, excluding
S2)
S3 S4 S1
1 Maximum Demand (Units) 4800 3200 8000
2 Direct Labour Hours Per Unit 3 4 3.2
2 Production (Hours) 14,400 12,800 25,600
Total Production hours for S3 + S4 + S1 = 52,800
Total Labour hours = 60,000
Remaining hours = 60,000 – 52,800 = 7200 hours
7200 / 4 (Direct Labour Hours Per Unit for Product S2) = 1800
S2(Max demand 6500 but can be produced only 1800 as labour is limiting factor.) Total Profit
calculation
Information S1 S2 S3 S4
1 Maximum Demand (Units) 8000 1800 4800 3200
2 Contribution Per Head (table 1) 40 46 77 90
3 Profit (1 * 2) 320,000 82,800 369,600 288,000
Information S1 S2 S3 S4
1 Maximum Demand (Units) 8000 6500 4800 3200
2 Product Ranking (above table) III IV I II
3 Direct Labour Hours Per Unit
(above table) 3.2 4 3 4
4 Utilisation hours (1 * 3) 25600 7200 14400 12,800
Manually adjusted for Product S2 as the Total hours are 60,000 and after calculating
for Products based on the ranking (Row 2 of the above table) S3 (14400) + S4
(12800) + S1 (25600) = 52,800. Remaining is manually adjusted for Product S2 as
7200 (60,000 – 52800)
Maximum demand (Units) for Product S2 is manually calculated as the Production
hours are calculated as below. [Products are listed based on their ranking, excluding
S2)
S3 S4 S1
1 Maximum Demand (Units) 4800 3200 8000
2 Direct Labour Hours Per Unit 3 4 3.2
2 Production (Hours) 14,400 12,800 25,600
Total Production hours for S3 + S4 + S1 = 52,800
Total Labour hours = 60,000
Remaining hours = 60,000 – 52,800 = 7200 hours
7200 / 4 (Direct Labour Hours Per Unit for Product S2) = 1800
S2(Max demand 6500 but can be produced only 1800 as labour is limiting factor.) Total Profit
calculation
Information S1 S2 S3 S4
1 Maximum Demand (Units) 8000 1800 4800 3200
2 Contribution Per Head (table 1) 40 46 77 90
3 Profit (1 * 2) 320,000 82,800 369,600 288,000
Paraphrase This Document
Need a fresh take? Get an instant paraphrase of this document with our AI Paraphraser
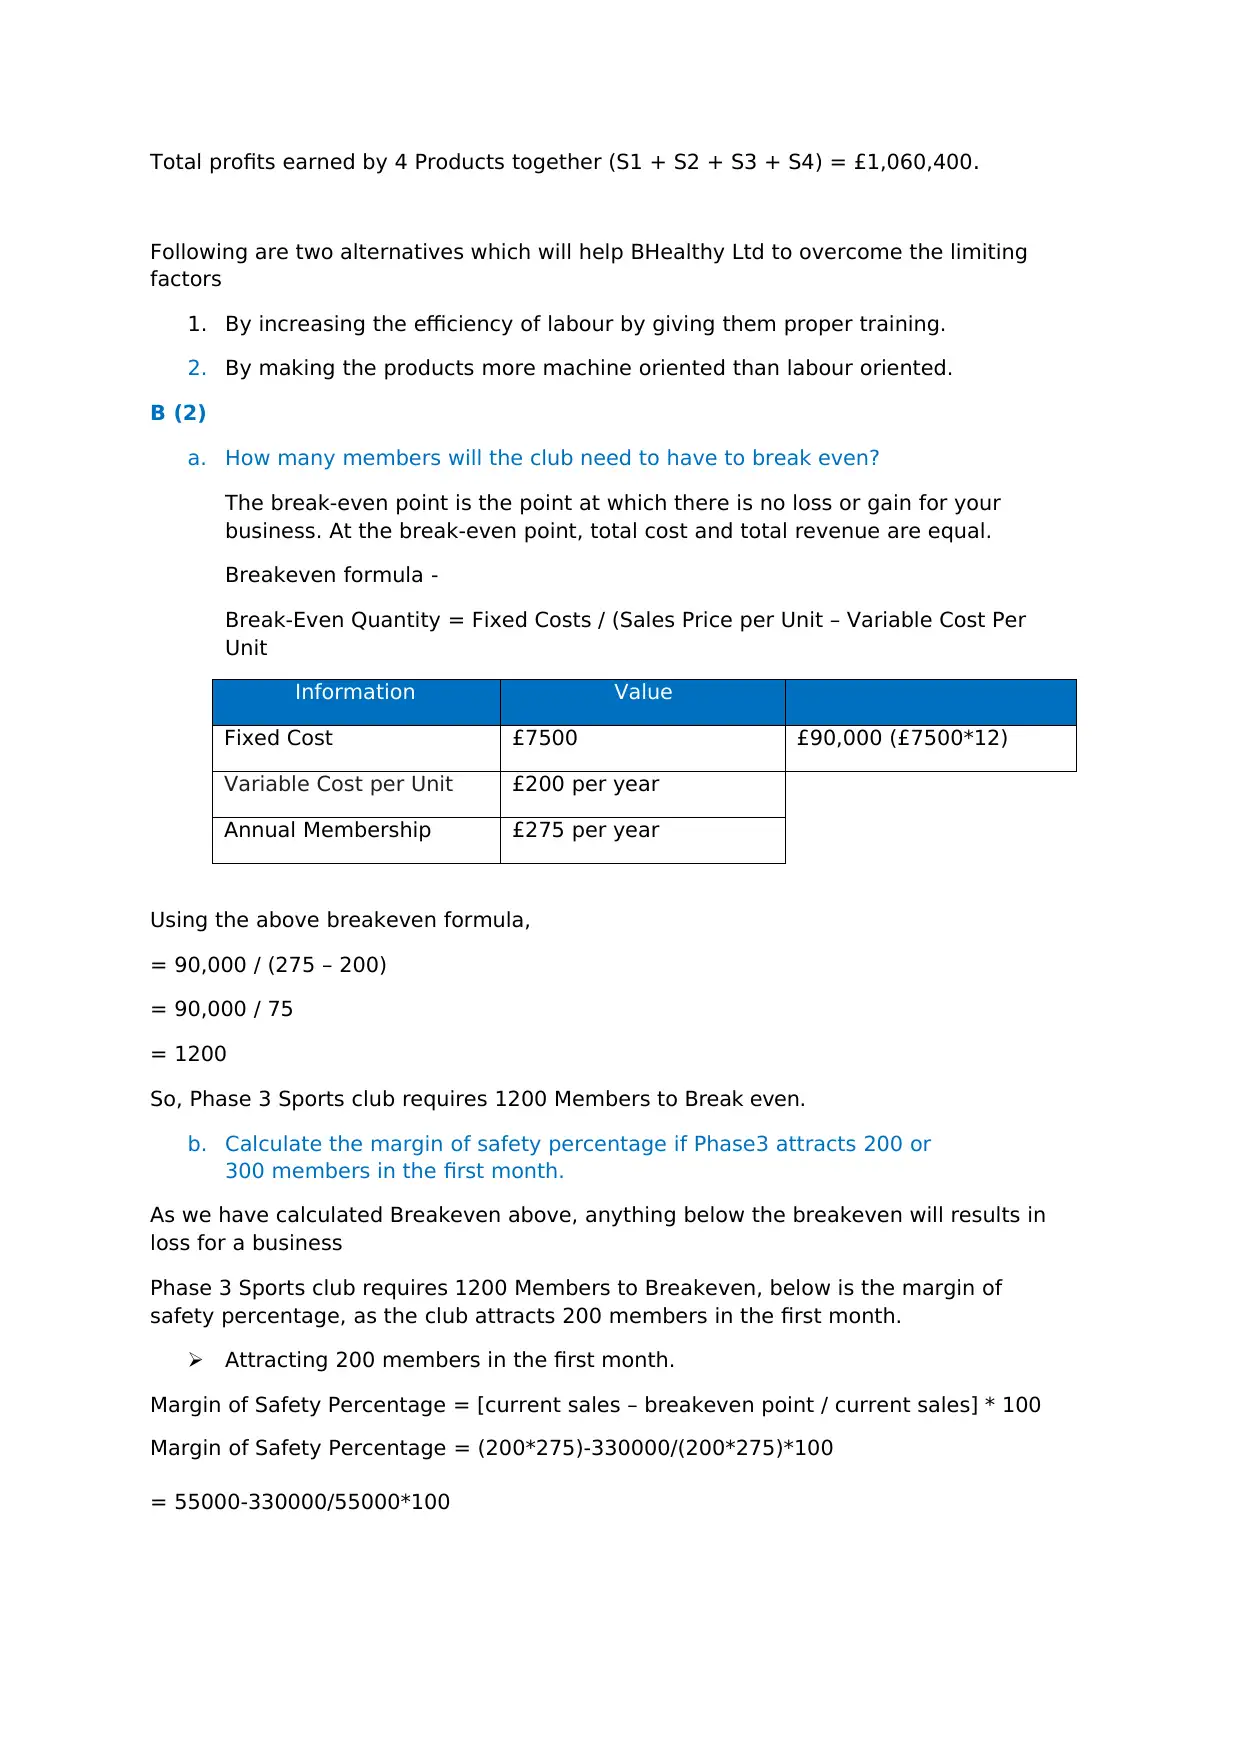
Total profits earned by 4 Products together (S1 + S2 + S3 + S4) = £1,060,400.
Following are two alternatives which will help BHealthy Ltd to overcome the limiting
factors
1. By increasing the efficiency of labour by giving them proper training.
2. By making the products more machine oriented than labour oriented.
B (2)
a. How many members will the club need to have to break even?
The break-even point is the point at which there is no loss or gain for your
business. At the break-even point, total cost and total revenue are equal.
Breakeven formula -
Break-Even Quantity = Fixed Costs / (Sales Price per Unit – Variable Cost Per
Unit
Information Value
Fixed Cost £7500 £90,000 (£7500*12)
Variable Cost per Unit £200 per year
Annual Membership £275 per year
Using the above breakeven formula,
= 90,000 / (275 – 200)
= 90,000 / 75
= 1200
So, Phase 3 Sports club requires 1200 Members to Break even.
b. Calculate the margin of safety percentage if Phase3 attracts 200 or
300 members in the first month.
As we have calculated Breakeven above, anything below the breakeven will results in
loss for a business
Phase 3 Sports club requires 1200 Members to Breakeven, below is the margin of
safety percentage, as the club attracts 200 members in the first month.
Attracting 200 members in the first month.
Margin of Safety Percentage = [current sales – breakeven point / current sales] * 100
Margin of Safety Percentage = (200*275)-330000/(200*275)*100
= 55000-330000/55000*100
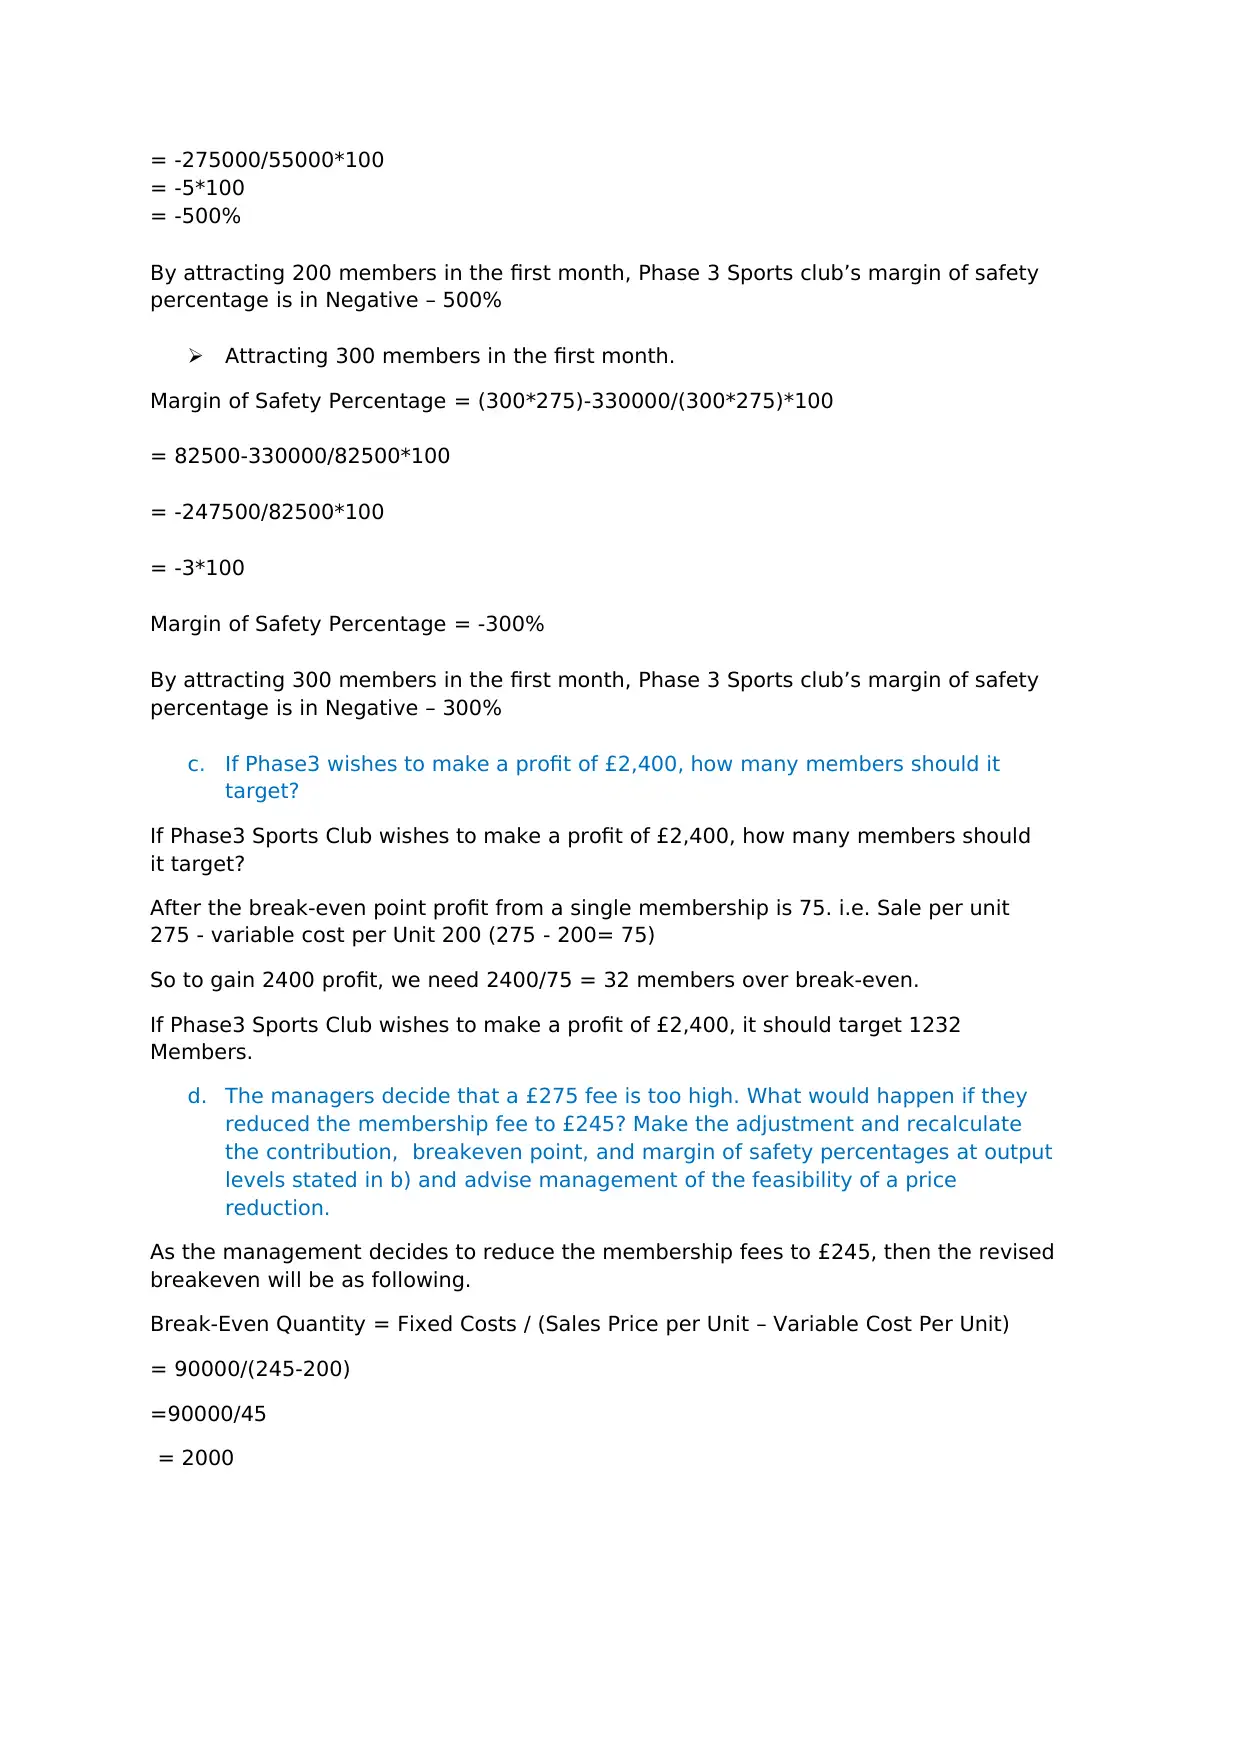
= -275000/55000*100
= -5*100
= -500%
By attracting 200 members in the first month, Phase 3 Sports club’s margin of safety
percentage is in Negative – 500%
Attracting 300 members in the first month.
Margin of Safety Percentage = (300*275)-330000/(300*275)*100
= 82500-330000/82500*100
= -247500/82500*100
= -3*100
Margin of Safety Percentage = -300%
By attracting 300 members in the first month, Phase 3 Sports club’s margin of safety
percentage is in Negative – 300%
c. If Phase3 wishes to make a profit of £2,400, how many members should it
target?
If Phase3 Sports Club wishes to make a profit of £2,400, how many members should
it target?
After the break-even point profit from a single membership is 75. i.e. Sale per unit
275 - variable cost per Unit 200 (275 - 200= 75)
So to gain 2400 profit, we need 2400/75 = 32 members over break-even.
If Phase3 Sports Club wishes to make a profit of £2,400, it should target 1232
Members.
d. The managers decide that a £275 fee is too high. What would happen if they
reduced the membership fee to £245? Make the adjustment and recalculate
the contribution, breakeven point, and margin of safety percentages at output
levels stated in b) and advise management of the feasibility of a price
reduction.
As the management decides to reduce the membership fees to £245, then the revised
breakeven will be as following.
Break-Even Quantity = Fixed Costs / (Sales Price per Unit – Variable Cost Per Unit)
= 90000/(245-200)
=90000/45
= 2000
⊘ This is a preview!⊘
Do you want full access?
Subscribe today to unlock all pages.
Trusted by 1+ million students worldwide
1 out of 16
Related Documents


Your All-in-One AI-Powered Toolkit for Academic Success.
+13062052269
info@desklib.com
Available 24*7 on WhatsApp / Email
![[object Object]](/_next/static/media/star-bottom.7253800d.svg)
Unlock your academic potential
Copyright © 2020–2026 A2Z Services. All Rights Reserved. Developed and managed by ZUCOL.