Quantitative Techniques Assignment Solution for MBA Program
VerifiedAdded on 2020/10/23
|6
|1211
|265
Homework Assignment
AI Summary
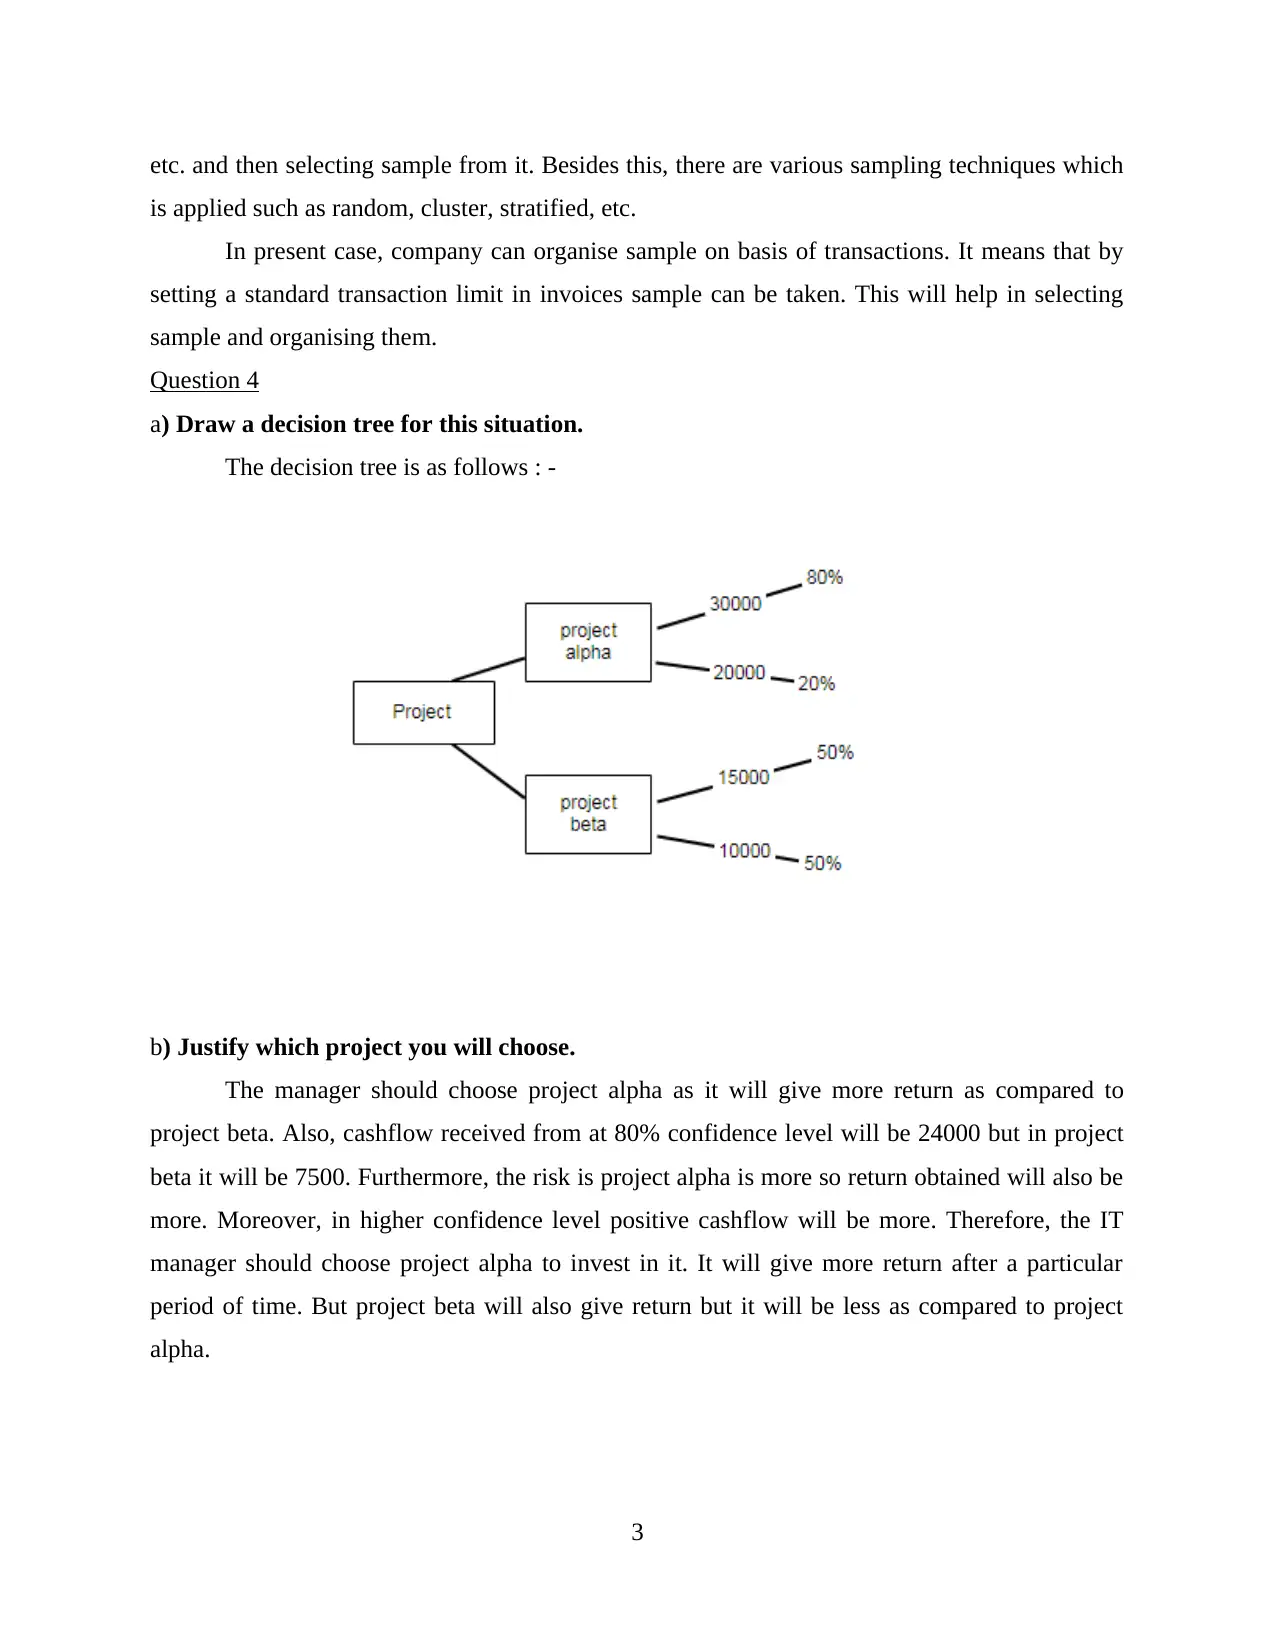
This MBA assignment solution addresses key concepts in quantitative techniques. It begins by explaining primary data collection methods, specifically questionnaires and interviews, and discusses their limitations. The solution then explores the application of quantitative techniques in various work settings, industries, and communities, highlighting the use of SPSS for data analysis, including descriptive and inferential techniques, and visual representations like bar charts and pie charts. The differences between population and sample are explained, along with sampling organization methods. Finally, a decision tree is drawn and used to justify a project selection based on potential returns and cash flow, demonstrating the practical application of quantitative analysis in decision-making.

1 out of 6
Related Documents


Your All-in-One AI-Powered Toolkit for Academic Success.
+13062052269
info@desklib.com
Available 24*7 on WhatsApp / Email
![[object Object]](/_next/static/media/star-bottom.7253800d.svg)
Copyright © 2020–2026 A2Z Services. All Rights Reserved. Developed and managed by ZUCOL.