Comprehensive Financial Analysis Report: Bluescope Steel Ltd. (MBA901)
VerifiedAdded on 2022/11/28
|15
|1807
|193
Report
AI Summary
This report presents a financial analysis of Bluescope Steel Ltd., examining its performance over a five-year period. The analysis includes a valuation of financial ratios, such as liquidity and profitability ratios, to assess the company's ability to manage working capital and generate earnings. Trend analysis, including horizontal and vertical analysis of the income statement and balance sheet, is conducted to identify changes in revenue, expenses, and other financial statement items over time. The report highlights the company's financial health, noting both positive and negative trends, and concludes with an overview of the company's performance in the external business environment. The analysis references the company's annual reports and other financial data sources to provide a comprehensive understanding of Bluescope Steel Ltd.'s financial position and performance.
Running Head: Accounting for Decision-Making
Accounting for Decision-Making
[Type the document subtitle]
Laptop04011
[Pick the date]
Accounting for Decision-Making
[Type the document subtitle]
Laptop04011
[Pick the date]
Paraphrase This Document
Need a fresh take? Get an instant paraphrase of this document with our AI Paraphraser
Accounting for Decision-Making 1
Contents
Introduction......................................................................................................................................2
Valuation of Financial Ratios..........................................................................................................2
Valuation of Trend Analysis............................................................................................................4
Horizontal Analysis.....................................................................................................................4
Vertical Analysis.........................................................................................................................5
Conclusion.......................................................................................................................................6
References........................................................................................................................................7
Appendices......................................................................................................................................9
Accounting for Decision-Making 2
Introduction
The aim of this assessment is to enlighten the reader concerning the details about the company
Bluescope Steel Ltd. BlueScope Steel Ltd. is an organization that produces and sell metal coated
and painted steel building products in the market of Asia, Australia, New Zealand, North
America and internationally in other areas as well. The company operates its scope of business in
five different segments that are Australian Steel products, Building Products Asia and North
America, North Star BlueScope Steel, Buildings North America and New Zealand and Pacific
Steel Products. The company offers varied products like hot and cold rolled coils, steel slabs,
roof and wall claddings etc. The BlueScope Company was initially known as BHP Steel Limited
which further changed its name to BlueScope Steel Ltd. Company in the year 2003. Further, the
below mentioned report highlights details about the financial analysis of the company in the
external environment (Yahoo Finance 2019). Various ratios and trend analysis have been
implemented to attain knowledge of the activities of the company over 5 years. More details
about the paper are discussed below:
Valuation of Financial Ratios
2014
2015
2016
2017
2018
0.00 0.20 0.40 0.60 0.80 1.00 1.20 1.40 1.60 1.80
Liquidity Ratios
Quick Ratio
Current Ratio
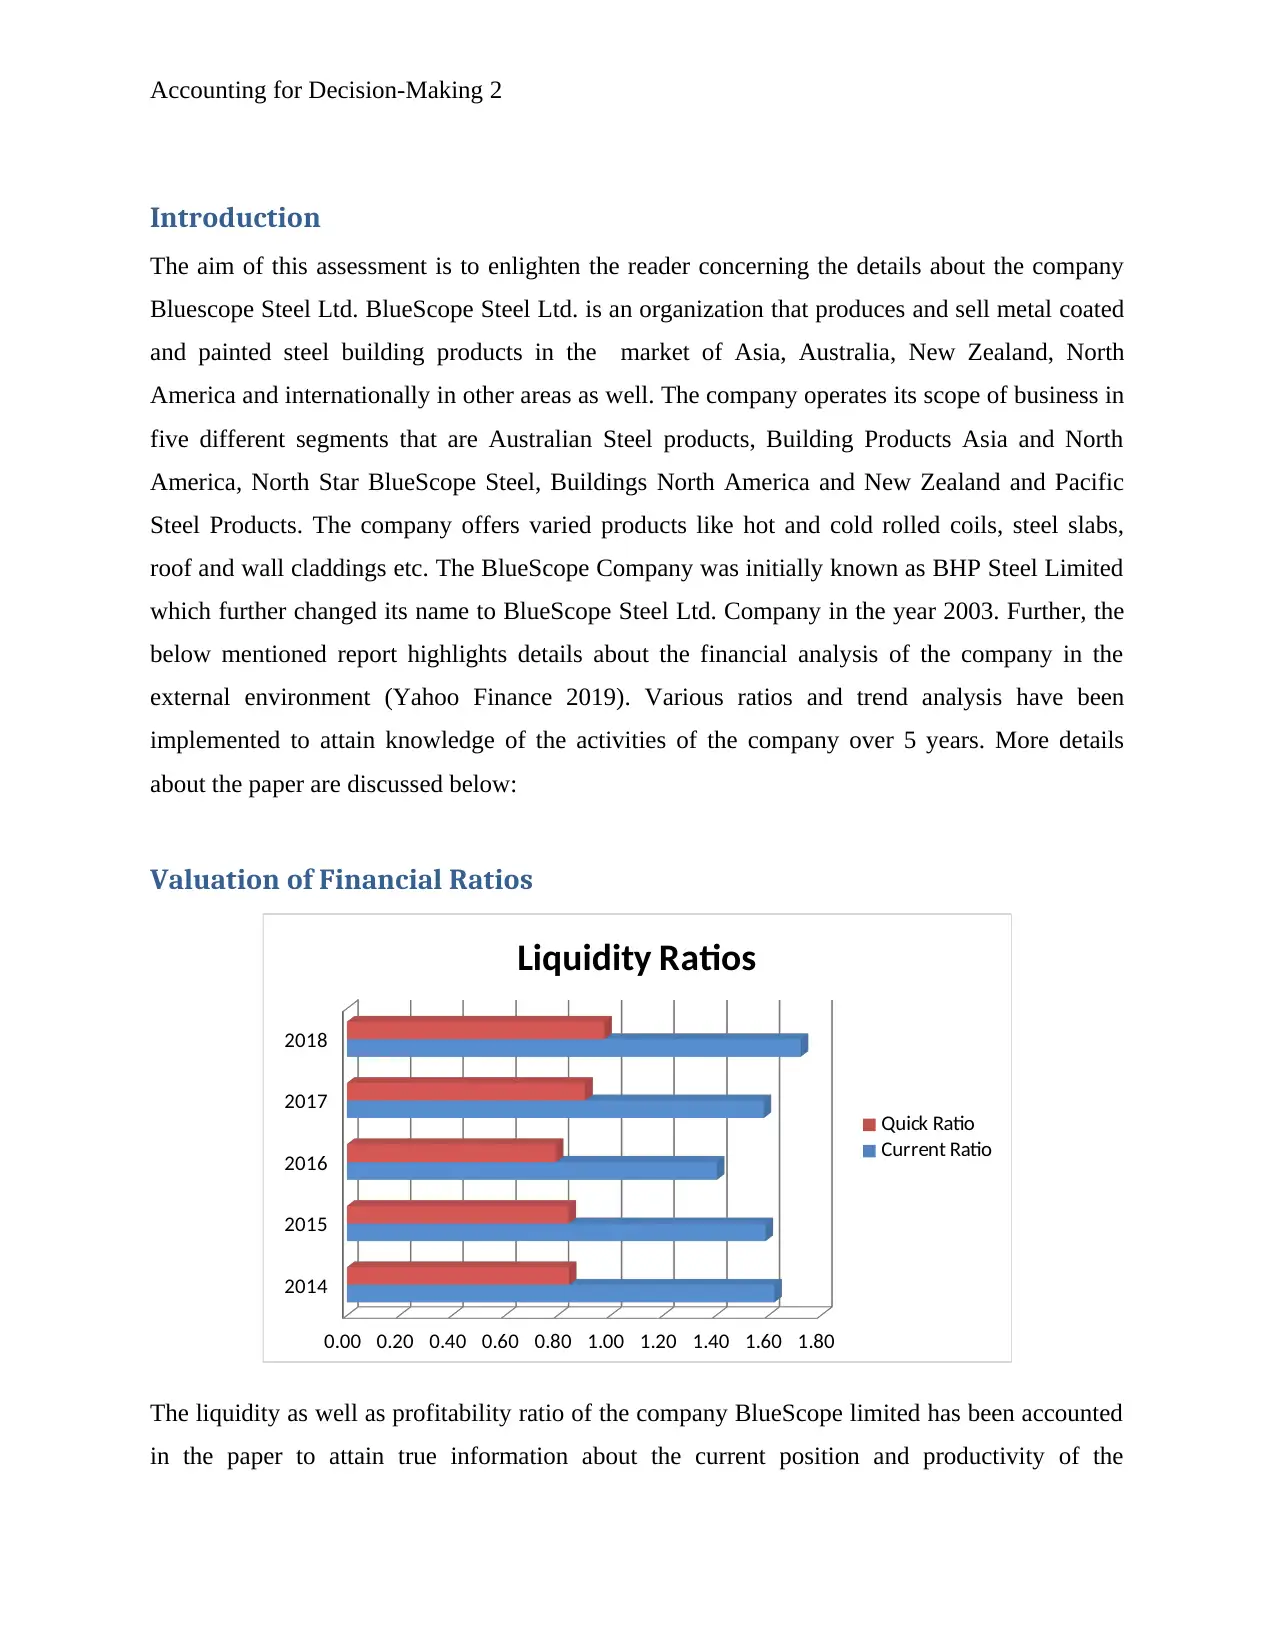
The liquidity as well as profitability ratio of the company BlueScope limited has been accounted
in the paper to attain true information about the current position and productivity of the
Introduction
The aim of this assessment is to enlighten the reader concerning the details about the company
Bluescope Steel Ltd. BlueScope Steel Ltd. is an organization that produces and sell metal coated
and painted steel building products in the market of Asia, Australia, New Zealand, North
America and internationally in other areas as well. The company operates its scope of business in
five different segments that are Australian Steel products, Building Products Asia and North
America, North Star BlueScope Steel, Buildings North America and New Zealand and Pacific
Steel Products. The company offers varied products like hot and cold rolled coils, steel slabs,
roof and wall claddings etc. The BlueScope Company was initially known as BHP Steel Limited
which further changed its name to BlueScope Steel Ltd. Company in the year 2003. Further, the
below mentioned report highlights details about the financial analysis of the company in the
external environment (Yahoo Finance 2019). Various ratios and trend analysis have been
implemented to attain knowledge of the activities of the company over 5 years. More details
about the paper are discussed below:
Valuation of Financial Ratios
2014
2015
2016
2017
2018
0.00 0.20 0.40 0.60 0.80 1.00 1.20 1.40 1.60 1.80
Liquidity Ratios
Quick Ratio
Current Ratio
The liquidity as well as profitability ratio of the company BlueScope limited has been accounted
in the paper to attain true information about the current position and productivity of the
⊘ This is a preview!⊘
Do you want full access?
Subscribe today to unlock all pages.
Trusted by 1+ million students worldwide
Accounting for Decision-Making 3
organization in the external environment. The liquidity ratio explains the efficiency of the
company to manage the regular working capital requirement in the business. This ratio also
elaborates the capability of the business to timely recompense the bills (Stouraitis 2015).
The current asset ratio of the BlueScope organization elaborates that the liquidity aspects of the
company is adequate. An adequate current asset ratio is 2, while the company is regularly
fluctuating between 1.4 to 1.7. This ratio of the company was minimum in the year 2016 while in
the previous year it regained its pace. Further, the quick ratio of the organization refers to the
ratio that elaborates the assets of the business that can be transformed into cash within 90 days or
a shorter period of time. Generally an adequate quick ratio is 1 while the company is close to it
as the quick ratio of BlueScope in the year 2018 was 0.98. Thus, it can be said that the company
adequate manage the liquidity requirement of the business (BlueScope Ltd 2018).
2014 2015 2016 2017 2018
-20.00%
0.00%
20.00%
40.00%
60.00%
80.00%
100.00%
120.00%
Net Profit
Asset Turnover Ratio
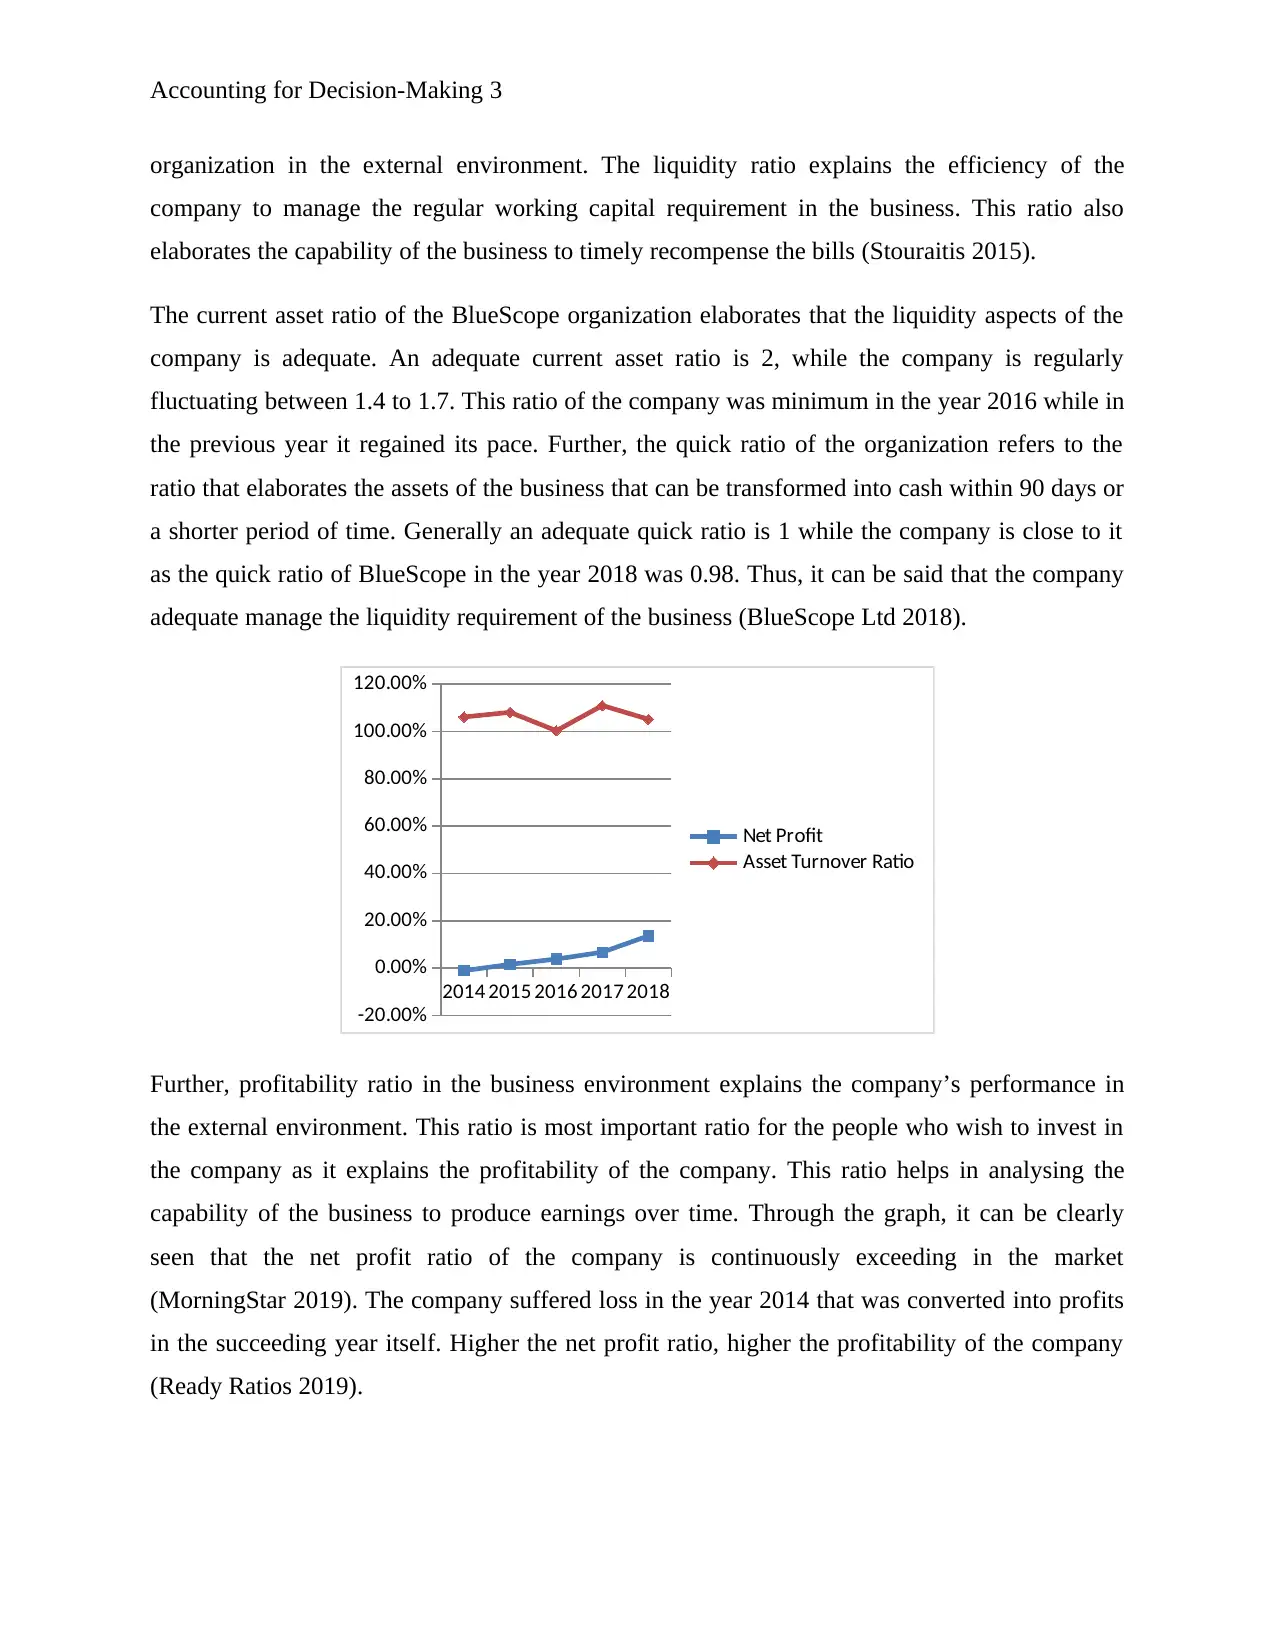
Further, profitability ratio in the business environment explains the company’s performance in
the external environment. This ratio is most important ratio for the people who wish to invest in
the company as it explains the profitability of the company. This ratio helps in analysing the
capability of the business to produce earnings over time. Through the graph, it can be clearly
seen that the net profit ratio of the company is continuously exceeding in the market
(MorningStar 2019). The company suffered loss in the year 2014 that was converted into profits
in the succeeding year itself. Higher the net profit ratio, higher the profitability of the company
(Ready Ratios 2019).
organization in the external environment. The liquidity ratio explains the efficiency of the
company to manage the regular working capital requirement in the business. This ratio also
elaborates the capability of the business to timely recompense the bills (Stouraitis 2015).
The current asset ratio of the BlueScope organization elaborates that the liquidity aspects of the
company is adequate. An adequate current asset ratio is 2, while the company is regularly
fluctuating between 1.4 to 1.7. This ratio of the company was minimum in the year 2016 while in
the previous year it regained its pace. Further, the quick ratio of the organization refers to the
ratio that elaborates the assets of the business that can be transformed into cash within 90 days or
a shorter period of time. Generally an adequate quick ratio is 1 while the company is close to it
as the quick ratio of BlueScope in the year 2018 was 0.98. Thus, it can be said that the company
adequate manage the liquidity requirement of the business (BlueScope Ltd 2018).
2014 2015 2016 2017 2018
-20.00%
0.00%
20.00%
40.00%
60.00%
80.00%
100.00%
120.00%
Net Profit
Asset Turnover Ratio
Further, profitability ratio in the business environment explains the company’s performance in
the external environment. This ratio is most important ratio for the people who wish to invest in
the company as it explains the profitability of the company. This ratio helps in analysing the
capability of the business to produce earnings over time. Through the graph, it can be clearly
seen that the net profit ratio of the company is continuously exceeding in the market
(MorningStar 2019). The company suffered loss in the year 2014 that was converted into profits
in the succeeding year itself. Higher the net profit ratio, higher the profitability of the company
(Ready Ratios 2019).
Paraphrase This Document
Need a fresh take? Get an instant paraphrase of this document with our AI Paraphraser
Accounting for Decision-Making 4
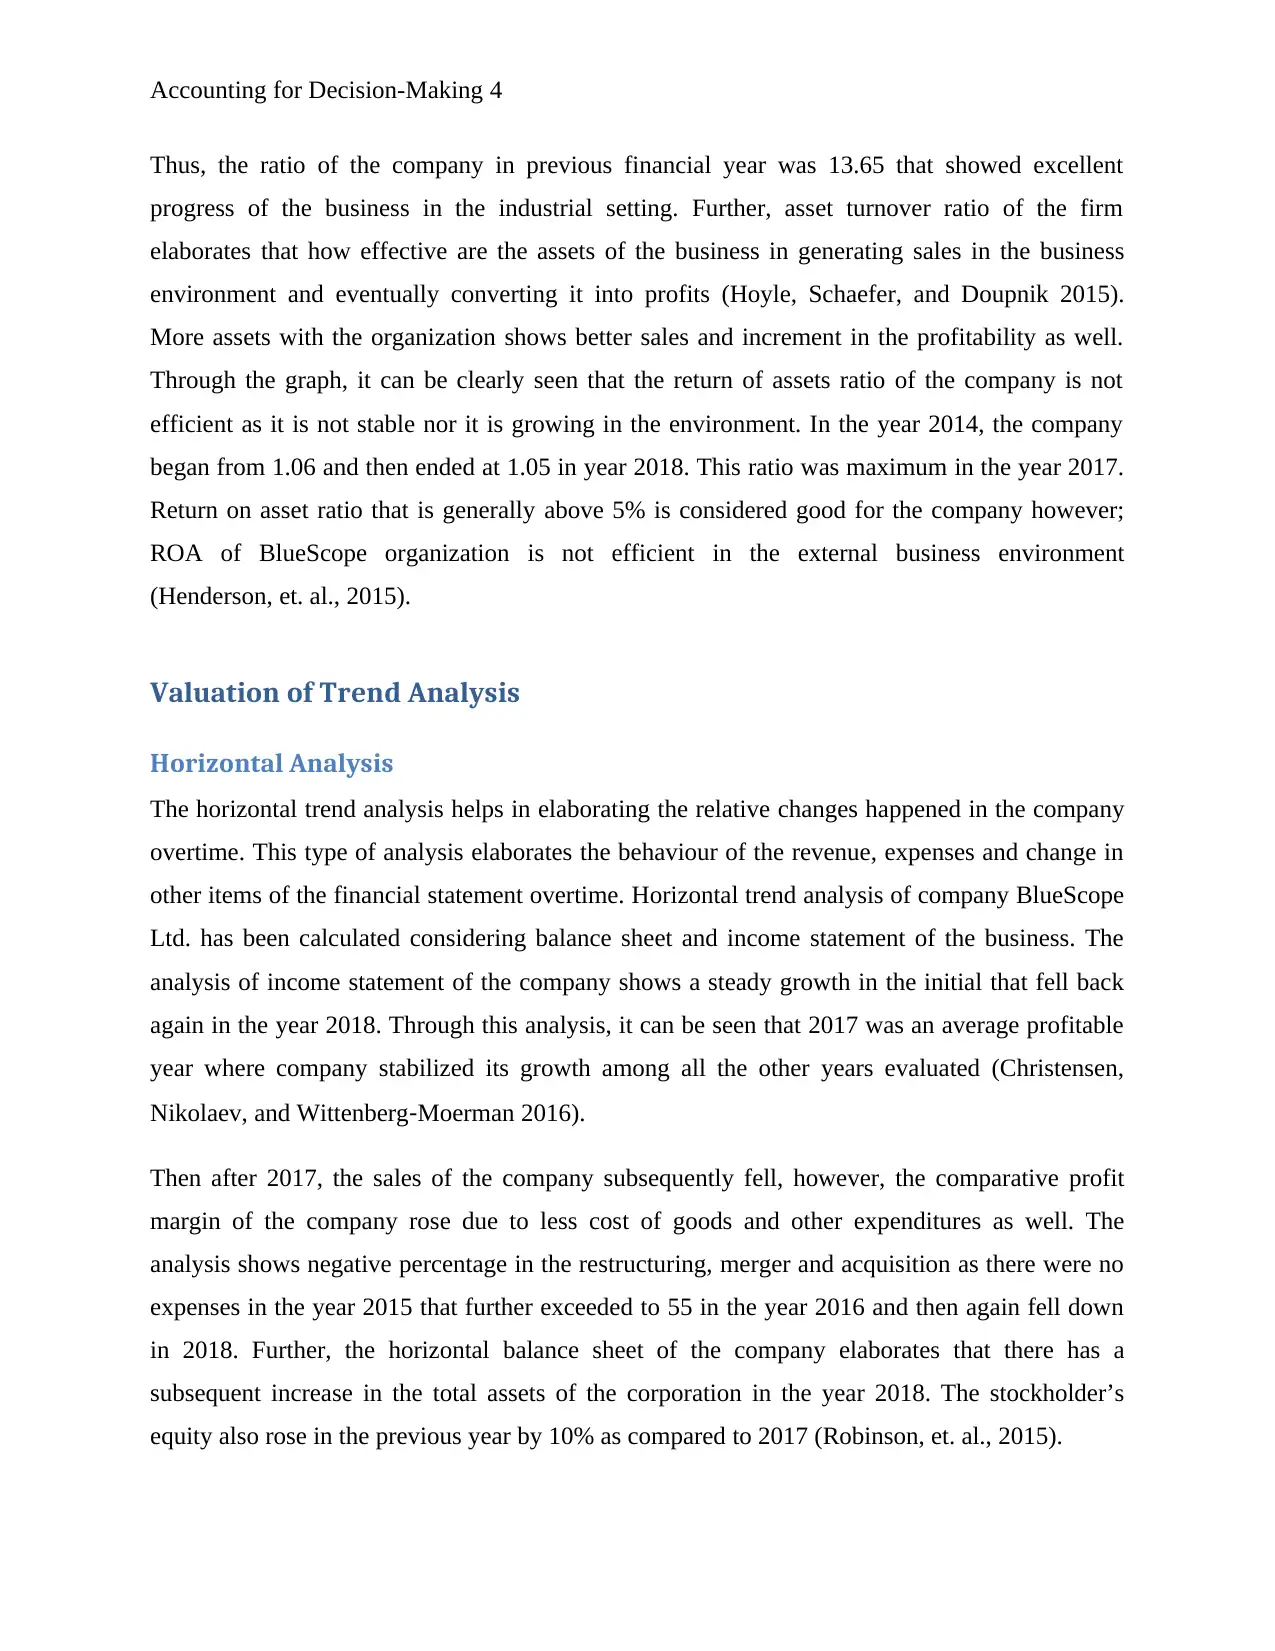
Thus, the ratio of the company in previous financial year was 13.65 that showed excellent
progress of the business in the industrial setting. Further, asset turnover ratio of the firm
elaborates that how effective are the assets of the business in generating sales in the business
environment and eventually converting it into profits (Hoyle, Schaefer, and Doupnik 2015).
More assets with the organization shows better sales and increment in the profitability as well.
Through the graph, it can be clearly seen that the return of assets ratio of the company is not
efficient as it is not stable nor it is growing in the environment. In the year 2014, the company
began from 1.06 and then ended at 1.05 in year 2018. This ratio was maximum in the year 2017.
Return on asset ratio that is generally above 5% is considered good for the company however;
ROA of BlueScope organization is not efficient in the external business environment
(Henderson, et. al., 2015).
Valuation of Trend Analysis
Horizontal Analysis
The horizontal trend analysis helps in elaborating the relative changes happened in the company
overtime. This type of analysis elaborates the behaviour of the revenue, expenses and change in
other items of the financial statement overtime. Horizontal trend analysis of company BlueScope
Ltd. has been calculated considering balance sheet and income statement of the business. The
analysis of income statement of the company shows a steady growth in the initial that fell back
again in the year 2018. Through this analysis, it can be seen that 2017 was an average profitable
year where company stabilized its growth among all the other years evaluated (Christensen,
Nikolaev, and Wittenberg‐Moerman 2016).
Then after 2017, the sales of the company subsequently fell, however, the comparative profit
margin of the company rose due to less cost of goods and other expenditures as well. The
analysis shows negative percentage in the restructuring, merger and acquisition as there were no
expenses in the year 2015 that further exceeded to 55 in the year 2016 and then again fell down
in 2018. Further, the horizontal balance sheet of the company elaborates that there has a
subsequent increase in the total assets of the corporation in the year 2018. The stockholder’s
equity also rose in the previous year by 10% as compared to 2017 (Robinson, et. al., 2015).
Accounting for Decision-Making 5
Vertical Analysis
2014-06
2016-06
2018-06-200
200
600
1000
1400
1800
Net income
Net income
Axis Title
2014-06
2015-06
2016-06
2017-06
2018-06
0
500
1000
1500
2000
2500
3000
3500
4000
4500
5000
Gross profit
Costs and
expenses
Sales, General
and
administrative
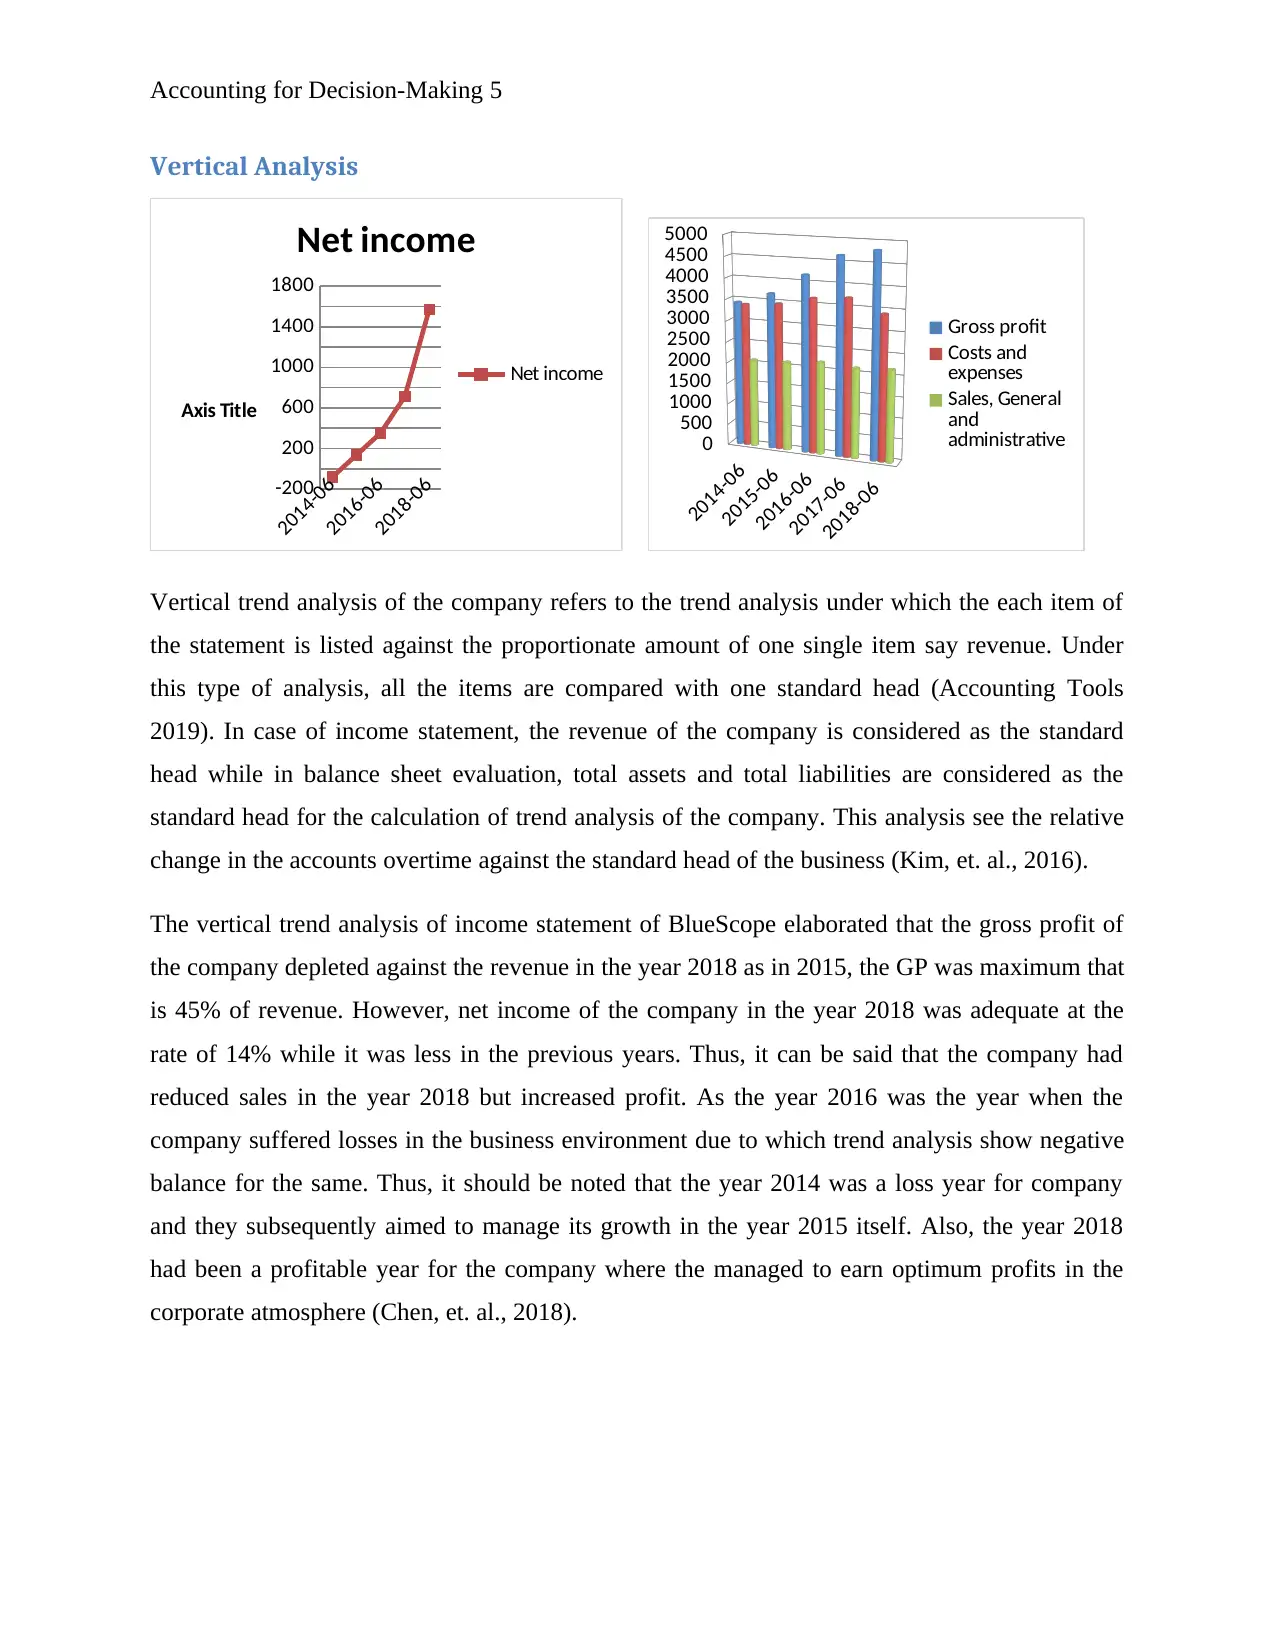
Vertical trend analysis of the company refers to the trend analysis under which the each item of
the statement is listed against the proportionate amount of one single item say revenue. Under
this type of analysis, all the items are compared with one standard head (Accounting Tools
2019). In case of income statement, the revenue of the company is considered as the standard
head while in balance sheet evaluation, total assets and total liabilities are considered as the
standard head for the calculation of trend analysis of the company. This analysis see the relative
change in the accounts overtime against the standard head of the business (Kim, et. al., 2016).
The vertical trend analysis of income statement of BlueScope elaborated that the gross profit of
the company depleted against the revenue in the year 2018 as in 2015, the GP was maximum that
is 45% of revenue. However, net income of the company in the year 2018 was adequate at the
rate of 14% while it was less in the previous years. Thus, it can be said that the company had
reduced sales in the year 2018 but increased profit. As the year 2016 was the year when the
company suffered losses in the business environment due to which trend analysis show negative
balance for the same. Thus, it should be noted that the year 2014 was a loss year for company
and they subsequently aimed to manage its growth in the year 2015 itself. Also, the year 2018
had been a profitable year for the company where the managed to earn optimum profits in the
corporate atmosphere (Chen, et. al., 2018).
Vertical Analysis
2014-06
2016-06
2018-06-200
200
600
1000
1400
1800
Net income
Net income
Axis Title
2014-06
2015-06
2016-06
2017-06
2018-06
0
500
1000
1500
2000
2500
3000
3500
4000
4500
5000
Gross profit
Costs and
expenses
Sales, General
and
administrative
Vertical trend analysis of the company refers to the trend analysis under which the each item of
the statement is listed against the proportionate amount of one single item say revenue. Under
this type of analysis, all the items are compared with one standard head (Accounting Tools
2019). In case of income statement, the revenue of the company is considered as the standard
head while in balance sheet evaluation, total assets and total liabilities are considered as the
standard head for the calculation of trend analysis of the company. This analysis see the relative
change in the accounts overtime against the standard head of the business (Kim, et. al., 2016).
The vertical trend analysis of income statement of BlueScope elaborated that the gross profit of
the company depleted against the revenue in the year 2018 as in 2015, the GP was maximum that
is 45% of revenue. However, net income of the company in the year 2018 was adequate at the
rate of 14% while it was less in the previous years. Thus, it can be said that the company had
reduced sales in the year 2018 but increased profit. As the year 2016 was the year when the
company suffered losses in the business environment due to which trend analysis show negative
balance for the same. Thus, it should be noted that the year 2014 was a loss year for company
and they subsequently aimed to manage its growth in the year 2015 itself. Also, the year 2018
had been a profitable year for the company where the managed to earn optimum profits in the
corporate atmosphere (Chen, et. al., 2018).
⊘ This is a preview!⊘
Do you want full access?
Subscribe today to unlock all pages.
Trusted by 1+ million students worldwide
Accounting for Decision-Making 6
Conclusion
Thus, while considering about cited events, it should be considered that the paper emphasized on
the information about the organization BlueScope Steel Limited. The ratio analysis and along
with trend analysis has been conducted in the paper that evaluated the past five years growth of
the company in the external business environment. The company suffered losses in 2014 which
they further managed to recover in subsequently years.
Paraphrase This Document
Need a fresh take? Get an instant paraphrase of this document with our AI Paraphraser
Accounting for Decision-Making 7
References
Accounting Tools., (2019) Vertical Analysis [online]. Retrieved from <
https://www.accountingtools.com/articles/2017/5/17/vertical-analysis> [Accessed on 30 June
2019].
BlueScope Ltd. (2018) Annual Report [online]. Retrieved from <
https://www.bluescope.com/investors/annual-reports/> [Accessed on 30 June 2019].
Chen, C.W., Collins, D.W., Kravet, T.D. and Mergenthaler, R.D., 2018. Financial statement
comparability and the efficiency of acquisition decisions. Contemporary Accounting
Research, 35(1), pp.164-202.
Christensen, H.B., Nikolaev, V.V. and Wittenberg‐Moerman, R., 2016. Accounting information
in financial contracting: The incomplete contract theory perspective. Journal of accounting
research, 54(2), pp.397-435.
Henderson, S., Peirson, G., Herbohn, K. and Howieson, B., 2015. Issues in financial accounting.
Pearson Higher Education AU.
Hoyle, J.B., Schaefer, T. and Doupnik, T., 2015. Advanced accounting. McGraw Hill.
Kim, J.B., Li, L., Lu, L.Y. and Yu, Y., 2016. Financial statement comparability and expected
crash risk. Journal of Accounting and Economics, 61(2-3), pp.294-312.
MorningStar., (2019) BlueScope Steel Ltd BSL [online]. Retrieved from <
https://www.morningstar.com/stocks/XASX/BSL/quote.html > [Accessed on 30 June 2019].
Ready Ratios., (2019) Horizontal Analysis of Financial Statements [online]. Retrieved from <
https://www.readyratios.com/reference/analysis/horizontal_analysis_of_financial_statements.ht
ml> [Accessed on 30 June 2019].
Robinson, T.R., Henry, E., Pirie, W.L. and Broihahn, M.A., 2015. International financial
statement analysis. John Wiley & Sons.
Accounting for Decision-Making 8
Stouraitis, A., 2015. Corporate Restructuring And Accounting Information. Wiley Encyclopedia
of Management, pp.1-6.Collier, P.M., 2015. Accounting for managers: Interpreting accounting
information for decision making. John Wiley & Sons.
Yahoo Finance., (2019) BlueScope Steel Limited [online]. Retrieved from <
https://in.finance.yahoo.com/quote/BSL.AX/profile?p=BSL.AX> [Accessed on 30 June 2019].
⊘ This is a preview!⊘
Do you want full access?
Subscribe today to unlock all pages.
Trusted by 1+ million students worldwide
Accounting for Decision-Making 9
Appendices
Income Statement
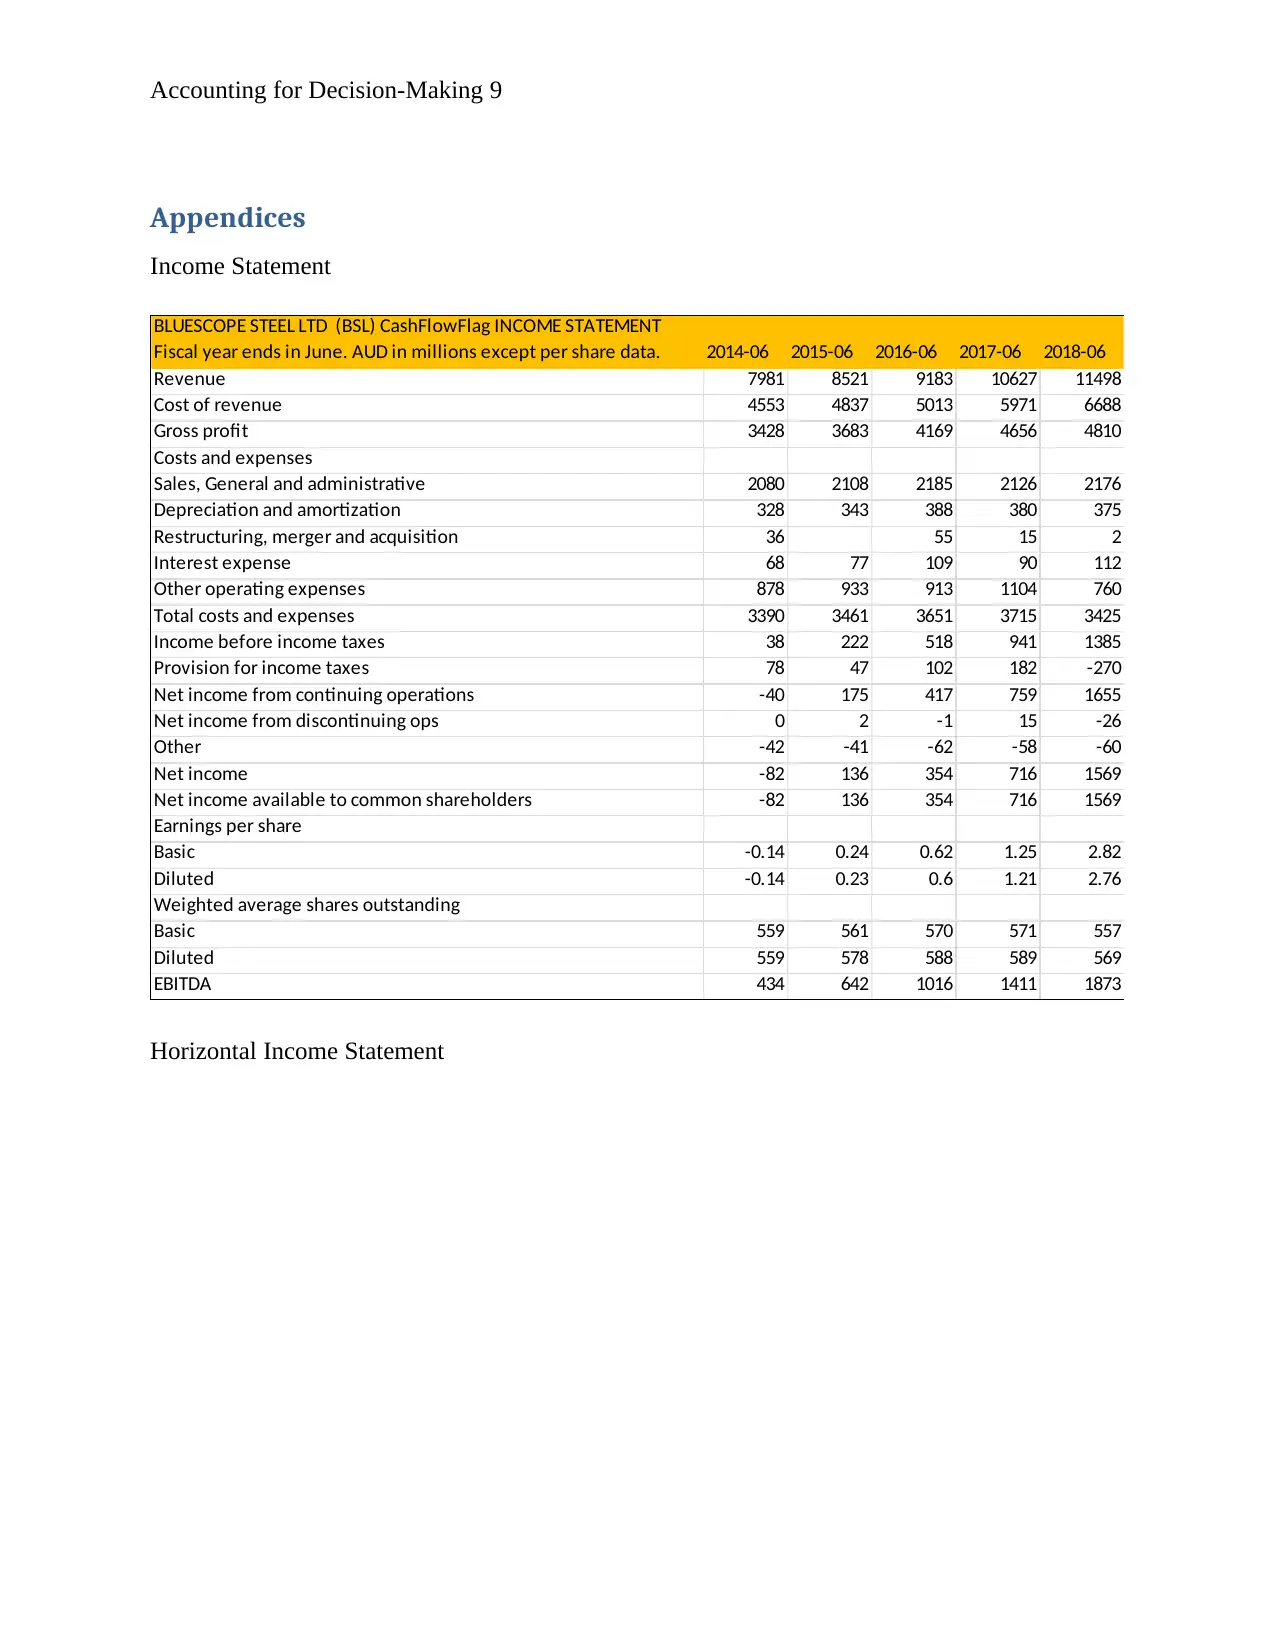
BLUESCOPE STEEL LTD (BSL) CashFlowFlag INCOME STATEMENT
Fiscal year ends in June. AUD in millions except per share data. 2014-06 2015-06 2016-06 2017-06 2018-06
Revenue 7981 8521 9183 10627 11498
Cost of revenue 4553 4837 5013 5971 6688
Gross profit 3428 3683 4169 4656 4810
Costs and expenses
Sales, General and administrative 2080 2108 2185 2126 2176
Depreciation and amortization 328 343 388 380 375
Restructuring, merger and acquisition 36 55 15 2
Interest expense 68 77 109 90 112
Other operating expenses 878 933 913 1104 760
Total costs and expenses 3390 3461 3651 3715 3425
Income before income taxes 38 222 518 941 1385
Provision for income taxes 78 47 102 182 -270
Net income from continuing operations -40 175 417 759 1655
Net income from discontinuing ops 0 2 -1 15 -26
Other -42 -41 -62 -58 -60
Net income -82 136 354 716 1569
Net income available to common shareholders -82 136 354 716 1569
Earnings per share
Basic -0.14 0.24 0.62 1.25 2.82
Diluted -0.14 0.23 0.6 1.21 2.76
Weighted average shares outstanding
Basic 559 561 570 571 557
Diluted 559 578 588 589 569
EBITDA 434 642 1016 1411 1873
Horizontal Income Statement
Appendices
Income Statement
BLUESCOPE STEEL LTD (BSL) CashFlowFlag INCOME STATEMENT
Fiscal year ends in June. AUD in millions except per share data. 2014-06 2015-06 2016-06 2017-06 2018-06
Revenue 7981 8521 9183 10627 11498
Cost of revenue 4553 4837 5013 5971 6688
Gross profit 3428 3683 4169 4656 4810
Costs and expenses
Sales, General and administrative 2080 2108 2185 2126 2176
Depreciation and amortization 328 343 388 380 375
Restructuring, merger and acquisition 36 55 15 2
Interest expense 68 77 109 90 112
Other operating expenses 878 933 913 1104 760
Total costs and expenses 3390 3461 3651 3715 3425
Income before income taxes 38 222 518 941 1385
Provision for income taxes 78 47 102 182 -270
Net income from continuing operations -40 175 417 759 1655
Net income from discontinuing ops 0 2 -1 15 -26
Other -42 -41 -62 -58 -60
Net income -82 136 354 716 1569
Net income available to common shareholders -82 136 354 716 1569
Earnings per share
Basic -0.14 0.24 0.62 1.25 2.82
Diluted -0.14 0.23 0.6 1.21 2.76
Weighted average shares outstanding
Basic 559 561 570 571 557
Diluted 559 578 588 589 569
EBITDA 434 642 1016 1411 1873
Horizontal Income Statement
Paraphrase This Document
Need a fresh take? Get an instant paraphrase of this document with our AI Paraphraser
Accounting for Decision-Making 10
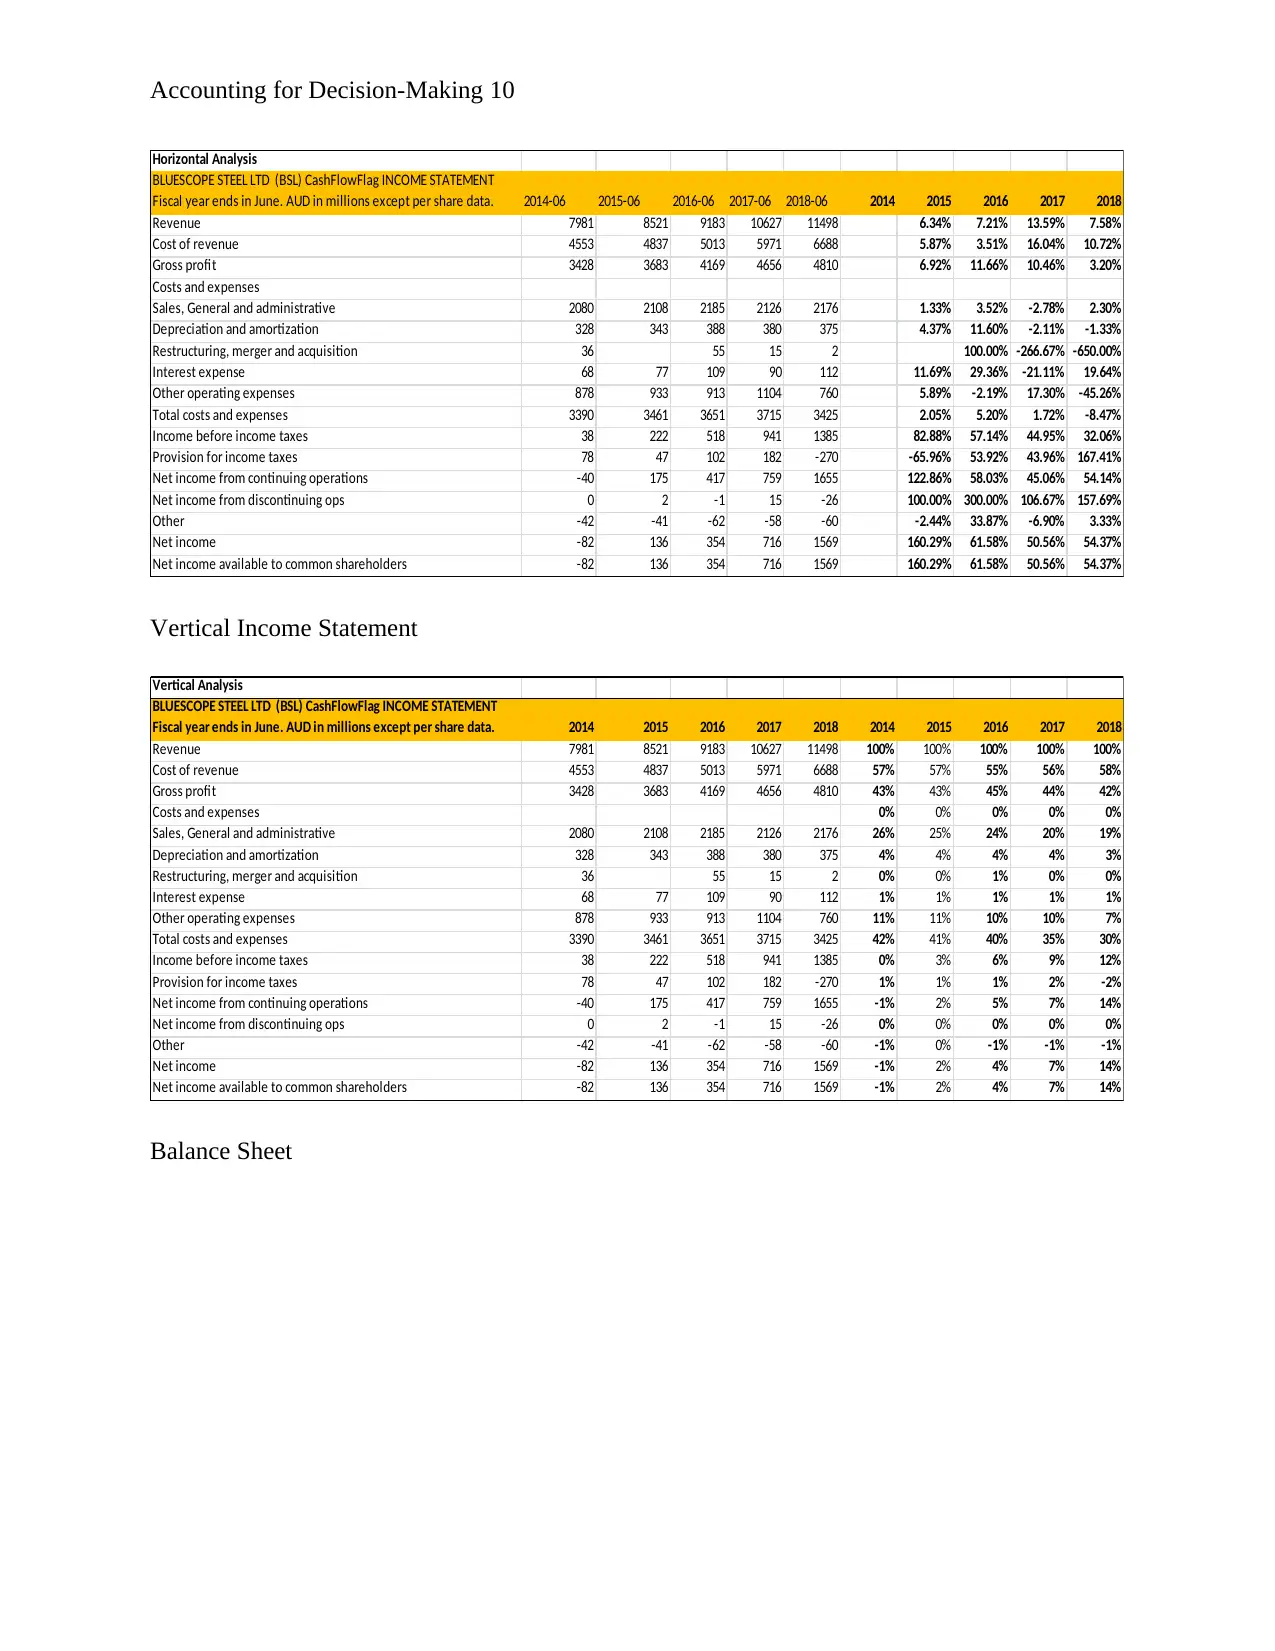
Horizontal Analysis
BLUESCOPE STEEL LTD (BSL) CashFlowFlag INCOME STATEMENT
Fiscal year ends in June. AUD in millions except per share data. 2014-06 2015-06 2016-06 2017-06 2018-06 2014 2015 2016 2017 2018
Revenue 7981 8521 9183 10627 11498 6.34% 7.21% 13.59% 7.58%
Cost of revenue 4553 4837 5013 5971 6688 5.87% 3.51% 16.04% 10.72%
Gross profit 3428 3683 4169 4656 4810 6.92% 11.66% 10.46% 3.20%
Costs and expenses
Sales, General and administrative 2080 2108 2185 2126 2176 1.33% 3.52% -2.78% 2.30%
Depreciation and amortization 328 343 388 380 375 4.37% 11.60% -2.11% -1.33%
Restructuring, merger and acquisition 36 55 15 2 100.00% -266.67% -650.00%
Interest expense 68 77 109 90 112 11.69% 29.36% -21.11% 19.64%
Other operating expenses 878 933 913 1104 760 5.89% -2.19% 17.30% -45.26%
Total costs and expenses 3390 3461 3651 3715 3425 2.05% 5.20% 1.72% -8.47%
Income before income taxes 38 222 518 941 1385 82.88% 57.14% 44.95% 32.06%
Provision for income taxes 78 47 102 182 -270 -65.96% 53.92% 43.96% 167.41%
Net income from continuing operations -40 175 417 759 1655 122.86% 58.03% 45.06% 54.14%
Net income from discontinuing ops 0 2 -1 15 -26 100.00% 300.00% 106.67% 157.69%
Other -42 -41 -62 -58 -60 -2.44% 33.87% -6.90% 3.33%
Net income -82 136 354 716 1569 160.29% 61.58% 50.56% 54.37%
Net income available to common shareholders -82 136 354 716 1569 160.29% 61.58% 50.56% 54.37%
Vertical Income Statement
Vertical Analysis
BLUESCOPE STEEL LTD (BSL) CashFlowFlag INCOME STATEMENT
Fiscal year ends in June. AUD in millions except per share data. 2014 2015 2016 2017 2018 2014 2015 2016 2017 2018
Revenue 7981 8521 9183 10627 11498 100% 100% 100% 100% 100%
Cost of revenue 4553 4837 5013 5971 6688 57% 57% 55% 56% 58%
Gross profit 3428 3683 4169 4656 4810 43% 43% 45% 44% 42%
Costs and expenses 0% 0% 0% 0% 0%
Sales, General and administrative 2080 2108 2185 2126 2176 26% 25% 24% 20% 19%
Depreciation and amortization 328 343 388 380 375 4% 4% 4% 4% 3%
Restructuring, merger and acquisition 36 55 15 2 0% 0% 1% 0% 0%
Interest expense 68 77 109 90 112 1% 1% 1% 1% 1%
Other operating expenses 878 933 913 1104 760 11% 11% 10% 10% 7%
Total costs and expenses 3390 3461 3651 3715 3425 42% 41% 40% 35% 30%
Income before income taxes 38 222 518 941 1385 0% 3% 6% 9% 12%
Provision for income taxes 78 47 102 182 -270 1% 1% 1% 2% -2%
Net income from continuing operations -40 175 417 759 1655 -1% 2% 5% 7% 14%
Net income from discontinuing ops 0 2 -1 15 -26 0% 0% 0% 0% 0%
Other -42 -41 -62 -58 -60 -1% 0% -1% -1% -1%
Net income -82 136 354 716 1569 -1% 2% 4% 7% 14%
Net income available to common shareholders -82 136 354 716 1569 -1% 2% 4% 7% 14%
Balance Sheet
Accounting for Decision-Making 11
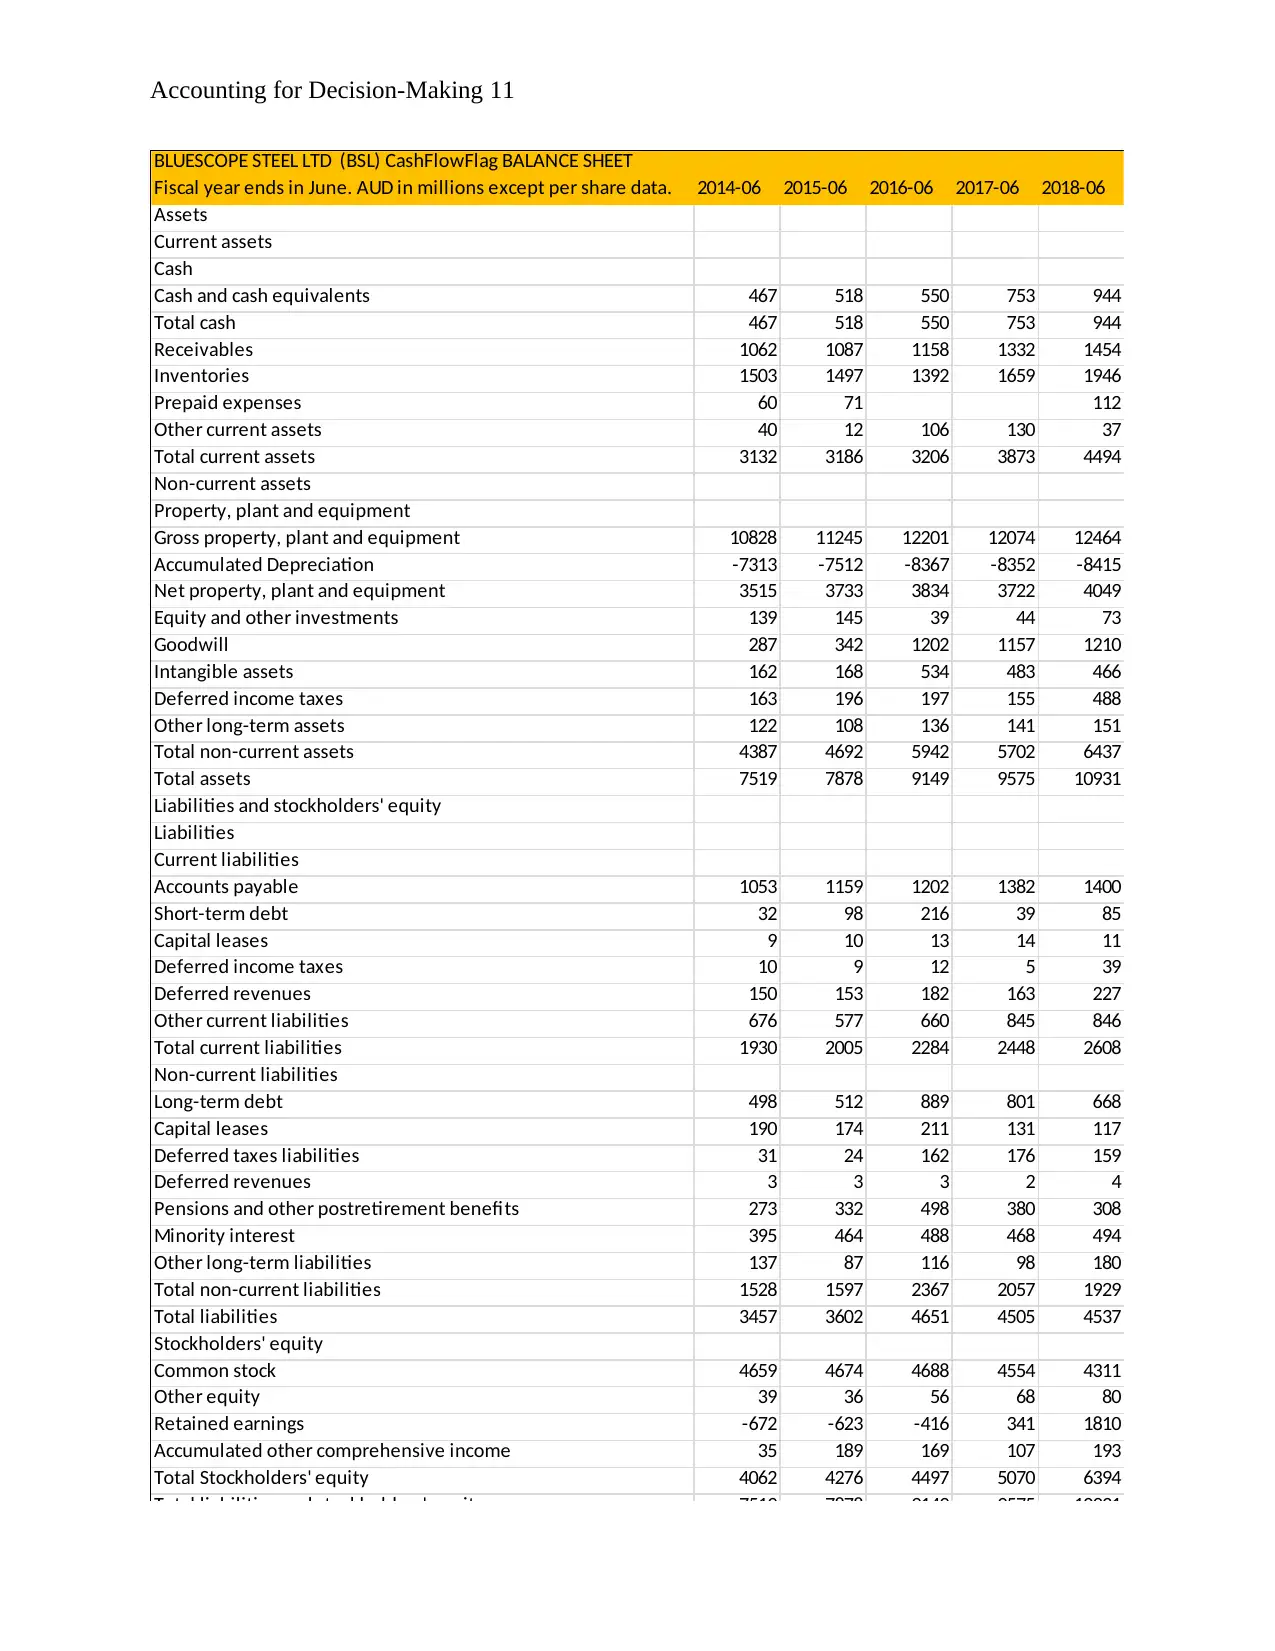
BLUESCOPE STEEL LTD (BSL) CashFlowFlag BALANCE SHEET
Fiscal year ends in June. AUD in millions except per share data. 2014-06 2015-06 2016-06 2017-06 2018-06
Assets
Current assets
Cash
Cash and cash equivalents 467 518 550 753 944
Total cash 467 518 550 753 944
Receivables 1062 1087 1158 1332 1454
Inventories 1503 1497 1392 1659 1946
Prepaid expenses 60 71 112
Other current assets 40 12 106 130 37
Total current assets 3132 3186 3206 3873 4494
Non-current assets
Property, plant and equipment
Gross property, plant and equipment 10828 11245 12201 12074 12464
Accumulated Depreciation -7313 -7512 -8367 -8352 -8415
Net property, plant and equipment 3515 3733 3834 3722 4049
Equity and other investments 139 145 39 44 73
Goodwill 287 342 1202 1157 1210
Intangible assets 162 168 534 483 466
Deferred income taxes 163 196 197 155 488
Other long-term assets 122 108 136 141 151
Total non-current assets 4387 4692 5942 5702 6437
Total assets 7519 7878 9149 9575 10931
Liabilities and stockholders' equity
Liabilities
Current liabilities
Accounts payable 1053 1159 1202 1382 1400
Short-term debt 32 98 216 39 85
Capital leases 9 10 13 14 11
Deferred income taxes 10 9 12 5 39
Deferred revenues 150 153 182 163 227
Other current liabilities 676 577 660 845 846
Total current liabilities 1930 2005 2284 2448 2608
Non-current liabilities
Long-term debt 498 512 889 801 668
Capital leases 190 174 211 131 117
Deferred taxes liabilities 31 24 162 176 159
Deferred revenues 3 3 3 2 4
Pensions and other postretirement benefits 273 332 498 380 308
Minority interest 395 464 488 468 494
Other long-term liabilities 137 87 116 98 180
Total non-current liabilities 1528 1597 2367 2057 1929
Total liabilities 3457 3602 4651 4505 4537
Stockholders' equity
Common stock 4659 4674 4688 4554 4311
Other equity 39 36 56 68 80
Retained earnings -672 -623 -416 341 1810
Accumulated other comprehensive income 35 189 169 107 193
Total Stockholders' equity 4062 4276 4497 5070 6394
Total liabilities and stockholders' equity 7519 7878 9149 9575 10931
⊘ This is a preview!⊘
Do you want full access?
Subscribe today to unlock all pages.
Trusted by 1+ million students worldwide
1 out of 15
Related Documents


Your All-in-One AI-Powered Toolkit for Academic Success.
+13062052269
info@desklib.com
Available 24*7 on WhatsApp / Email
![[object Object]](/_next/static/media/star-bottom.7253800d.svg)
Unlock your academic potential
Copyright © 2020–2026 A2Z Services. All Rights Reserved. Developed and managed by ZUCOL.