MBS539 Accounting: Comparative Analysis of Qantas and Air New Zealand
VerifiedAdded on 2023/06/03
|8
|2309
|58
Report
AI Summary
This report analyzes the financial performance of Qantas Airways Limited for the year 2017, comparing it with Air New Zealand through ratio analysis. It examines industry characteristics, key financial ratios (profit margin, current ratio, quick ratio, return on total assets, receivable turnover, debt ratio, and earnings per share), and their implications for profitability, liquidity, and solvency. The report concludes that Air New Zealand exhibits stronger profitability and liquidity, suggesting improvements for Qantas in these areas through enhanced sales, cost reduction, and optimized cash flow management.
Running head: ACCOUNTING FOR MANAGERS
Accounting for Managers
Name of the Student:
Name of the University:
Author’s Note
Accounting for Managers
Name of the Student:
Name of the University:
Author’s Note
Paraphrase This Document
Need a fresh take? Get an instant paraphrase of this document with our AI Paraphraser
1
ACCOUNTING FOR MANAGERS
Table of Contents
Introduction......................................................................................................................................2
Discussion........................................................................................................................................2
Nature of the Business.................................................................................................................2
Industry and Financial Statement................................................................................................3
Components of the Balance Sheet...............................................................................................3
Components of Income Statement...............................................................................................4
Ratio Analysis..............................................................................................................................4
Conclusion.......................................................................................................................................6
Reference.........................................................................................................................................7
2
ACCOUNTING FOR MANAGERS
Introduction
The main purpose of this assessment is to analyze the financial report of Qantas ltd for
the year 2017. The analysis would be conducted considering the results which are obtained from
computation of key financial ratios of the business. The results of the business of Qantas ltd is to
be compared with the results which is computed with one of the competitors of Qantas ltd. The
analysis of the financial statements would also be helpful in deciding which business has better
performance in order to make investment decisions. The report also shows computations relating
to significant financial ratios of both Qantas ltd and Air New Zealand on the basis of which the
analysis is to be conducted.
Discussion
Nature of the Business
The business of Qantas ltd is regarded as one of the largest fleet carrying airlines in
Australia and has the maximum business in the country. The name of Qantas ltd comes from an
acronym which is "Queensland and Northern Territory Aerial Services" The airline operates in
Australia and also has operations through various acquired airlines and the business can offer
lower cost to the customers by such subsidiary airlines (Rosenstein 2013). A market estimate
shows that the business of Qantas ltd accounts for 65% of domestic travels in the country and
also around 15% of foreign travel in Australia (Investors | Qantas.2018). This shows that the
business of Qantas has acquired maximum market shares in airline industry. The airline also
covers destination points of 85 points around the world and also has a flight strength of 127
fleets.
Industry and Financial Statement
The airline industry in Australia is a fast moving and productive industry wherein most of
the airlines are undergoing expansion. The industry is also favorable as the number of domestic
travel as well as foreign travel in the country is increasing due to the effect of tourism (Williams
2017). The management of Qantas ltd is also undergoing an expansion phase and the annual
report for the year 2017 specifies that the management of the company aims to attain sustainable
development which would help in efficient utilization of fuel and expand the business operation
in Asia. The financial statement of the business is prepared as per the conceptual framework
⊘ This is a preview!⊘
Do you want full access?
Subscribe today to unlock all pages.
Trusted by 1+ million students worldwide
3
ACCOUNTING FOR MANAGERS
which is followed by most of the businesses in the preparation of the financial statement of the
business (David 2013). The financial statement of the business comprises of Income statement,
Balance Sheet and Cash flow statement as shown in the annual report of the company for 2017.
Components of the Balance Sheet
The components which are covered in the balance sheet of the business for the year
shows items under the head current assets, non-current assets, current liabilities and non-current
liabilities of the business. The balance sheet also shows the equity capital balance which is
utilized by the business to meet and carry out the operations of the business. The current assets of
the business are shown to have slightly fallen in comparison to previous year which also signifies
that there is a fall in the liquidity of the business (Morrell 2013). The balance sheet also displays
non-current assets such as property, plant and equipment, intangible assets and other assets of the
business. The assets also include the air fleets which are under the ownership of the business and
also the related inventories of the same which includes spare parts, tires and other tools. The
liabilities of the business mainly comprise of interest bearing liabilities and payables of the
business. The equity area which is shown in the balance sheet of the business shows retained
earnings, equity share capital and reserves of the business.
The balance sheet shows deferred tax items which related to tax which is due from
previous years or which arises due to temporary differences. The amount of deferred tax items
which are shown in the financial statements are of significant amount and therefore they are
capable of affecting the financial statements of the business (Atieh 2014). Therefore, the items
must be treated by the management of the company effectively and also according to accounting
regulations.
Components of Income Statement
The income statement which is prepared by the business shows all the revenue and expenses
which is generated by the company during the period. The income statement is prepared by the
business to ascertain the profit which is made during the year. The income statement of Qantas
ltd for the year 2017 shows that the main source of revenue for the business is through net
passenger revenues and revenue which is generated from freight services. The major expenses
which is incurred by the business is through fuel, machinery parts, manpower maintenance. After
deducting such expenses, the profit which is generated by the business is computed and the same
Paraphrase This Document
Need a fresh take? Get an instant paraphrase of this document with our AI Paraphraser
4
ACCOUNTING FOR MANAGERS
is shown to be $ 853 million which has significantly fallen in comparison to previous year’s
estimate which is shown to be $ 1029 million. The decrease in the profitability of the business in
comparison to previous year’s estimates can be attributed to the high costs which are incurred by
the business during the period and also low sales which is achieved by the company in current
year.
The significant item which is shown in the income statement is the operating lease
expenses for an aircraft which signifies the payment which is made in respect of leases taken by
the management of Qantas ltd. The amount forms a significant part of the expenses of the
business and therefore can directly affect the profitability of the business.
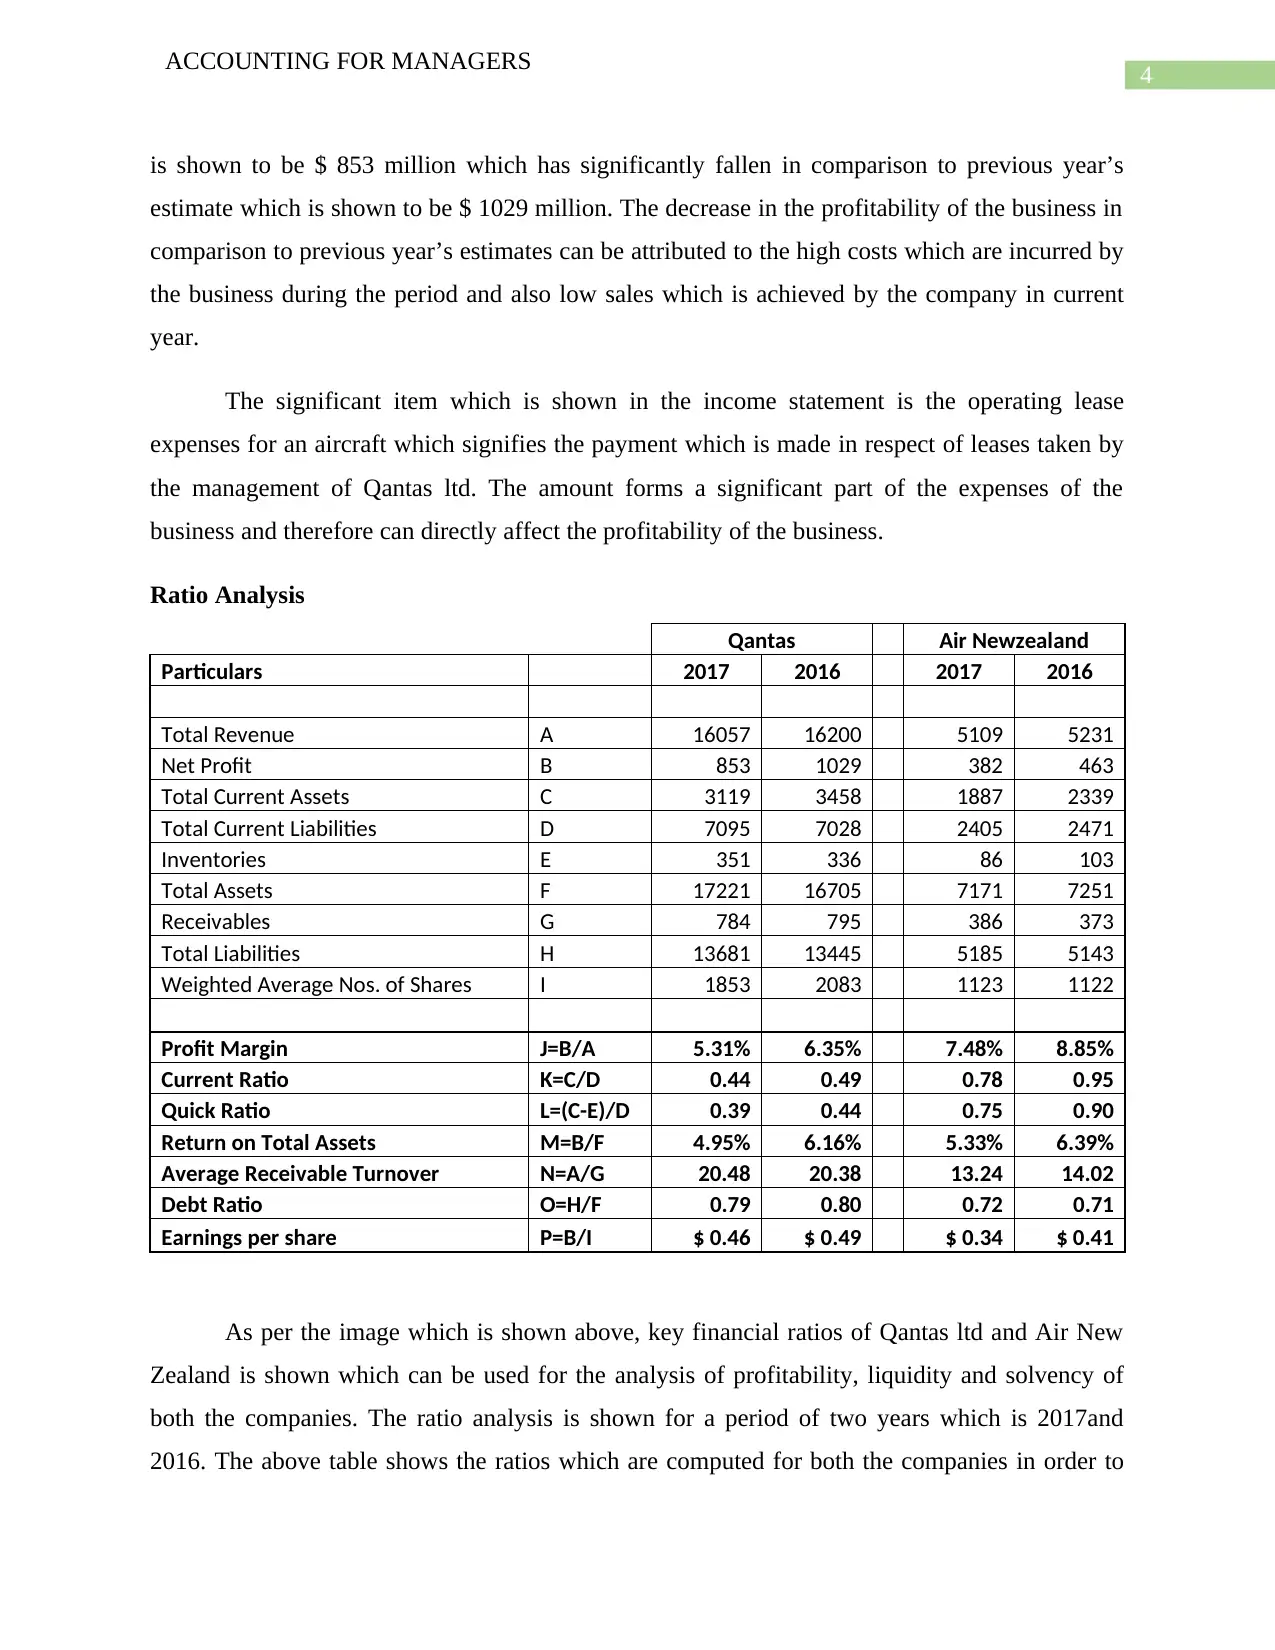
Ratio Analysis
Qantas Air Newzealand
Particulars 2017 2016 2017 2016
Total Revenue A 16057 16200 5109 5231
Net Profit B 853 1029 382 463
Total Current Assets C 3119 3458 1887 2339
Total Current Liabilities D 7095 7028 2405 2471
Inventories E 351 336 86 103
Total Assets F 17221 16705 7171 7251
Receivables G 784 795 386 373
Total Liabilities H 13681 13445 5185 5143
Weighted Average Nos. of Shares I 1853 2083 1123 1122
Profit Margin J=B/A 5.31% 6.35% 7.48% 8.85%
Current Ratio K=C/D 0.44 0.49 0.78 0.95
Quick Ratio L=(C-E)/D 0.39 0.44 0.75 0.90
Return on Total Assets M=B/F 4.95% 6.16% 5.33% 6.39%
Average Receivable Turnover N=A/G 20.48 20.38 13.24 14.02
Debt Ratio O=H/F 0.79 0.80 0.72 0.71
Earnings per share P=B/I $ 0.46 $ 0.49 $ 0.34 $ 0.41
As per the image which is shown above, key financial ratios of Qantas ltd and Air New
Zealand is shown which can be used for the analysis of profitability, liquidity and solvency of
both the companies. The ratio analysis is shown for a period of two years which is 2017and
2016. The above table shows the ratios which are computed for both the companies in order to
ACCOUNTING FOR MANAGERS
is shown to be $ 853 million which has significantly fallen in comparison to previous year’s
estimate which is shown to be $ 1029 million. The decrease in the profitability of the business in
comparison to previous year’s estimates can be attributed to the high costs which are incurred by
the business during the period and also low sales which is achieved by the company in current
year.
The significant item which is shown in the income statement is the operating lease
expenses for an aircraft which signifies the payment which is made in respect of leases taken by
the management of Qantas ltd. The amount forms a significant part of the expenses of the
business and therefore can directly affect the profitability of the business.
Ratio Analysis
Qantas Air Newzealand
Particulars 2017 2016 2017 2016
Total Revenue A 16057 16200 5109 5231
Net Profit B 853 1029 382 463
Total Current Assets C 3119 3458 1887 2339
Total Current Liabilities D 7095 7028 2405 2471
Inventories E 351 336 86 103
Total Assets F 17221 16705 7171 7251
Receivables G 784 795 386 373
Total Liabilities H 13681 13445 5185 5143
Weighted Average Nos. of Shares I 1853 2083 1123 1122
Profit Margin J=B/A 5.31% 6.35% 7.48% 8.85%
Current Ratio K=C/D 0.44 0.49 0.78 0.95
Quick Ratio L=(C-E)/D 0.39 0.44 0.75 0.90
Return on Total Assets M=B/F 4.95% 6.16% 5.33% 6.39%
Average Receivable Turnover N=A/G 20.48 20.38 13.24 14.02
Debt Ratio O=H/F 0.79 0.80 0.72 0.71
Earnings per share P=B/I $ 0.46 $ 0.49 $ 0.34 $ 0.41
As per the image which is shown above, key financial ratios of Qantas ltd and Air New
Zealand is shown which can be used for the analysis of profitability, liquidity and solvency of
both the companies. The ratio analysis is shown for a period of two years which is 2017and
2016. The above table shows the ratios which are computed for both the companies in order to
5
ACCOUNTING FOR MANAGERS
make comparative study of these companies much easier in such a way. The profitability ratios
of Qantas ltd shows a fall in the profits of the business and the estimate is shown to be 5.31% in
2017 while the same was 6.35 in 2016. The profitability ratio of Air New Zealand is shown to be
better than Qantas ltd and the estimate for the year 2017 is shown to be 7.48%. However, it is to
be noted that the profitability has slightly fallen (Konchitchki and Patatoukas 2013). The fall in
the profitability might be due to increase in the costs of the business or fall in the sales of the
airlines.
The current ratio and quick ratio of both the companies which is computed in the above
table shows the ability of both the companies to meet the current obligations of the business
effectively and therefore is mainly concerned with the capacity of the business to effectively
maintain cash resources in the business (Carraher and Van Auken 2013). The current ratio
estimates for Qantas ltd for the year 2018 is shown to be 0.44 while the same is shown to be 0.78
for Air New Zealand for the same year. The quick ratio of both the companies is also depicting
the same results. It is to be noted that the liquidity estimates for both the companies have fallen
in the current year in comparison to previous year (Delen, Kuzey and Uyar 2013). This suggest
that the management of both the companies need to improve their liquidity position effectively in
order to support the operational activities of the business.
The return on total asset is considered to be one of the financial indicators for overall
success of a business and the estimate is shown to be better for Air New Zealand in comparison
to Qantas ltd for the year 2017. This shows that the business of Air New Zealand has a better
control and management system which effectively maintains the profitability of the business and
also meet the expectations of the shareholders of the company. The average receivable turnover
ratio portrays the level of efficiency in a business and the estimates which are computed shows
that the business of Qantas has a more efficient framework in inventory management and the
estimate is shown to be 20.48 for the year 2017and the same shows that the efficiency level in
the business has increased. On the other hand, the average receivable turnover estimate which is
computed for Air New Zealand is shown to be 13.24 for the year 2017 while the estimate
calculated for 2016 is shown to be more which suggest that the efficiency level of the business
has fallen slightly.
⊘ This is a preview!⊘
Do you want full access?
Subscribe today to unlock all pages.
Trusted by 1+ million students worldwide
6
ACCOUNTING FOR MANAGERS
The debt ratio of the business forms a part of capital structure ratios and the same is
shown to have decreased for Qantas ltd for the year 2017 while on the other hand the ratio is
shown to have increased for Air New Zealand. This shows that the business of Qantas ltd is not
much dependent on loans for the purpose of financing the projects of the business. The
comparison also reveals that the business of Air New Zealand is slightly dependent on debt
financing and therefore the level of debts which is used by the business has increased during the
period. High level of debts also signifies that the risks of the business would also be higher. The
earning per share for both the companies is shown to have fallen which can be due to the fall in
the profitability of the business and therefore the profit available to equity shareholders have
fallen.
Conclusion
Thus, from the discussion which is shown above, the business of Air New Zealand is
shown to be more attractive in terms of profitability and liquidity position from an investor point
of view. It is therefore suggested to the management of Qantas ltd that the profitability and
liquidity of the business needs to be improved. The profitability of the business can be improved
by making improvements in sales of the business and also reducing the costs of the business
effectively. On the other hand, the liquidity of the business can be improved by improving the
cash flows of the business and also by improving the capital structure of the company.
Paraphrase This Document
Need a fresh take? Get an instant paraphrase of this document with our AI Paraphraser
7
ACCOUNTING FOR MANAGERS
Reference
Atieh, S.H., 2014. Liquidity Analysis Using Cash Flow Ratios as Compared to Traditional Ratios
in the Pharmaceutical Sector in Jordan. International journal of Financial research, 5(3), p.146.
Carraher, S. and Van Auken, H., 2013. The use of financial statements for decision making by
small firms. Journal of Small Business & Entrepreneurship, 26(3), pp.323-336.
David Mc A, B., 2013. Service quality and customer satisfaction in the airline industry: A
comparison between legacy airlines and low-cost airlines. American Journal of Tourism
Research, 2(1), pp.67-77.
Delen, D., Kuzey, C. and Uyar, A., 2013. Measuring firm performance using financial ratios: A
decision tree approach. Expert Systems with Applications, 40(10), pp.3970-3983.
Investors | Qantas. (2018). Qantas.com. Retrieved 31 October 2018, from
https://www.qantas.com/travel/airlines/investors/global/en
Konchitchki, Y. and Patatoukas, P.N., 2013. Taking the pulse of the real economy using
financial statement analysis: Implications for macro forecasting and stock valuation. The
Accounting Review, 89(2), pp.669-694.
Morrell, P.S., 2013. Airline finance. Ashgate Publishing, Ltd..
Rosenstein, D.E., 2013. The changing low-cost airline model: An analysis of spirit airlines.
Williams, G., 2017. The airline industry and the impact of deregulation. Routledge.
1 out of 8
Related Documents


Your All-in-One AI-Powered Toolkit for Academic Success.
+13062052269
info@desklib.com
Available 24*7 on WhatsApp / Email
![[object Object]](/_next/static/media/star-bottom.7253800d.svg)
Unlock your academic potential
Copyright © 2020–2026 A2Z Services. All Rights Reserved. Developed and managed by ZUCOL.