McDonald's Expansion: Financial Plan and Analysis Report
VerifiedAdded on 2020/11/12
|14
|4324
|54
Report
AI Summary
This report provides a detailed financial analysis of McDonald's expansion plans in Coventry High Street. It includes an overview of the company's vision and mission, followed by a comprehensive financial plan. The financial plan encompasses breakeven analysis for burgers and beverages, projected profit and loss statements, cash flow projections, and balance sheets for three years (2018-2020). The analysis also includes key financial ratios to assess the financial health and performance of the expansion. The report aims to forecast financial requirements and operational changes necessary for successful business growth, providing valuable insights into the financial feasibility and potential profitability of the expansion project. The report also contains interpretation of data, and the financial statements included are the income statement, cash flow statement, and balance sheet.
FINANCE IN
MANAGEMENT AND
LEADERSHIP
MANAGEMENT AND
LEADERSHIP
Paraphrase This Document
Need a fresh take? Get an instant paraphrase of this document with our AI Paraphraser
TABLE OF CONTENTS
INTRODUCTION...........................................................................................................................1
Overview................................................................................................................................1
Vision and Mission.................................................................................................................1
FINANCIAL PLAN.........................................................................................................................2
Breakeven Analysis................................................................................................................2
Projected Profit and Loss........................................................................................................4
Projected Cash flow................................................................................................................5
Projected Balance sheet..........................................................................................................7
Financial ratios.......................................................................................................................8
CONCLUSION..............................................................................................................................11
REFERENCES..............................................................................................................................12
INTRODUCTION
Expansion and developing newer ideas are main perceptions which have been used by
various organisations with motive of creating new opportunities as well as Improving business
on new platform. It enhances the operational activities as well as performance of entity in large
scale. In the present report there has been discussion based on expanding the McDonald’s
business in Coventry High Street. Along, with this there will be discussion based on various
financial requirements and changes in operations which can be needful in forecasting cash
requirements.
Overview
McDonald’s has been known as world’s largest food chain restaurant which serves in
many countries or locations. The satisfaction it brings to consumers are based on convenience in
cost as well as quality. The large varieties of burgers as well as various fast food dishes has been
presented by McDonald’s with considering proper quality of products (Chen and et.al., 2018). In
approach with same firm plans to make expansion of its operations which comprises of various
processes such as serving varieties of burgers, beverages and various fast food dishes.
Managerial professionals have been thought about making expansion of operations which
will be helpful in leading firm on right direction. They have selected Coventry High street as a
new location which has been analysed as the most convenient and profitable area for
McDonald’s to have successful business (Easton and Monahan, 2016). The motive of industry is
for serving students, workers and local citizens in location with good food quality as well as with
lower prices.
Vision and Mission
In terms of analysing objectives and motive of business on which it can be said that there will
be need of having adequate operational increments as well as development of brand image in the
market (Ruginski and et.al., 2016). Considering the most convenient prices which will be
charged by McDonald’s on its food and beverages with the motive of having higher sales in each
period. Therefore, expansion of operations will lead firm in widening operational area as well as
generating adequate revenue through activities. There has been various objective which have
been undertaken by the professionals such as:
1
⊘ This is a preview!⊘
Do you want full access?
Subscribe today to unlock all pages.
Trusted by 1+ million students worldwide
Developing good consumer’s relationship which will be beneficial in retaining them as
well as rising the level of sales in each year.
Increasing profitability of firm that will be adequate and helpful as per meeting the goals
as well as retaining earning for better financial strength.
Satisfying the large number of buyers with convenient costs, prices and location of
operations.
FINANCIAL PLAN
As per making qualitative development and rise in the operational level in business there
will be need of making effective operational efficiency and gains (Xu and Tang, 2015). It
comprises execution of all the transactional activities as well as management of funds in the
right direction that will be helpful in managing issues and various activities of McDonald’s.
Thus, as per analysing the feasibility and capabilities of firm in meeting the debts on the right
time there will be estimation of various financials in upcoming 3 years. However, with respect to
analyse strength of firm there will be determination of break even analysis, balance sheet,
income statement, cash flow statement and financial analysis.
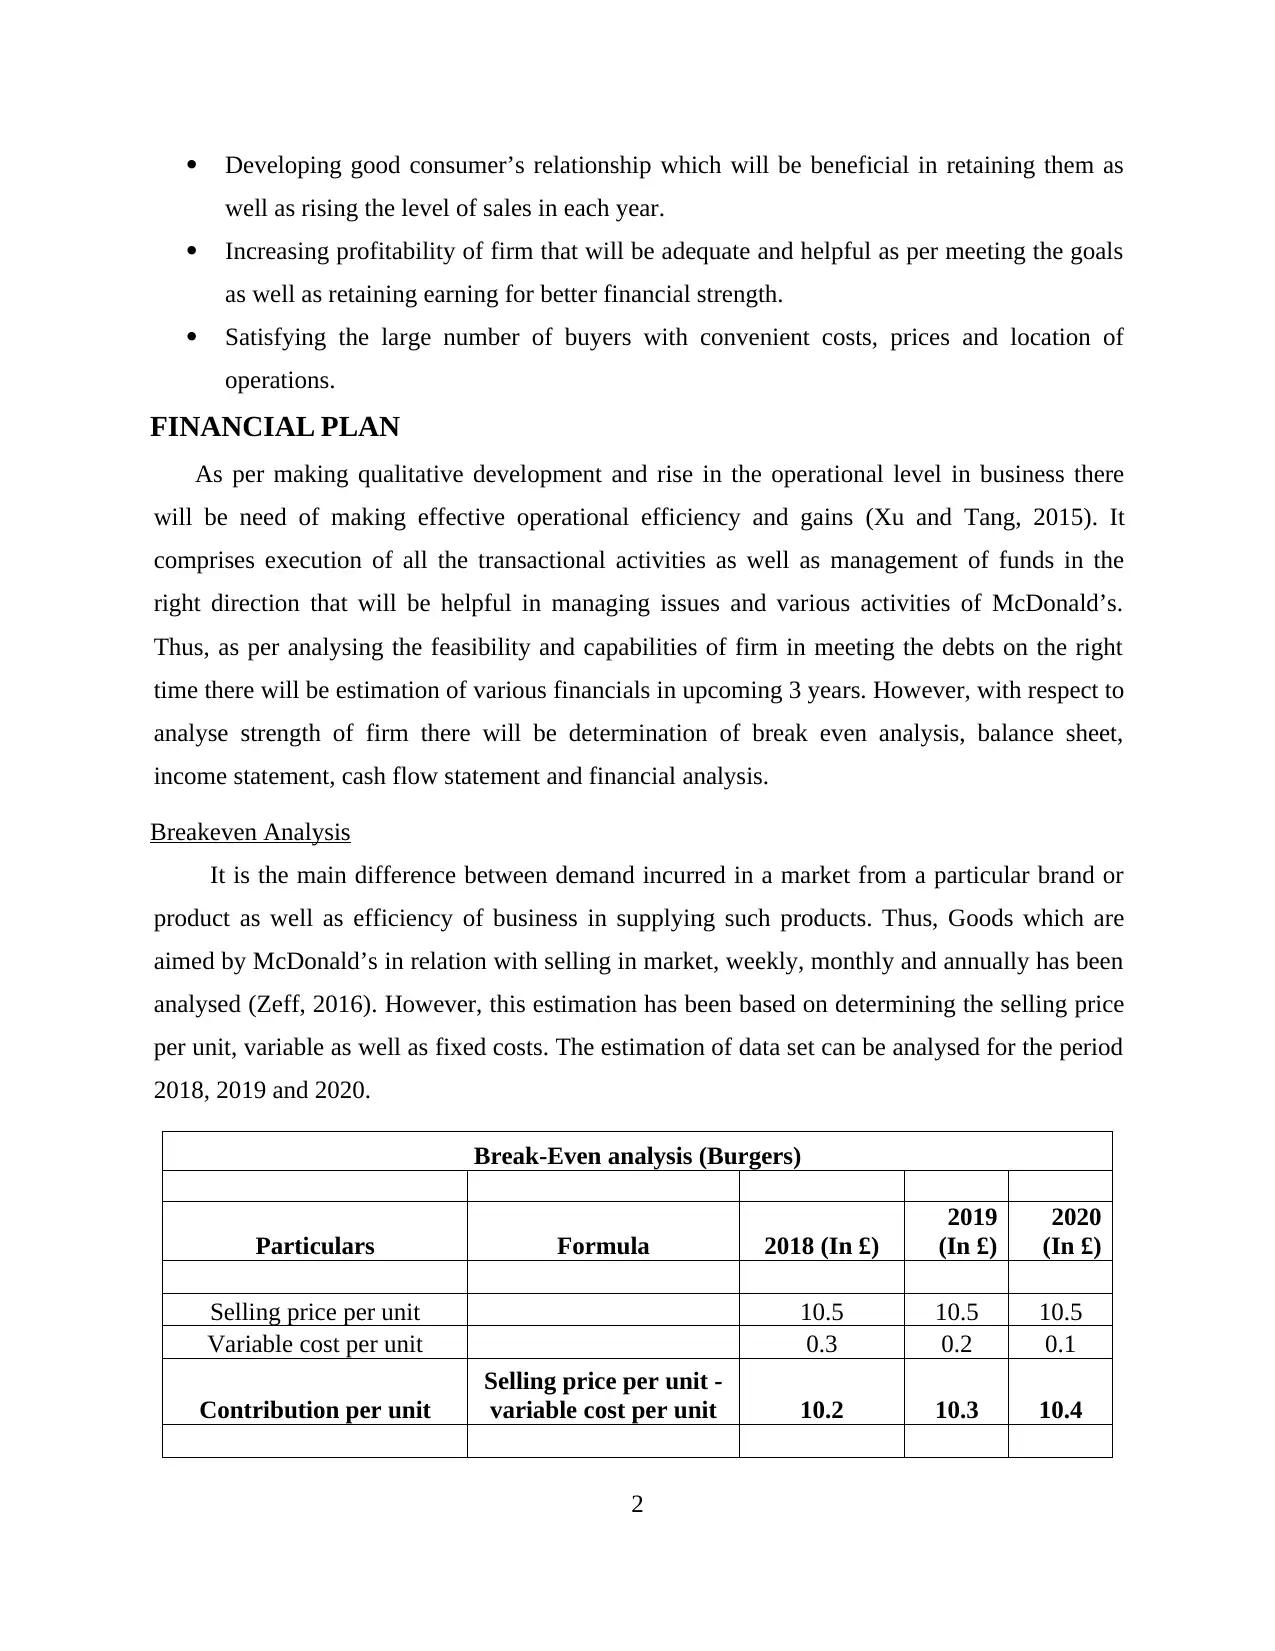
Breakeven Analysis
It is the main difference between demand incurred in a market from a particular brand or
product as well as efficiency of business in supplying such products. Thus, Goods which are
aimed by McDonald’s in relation with selling in market, weekly, monthly and annually has been
analysed (Zeff, 2016). However, this estimation has been based on determining the selling price
per unit, variable as well as fixed costs. The estimation of data set can be analysed for the period
2018, 2019 and 2020.
Break-Even analysis (Burgers)
Particulars Formula 2018 (In £)
2019
(In £)
2020
(In £)
Selling price per unit 10.5 10.5 10.5
Variable cost per unit 0.3 0.2 0.1
Contribution per unit
Selling price per unit -
variable cost per unit 10.2 10.3 10.4
2
well as rising the level of sales in each year.
Increasing profitability of firm that will be adequate and helpful as per meeting the goals
as well as retaining earning for better financial strength.
Satisfying the large number of buyers with convenient costs, prices and location of
operations.
FINANCIAL PLAN
As per making qualitative development and rise in the operational level in business there
will be need of making effective operational efficiency and gains (Xu and Tang, 2015). It
comprises execution of all the transactional activities as well as management of funds in the
right direction that will be helpful in managing issues and various activities of McDonald’s.
Thus, as per analysing the feasibility and capabilities of firm in meeting the debts on the right
time there will be estimation of various financials in upcoming 3 years. However, with respect to
analyse strength of firm there will be determination of break even analysis, balance sheet,
income statement, cash flow statement and financial analysis.
Breakeven Analysis
It is the main difference between demand incurred in a market from a particular brand or
product as well as efficiency of business in supplying such products. Thus, Goods which are
aimed by McDonald’s in relation with selling in market, weekly, monthly and annually has been
analysed (Zeff, 2016). However, this estimation has been based on determining the selling price
per unit, variable as well as fixed costs. The estimation of data set can be analysed for the period
2018, 2019 and 2020.
Break-Even analysis (Burgers)
Particulars Formula 2018 (In £)
2019
(In £)
2020
(In £)
Selling price per unit 10.5 10.5 10.5
Variable cost per unit 0.3 0.2 0.1
Contribution per unit
Selling price per unit -
variable cost per unit 10.2 10.3 10.4
2
Paraphrase This Document
Need a fresh take? Get an instant paraphrase of this document with our AI Paraphraser
Fixed cost 5000 5000 5000
BEP (in units)
Fixed cost /
contribution per unit 490 485 481
BEP (in value or
monetary terms)
BEP (in units) * selling
price per unit 5147.058824 5097.09 5048.08
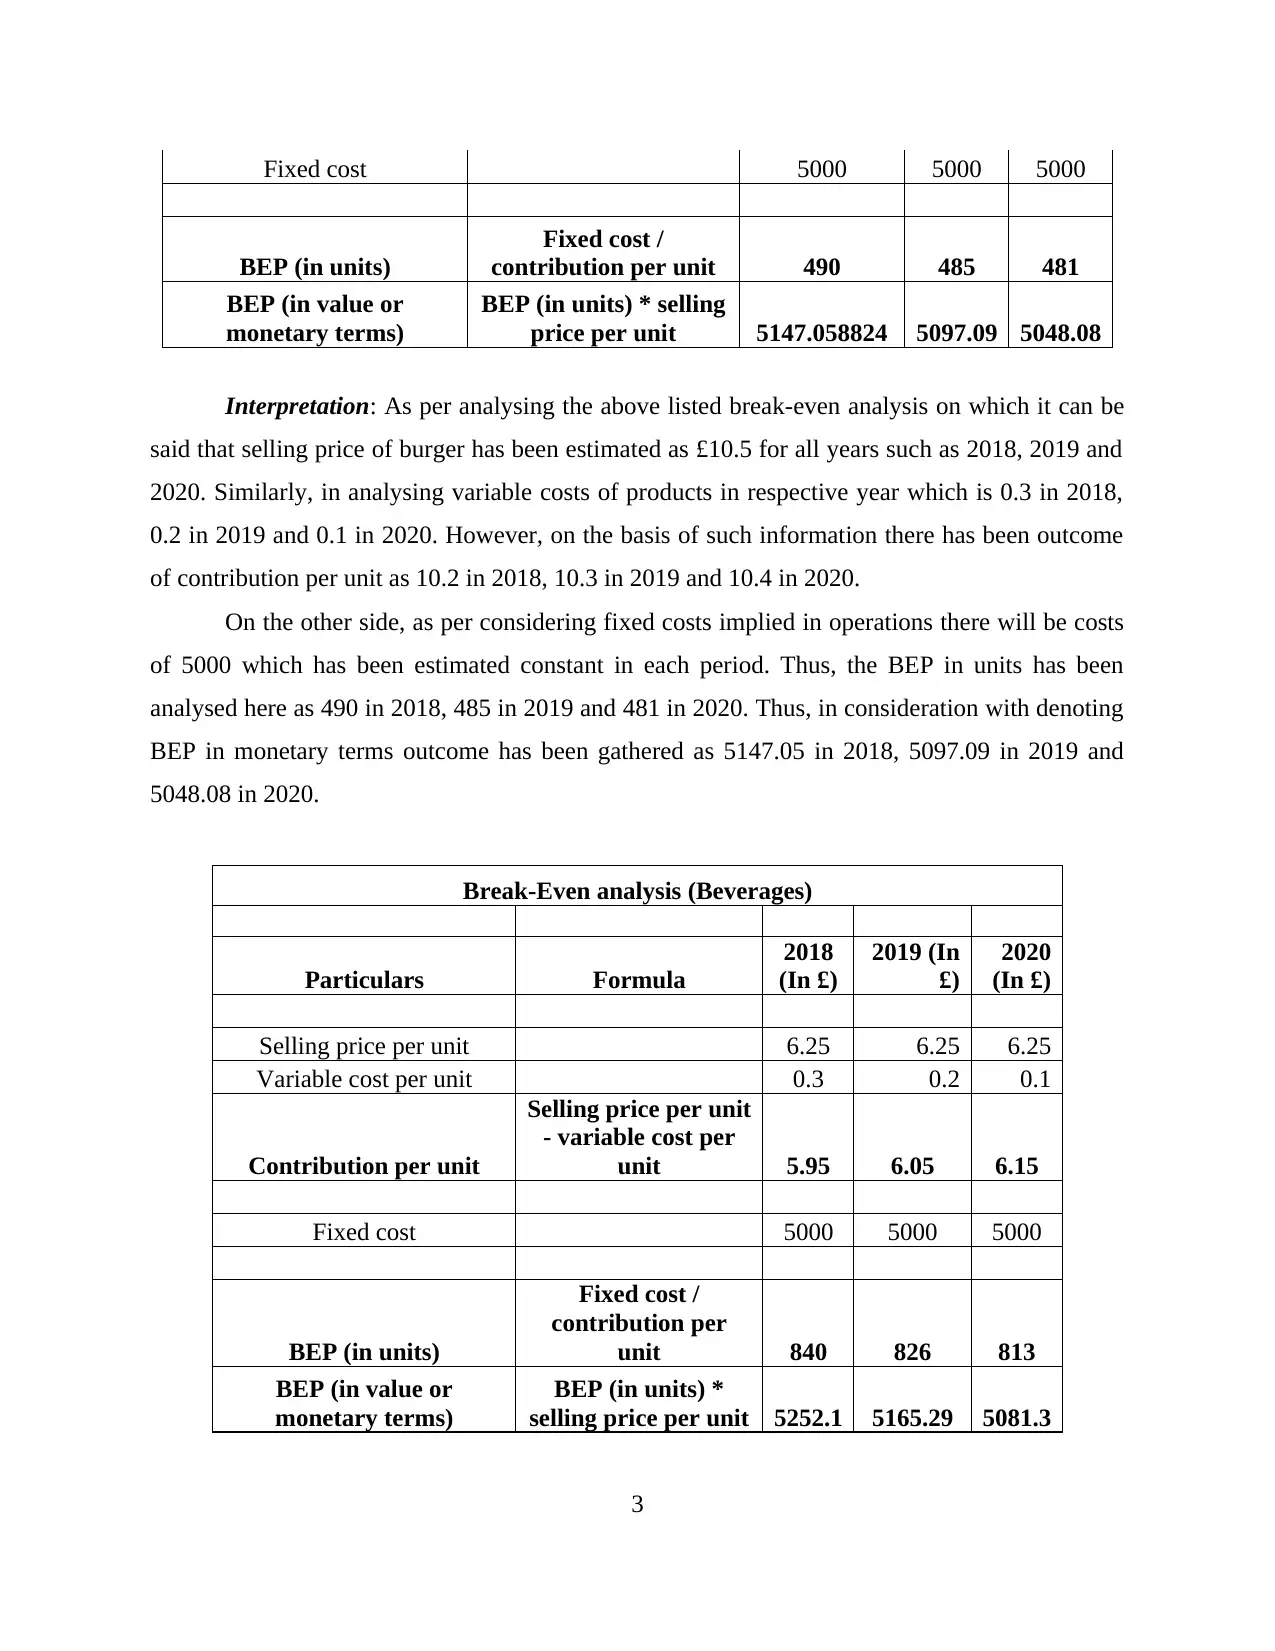
Interpretation: As per analysing the above listed break-even analysis on which it can be
said that selling price of burger has been estimated as £10.5 for all years such as 2018, 2019 and
2020. Similarly, in analysing variable costs of products in respective year which is 0.3 in 2018,
0.2 in 2019 and 0.1 in 2020. However, on the basis of such information there has been outcome
of contribution per unit as 10.2 in 2018, 10.3 in 2019 and 10.4 in 2020.
On the other side, as per considering fixed costs implied in operations there will be costs
of 5000 which has been estimated constant in each period. Thus, the BEP in units has been
analysed here as 490 in 2018, 485 in 2019 and 481 in 2020. Thus, in consideration with denoting
BEP in monetary terms outcome has been gathered as 5147.05 in 2018, 5097.09 in 2019 and
5048.08 in 2020.
Break-Even analysis (Beverages)
Particulars Formula
2018
(In £)
2019 (In
£)
2020
(In £)
Selling price per unit 6.25 6.25 6.25
Variable cost per unit 0.3 0.2 0.1
Contribution per unit
Selling price per unit
- variable cost per
unit 5.95 6.05 6.15
Fixed cost 5000 5000 5000
BEP (in units)
Fixed cost /
contribution per
unit 840 826 813
BEP (in value or
monetary terms)
BEP (in units) *
selling price per unit 5252.1 5165.29 5081.3
3
BEP (in units)
Fixed cost /
contribution per unit 490 485 481
BEP (in value or
monetary terms)
BEP (in units) * selling
price per unit 5147.058824 5097.09 5048.08
Interpretation: As per analysing the above listed break-even analysis on which it can be
said that selling price of burger has been estimated as £10.5 for all years such as 2018, 2019 and
2020. Similarly, in analysing variable costs of products in respective year which is 0.3 in 2018,
0.2 in 2019 and 0.1 in 2020. However, on the basis of such information there has been outcome
of contribution per unit as 10.2 in 2018, 10.3 in 2019 and 10.4 in 2020.
On the other side, as per considering fixed costs implied in operations there will be costs
of 5000 which has been estimated constant in each period. Thus, the BEP in units has been
analysed here as 490 in 2018, 485 in 2019 and 481 in 2020. Thus, in consideration with denoting
BEP in monetary terms outcome has been gathered as 5147.05 in 2018, 5097.09 in 2019 and
5048.08 in 2020.
Break-Even analysis (Beverages)
Particulars Formula
2018
(In £)
2019 (In
£)
2020
(In £)
Selling price per unit 6.25 6.25 6.25
Variable cost per unit 0.3 0.2 0.1
Contribution per unit
Selling price per unit
- variable cost per
unit 5.95 6.05 6.15
Fixed cost 5000 5000 5000
BEP (in units)
Fixed cost /
contribution per
unit 840 826 813
BEP (in value or
monetary terms)
BEP (in units) *
selling price per unit 5252.1 5165.29 5081.3
3
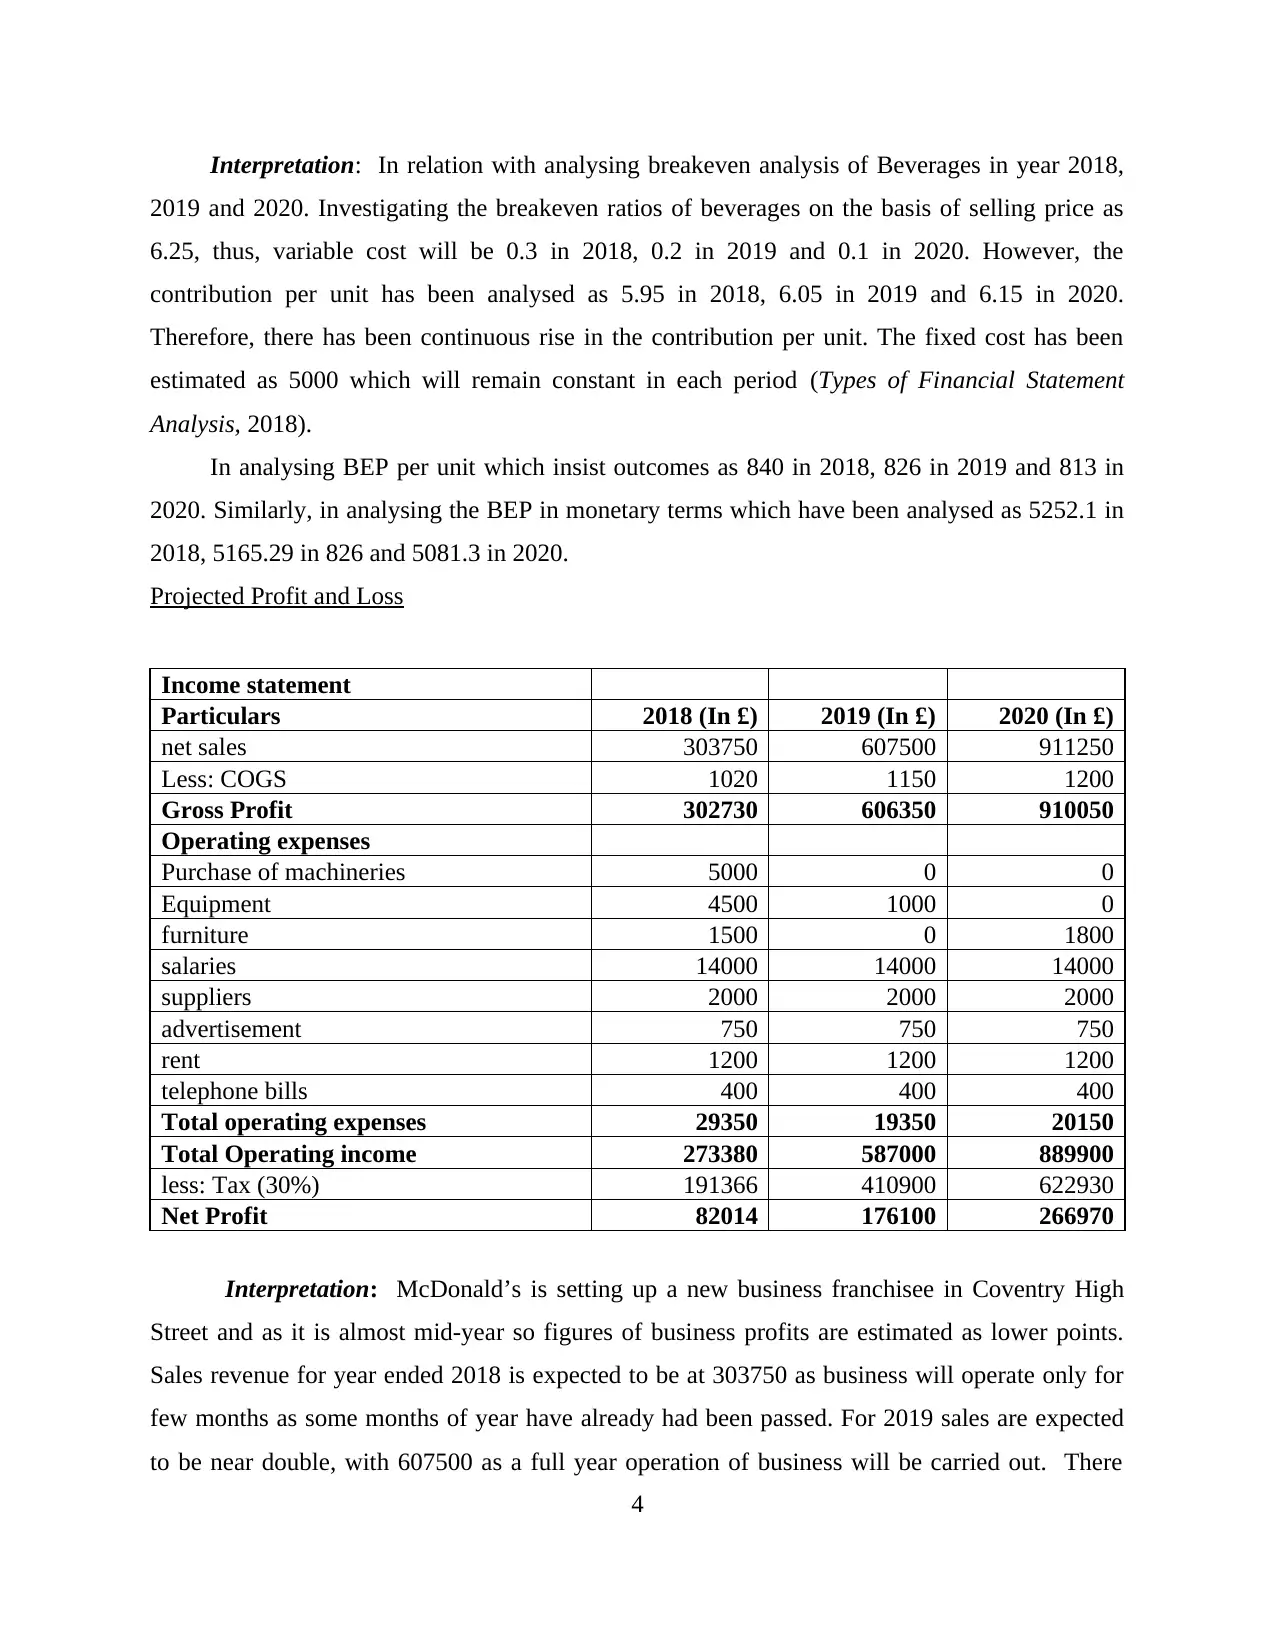
Interpretation: In relation with analysing breakeven analysis of Beverages in year 2018,
2019 and 2020. Investigating the breakeven ratios of beverages on the basis of selling price as
6.25, thus, variable cost will be 0.3 in 2018, 0.2 in 2019 and 0.1 in 2020. However, the
contribution per unit has been analysed as 5.95 in 2018, 6.05 in 2019 and 6.15 in 2020.
Therefore, there has been continuous rise in the contribution per unit. The fixed cost has been
estimated as 5000 which will remain constant in each period (Types of Financial Statement
Analysis, 2018).
In analysing BEP per unit which insist outcomes as 840 in 2018, 826 in 2019 and 813 in
2020. Similarly, in analysing the BEP in monetary terms which have been analysed as 5252.1 in
2018, 5165.29 in 826 and 5081.3 in 2020.
Projected Profit and Loss
Income statement
Particulars 2018 (In £) 2019 (In £) 2020 (In £)
net sales 303750 607500 911250
Less: COGS 1020 1150 1200
Gross Profit 302730 606350 910050
Operating expenses
Purchase of machineries 5000 0 0
Equipment 4500 1000 0
furniture 1500 0 1800
salaries 14000 14000 14000
suppliers 2000 2000 2000
advertisement 750 750 750
rent 1200 1200 1200
telephone bills 400 400 400
Total operating expenses 29350 19350 20150
Total Operating income 273380 587000 889900
less: Tax (30%) 191366 410900 622930
Net Profit 82014 176100 266970
Interpretation: McDonald’s is setting up a new business franchisee in Coventry High
Street and as it is almost mid-year so figures of business profits are estimated as lower points.
Sales revenue for year ended 2018 is expected to be at 303750 as business will operate only for
few months as some months of year have already had been passed. For 2019 sales are expected
to be near double, with 607500 as a full year operation of business will be carried out. There
4
⊘ This is a preview!⊘
Do you want full access?
Subscribe today to unlock all pages.
Trusted by 1+ million students worldwide
will be an increase in cost of goods sold but continuous efforts and measurements will be taken
to have a control over administrative and operational cost so percentage increase in this cost is
lesser than percentage increase in sales revenue (Barron, Byard and Yu, 2017). For year end
2020 sales will rise with higher pace and are expected to reach at 911250. in this year there will
be no purchase of machinery, equipment or furniture. This will reduce the operating expenses of
business, hence an increment in net profits are estimated at a better rate.
For the year end 2018 earnings of business is expecting to earn net profits of 82014 with total
expense of 221736, and in this initial revenue expenses are estimated for purchase of machinery,
equipment and furniture. For 2019 profits are estimated to rise to 176100, as full year sales of
foods and beverages will be made so revenue will be collected for whole year, with sales
revenue, expenses related to investment for store will also reduce, as only a machinery of 1000 is
purchased in this year, so a good net profit margin is expected to earn in 2019.
With an increase in sales revenue the tax will also increase, which will increase their
operating expense so to compensate this a significant control over operating cost will be maintain
profitability of business at higher percentage.
Projected Cash flow
Cash flow statement
Particulars
Initial
Investment
(In £)
2018 (In
£)
2019 (In
£)
2020 (In
£)
Product Burger Burger Burger
% of sales made in a year 50% 67%
total units sold 20000 40000 60000
Average cost of selling 10.5 10.5 10.5
Total revenue from
burger 210000 420000 630000
Product Beverages Beverages Beverages
% of sales made in a year 50% 67%
total units sold 15000 30000 45000
Average cost of selling 6.25 6.25 6.25
Total revenue from
beverages 93750 187500 281250
Total revenue 303750 607500 911250
5
Paraphrase This Document
Need a fresh take? Get an instant paraphrase of this document with our AI Paraphraser
Operating expenses
Purchase of machineries 5000 0 0 0
Equipment 4500 0 1000 0
furniture 1500 0 0 1800
salaries 14000 14000 14000
suppliers 2000 2000 2000
advertisement 750 750 750
rent 1200 1200 1200
telephone bills 400 400 400
Total cash outflows 11000 18350 19350 20150
Net cash flows -11000 285400 588150 891100
Opening balance of cash -11000 439000 724400 1312550
initial capital 450000
closing balance of cash 439000 724400 1312550 2203650
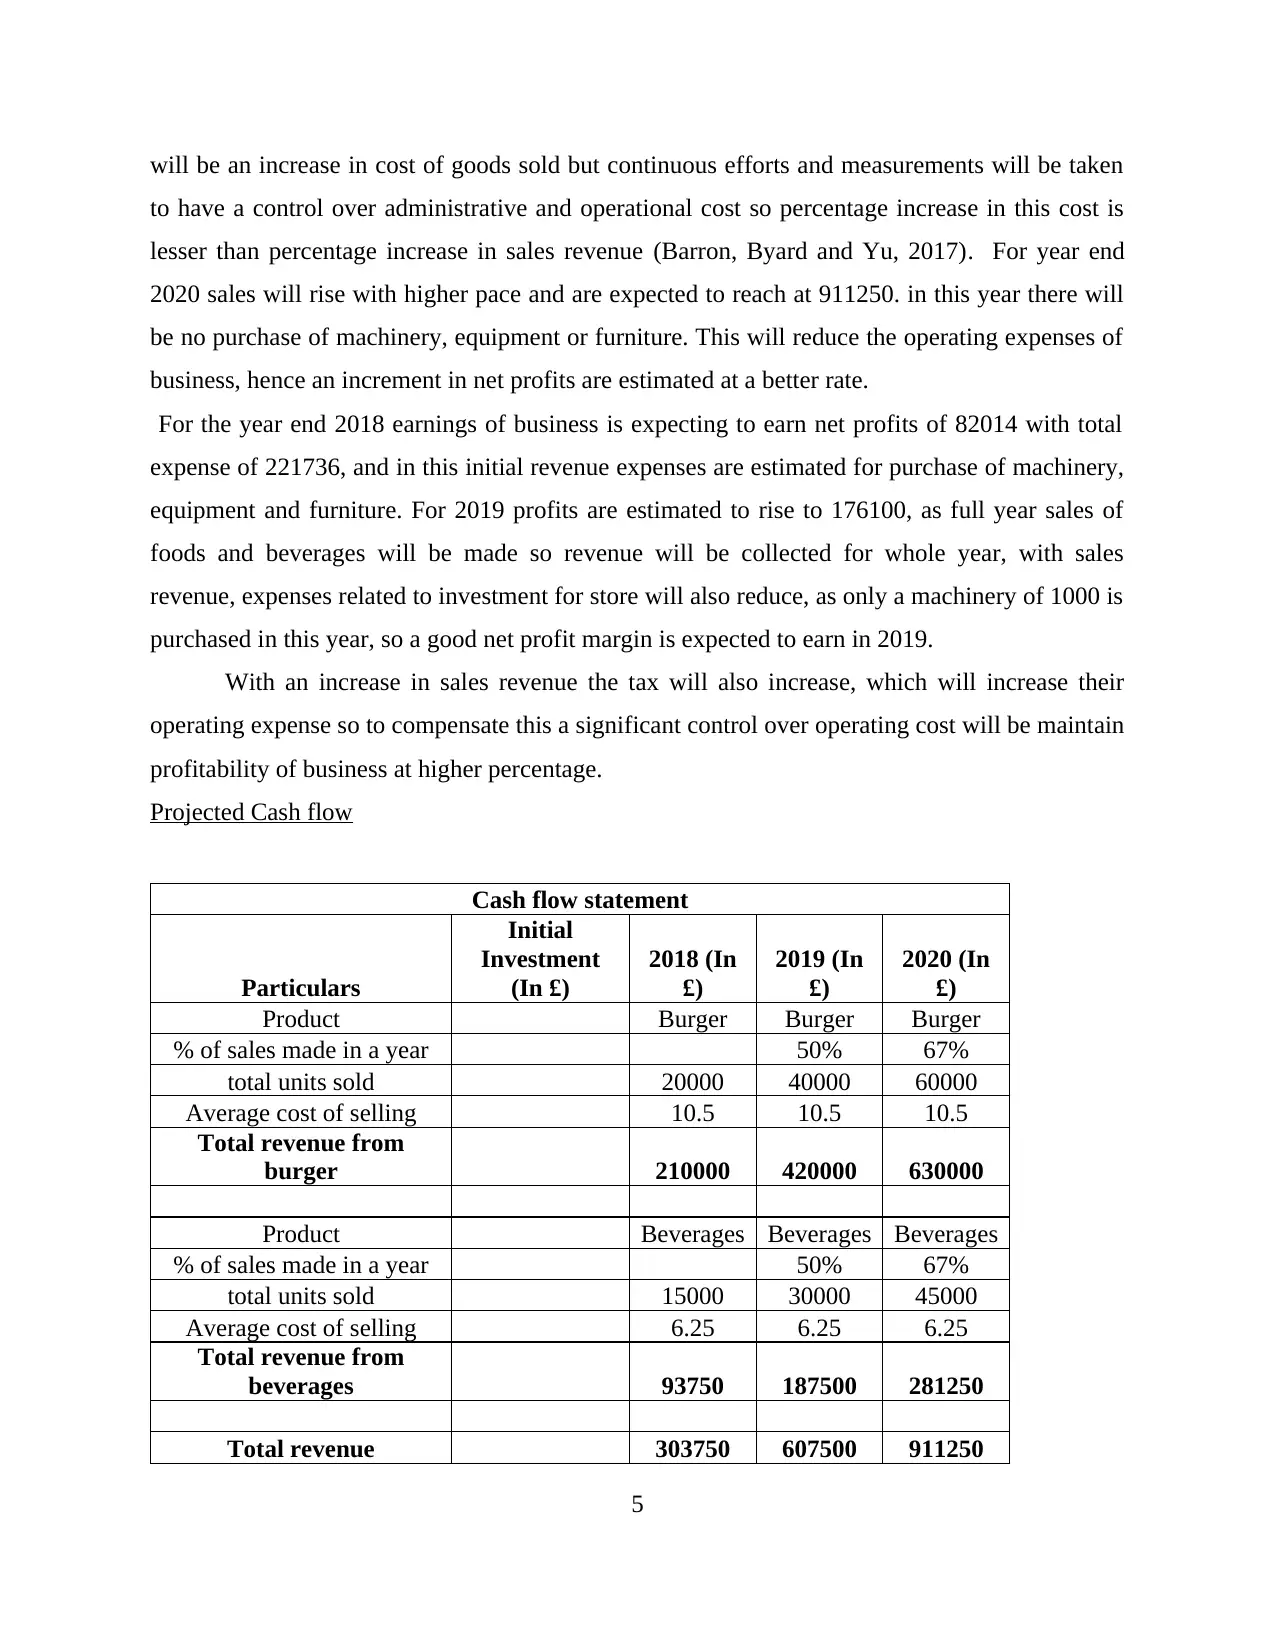
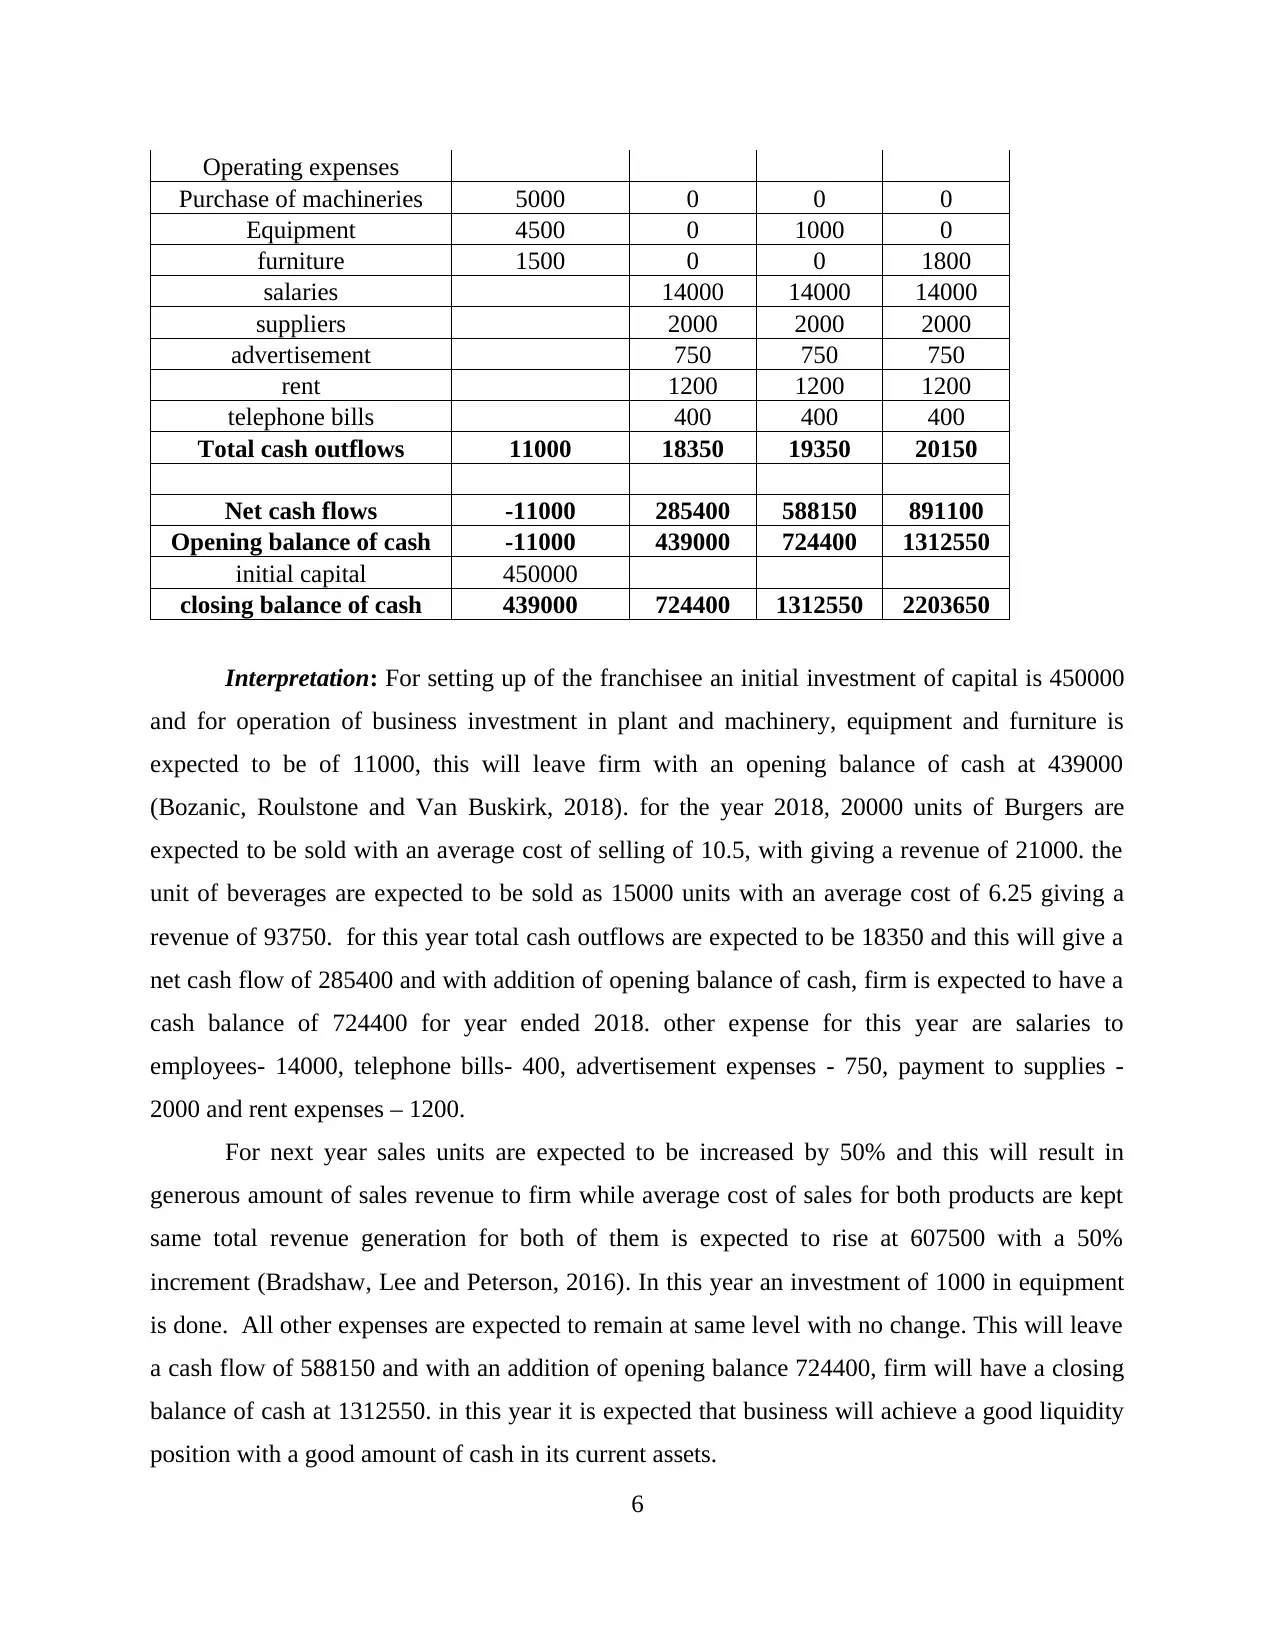
Interpretation: For setting up of the franchisee an initial investment of capital is 450000
and for operation of business investment in plant and machinery, equipment and furniture is
expected to be of 11000, this will leave firm with an opening balance of cash at 439000
(Bozanic, Roulstone and Van Buskirk, 2018). for the year 2018, 20000 units of Burgers are
expected to be sold with an average cost of selling of 10.5, with giving a revenue of 21000. the
unit of beverages are expected to be sold as 15000 units with an average cost of 6.25 giving a
revenue of 93750. for this year total cash outflows are expected to be 18350 and this will give a
net cash flow of 285400 and with addition of opening balance of cash, firm is expected to have a
cash balance of 724400 for year ended 2018. other expense for this year are salaries to
employees- 14000, telephone bills- 400, advertisement expenses - 750, payment to supplies -
2000 and rent expenses – 1200.
For next year sales units are expected to be increased by 50% and this will result in
generous amount of sales revenue to firm while average cost of sales for both products are kept
same total revenue generation for both of them is expected to rise at 607500 with a 50%
increment (Bradshaw, Lee and Peterson, 2016). In this year an investment of 1000 in equipment
is done. All other expenses are expected to remain at same level with no change. This will leave
a cash flow of 588150 and with an addition of opening balance 724400, firm will have a closing
balance of cash at 1312550. in this year it is expected that business will achieve a good liquidity
position with a good amount of cash in its current assets.
6
Purchase of machineries 5000 0 0 0
Equipment 4500 0 1000 0
furniture 1500 0 0 1800
salaries 14000 14000 14000
suppliers 2000 2000 2000
advertisement 750 750 750
rent 1200 1200 1200
telephone bills 400 400 400
Total cash outflows 11000 18350 19350 20150
Net cash flows -11000 285400 588150 891100
Opening balance of cash -11000 439000 724400 1312550
initial capital 450000
closing balance of cash 439000 724400 1312550 2203650
Interpretation: For setting up of the franchisee an initial investment of capital is 450000
and for operation of business investment in plant and machinery, equipment and furniture is
expected to be of 11000, this will leave firm with an opening balance of cash at 439000
(Bozanic, Roulstone and Van Buskirk, 2018). for the year 2018, 20000 units of Burgers are
expected to be sold with an average cost of selling of 10.5, with giving a revenue of 21000. the
unit of beverages are expected to be sold as 15000 units with an average cost of 6.25 giving a
revenue of 93750. for this year total cash outflows are expected to be 18350 and this will give a
net cash flow of 285400 and with addition of opening balance of cash, firm is expected to have a
cash balance of 724400 for year ended 2018. other expense for this year are salaries to
employees- 14000, telephone bills- 400, advertisement expenses - 750, payment to supplies -
2000 and rent expenses – 1200.
For next year sales units are expected to be increased by 50% and this will result in
generous amount of sales revenue to firm while average cost of sales for both products are kept
same total revenue generation for both of them is expected to rise at 607500 with a 50%
increment (Bradshaw, Lee and Peterson, 2016). In this year an investment of 1000 in equipment
is done. All other expenses are expected to remain at same level with no change. This will leave
a cash flow of 588150 and with an addition of opening balance 724400, firm will have a closing
balance of cash at 1312550. in this year it is expected that business will achieve a good liquidity
position with a good amount of cash in its current assets.
6
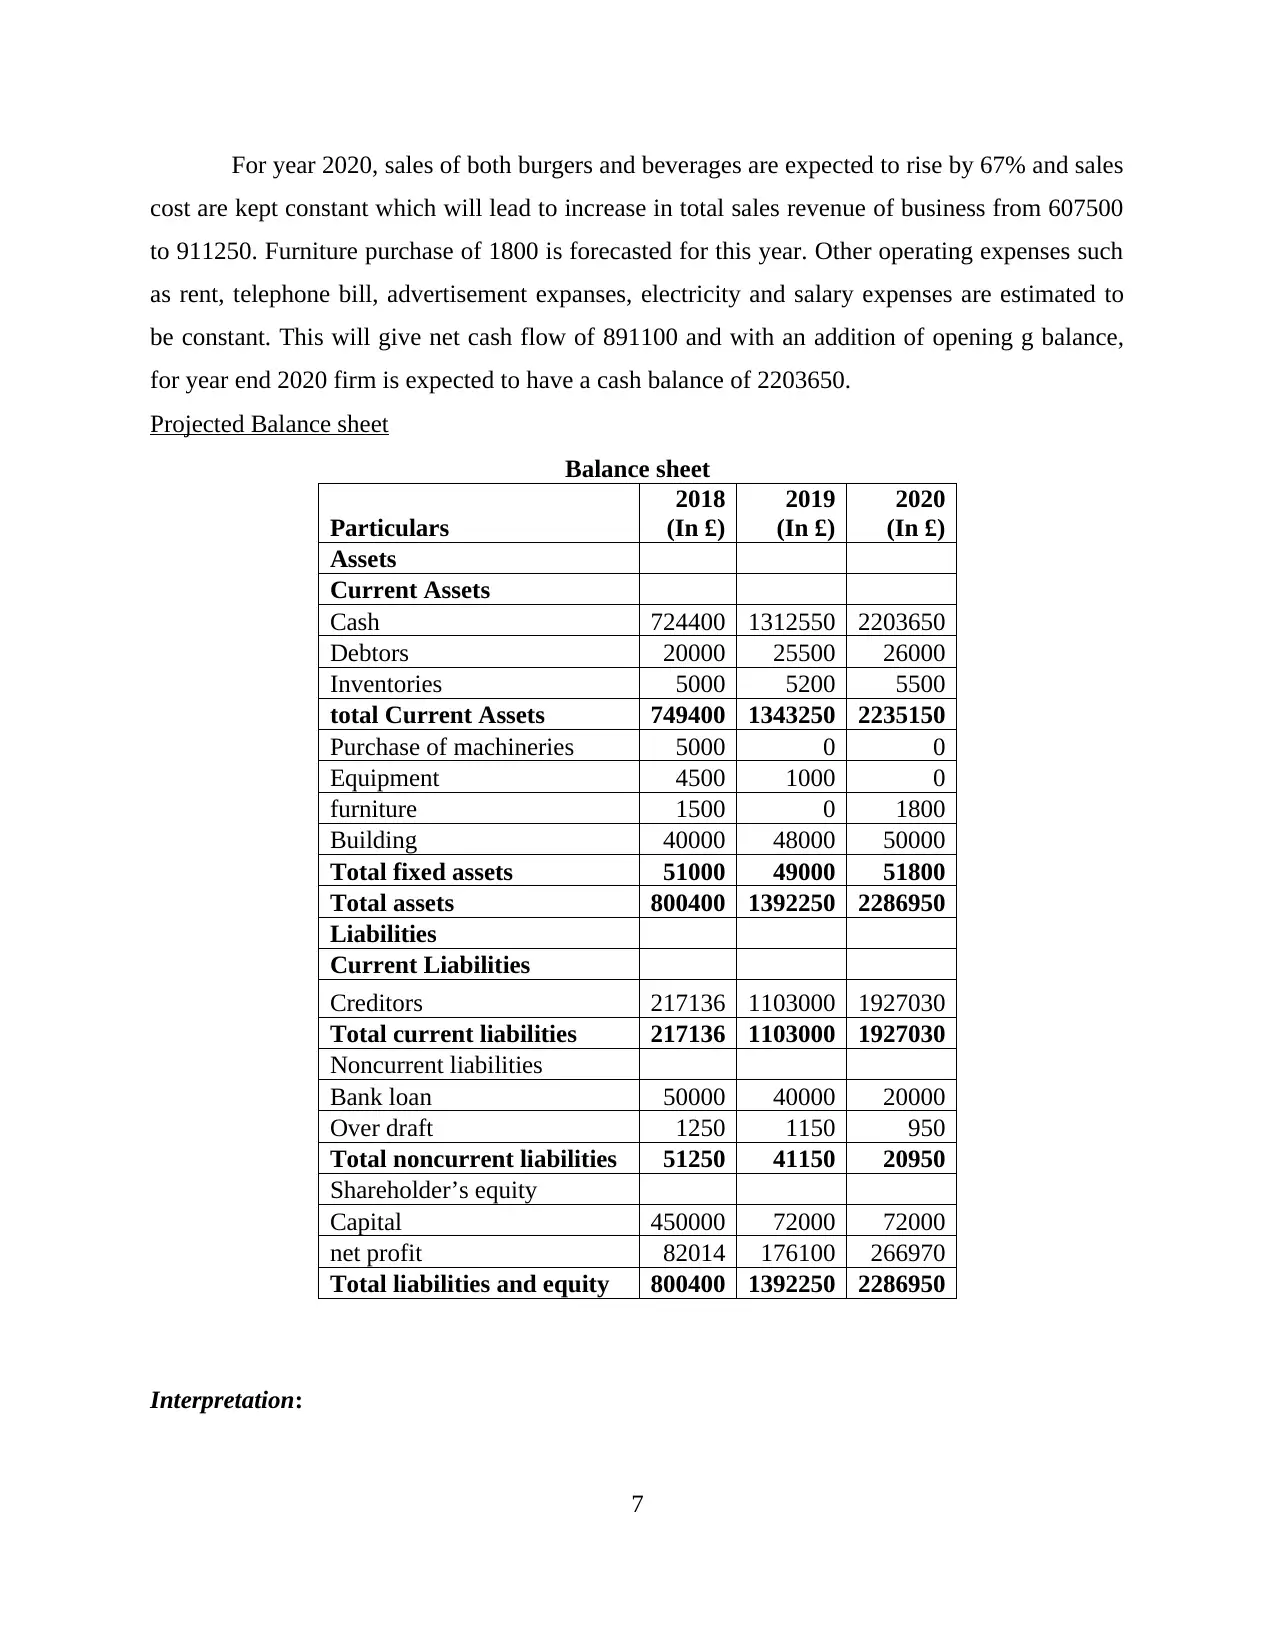
For year 2020, sales of both burgers and beverages are expected to rise by 67% and sales
cost are kept constant which will lead to increase in total sales revenue of business from 607500
to 911250. Furniture purchase of 1800 is forecasted for this year. Other operating expenses such
as rent, telephone bill, advertisement expanses, electricity and salary expenses are estimated to
be constant. This will give net cash flow of 891100 and with an addition of opening g balance,
for year end 2020 firm is expected to have a cash balance of 2203650.
Projected Balance sheet
Balance sheet
Particulars
2018
(In £)
2019
(In £)
2020
(In £)
Assets
Current Assets
Cash 724400 1312550 2203650
Debtors 20000 25500 26000
Inventories 5000 5200 5500
total Current Assets 749400 1343250 2235150
Purchase of machineries 5000 0 0
Equipment 4500 1000 0
furniture 1500 0 1800
Building 40000 48000 50000
Total fixed assets 51000 49000 51800
Total assets 800400 1392250 2286950
Liabilities
Current Liabilities
Creditors 217136 1103000 1927030
Total current liabilities 217136 1103000 1927030
Noncurrent liabilities
Bank loan 50000 40000 20000
Over draft 1250 1150 950
Total noncurrent liabilities 51250 41150 20950
Shareholder’s equity
Capital 450000 72000 72000
net profit 82014 176100 266970
Total liabilities and equity 800400 1392250 2286950
Interpretation:
7
⊘ This is a preview!⊘
Do you want full access?
Subscribe today to unlock all pages.
Trusted by 1+ million students worldwide
Total current assets of franchisee for 2018, is expected to be at 749400, with cash -
724400, debtors - 22000 and inventory -5000. Fixed assets at 51000 with machinery, equipment
and furniture in it, this will give total assets at 800400 (Bratten and et.al., 2016). total current
liabilities are expected to be at 217136 with only creditors in it and non-current liabilities will
have bank loan of 50000 and overdraft limit are forecasted at 1250. all this together will form
total of 51250. Shareholder equity for year 2018 will be 450000 as this is the initial investment
made in business. Net profit and shareholders’ equity will be 127014.
For next year 2019, an increase in cash, debtors and inventory is expected but a major
increment will be in cash and inventory and debtors will increase to 5200 and 25500
respectively. With a purchase of equipment and a building fixed asset will be at 49000. creditors
are expected to increase to 1103000 and loan amount of 10000 will be repaid. Bank overdraft
limit will reduce to 1150. capital will be increased by 27000 and net profit of 176100, total
shareholders’ equity will be at 248100.
in 2020, with a minor increment in debtor by 500, and inventory by 300 and a huge
increment on cash to 2203650, will give current assets of 2235150 (Li and Nwaeze, 2018). with
furniture of 1800 and building of 50000, fixed assets will reach to 51800. creditors are expected
to reach at 1927030, and bank loan will be rapid further with an amount of 20000. bank overdraft
limit is expected to be reduced to 950. with same capital of 72000 and expected net profit of
266970 shareholder equity is forecasted to reach at 338970.
Financial ratios
Financial analysis
Particula
rs
Formu
la
2018
(In £)
Ratio
(in
%)
2019
(In £)
Ratio
(in %)
2020
(In £)
Ratio
(in %)
Profitabil
ity
Net profit
margin
Net
profit
*1
00 82014 0.27
17610
0
0.2898
8 266970
0.2929
7
Net
sales 303750
60750
0 911250
Gross
Profit
Margin
Gross
Profit
*1
00 302730
0.996
64
60635
0
0.9981
1 910050
0.9986
8
Net
sales 303750
60750
0 911250
8
Paraphrase This Document
Need a fresh take? Get an instant paraphrase of this document with our AI Paraphraser
Return on
capital
employed
Total
equity 532014
1.751
49
24810
0 0.4084 338970
0.3719
8
Net
sales 303750
60750
0 911250
Liquidity
ratio
Current
ratio
Current
assets 749400
3.451
29
13432
50
1.2178
2
223515
0
1.1598
9
Current
Liabilit
ies 217136
11030
00
192703
0
Quick
ratio
Current
assets-
invento
ries 744400
3.428
27
13380
50 1.2131
222965
0
1.1570
4
Current
Liabilit
ies 217136
11030
00
192703
0
Efficiency
ratio
Accounts
Receivabl
e turnover
ratio
Net
sales 303750
15.18
75
60750
0
23.823
5 911250
35.048
1
Averag
e
account
s
receiva
ble 20000 25500 26000
Asset
Turnover
ratio
Net
sales 303750
0.379
5
60750
0
0.4363
4 911250
0.3984
6
Averag
e total
assets 800400
13922
50
228695
0
9
Inventory
Turnover
ratio
Cost of
goods
sold 1020 0.204 1150
0.2211
5 1200
0.2181
8
Averag
e
Invento
ries 5000 5200 5500
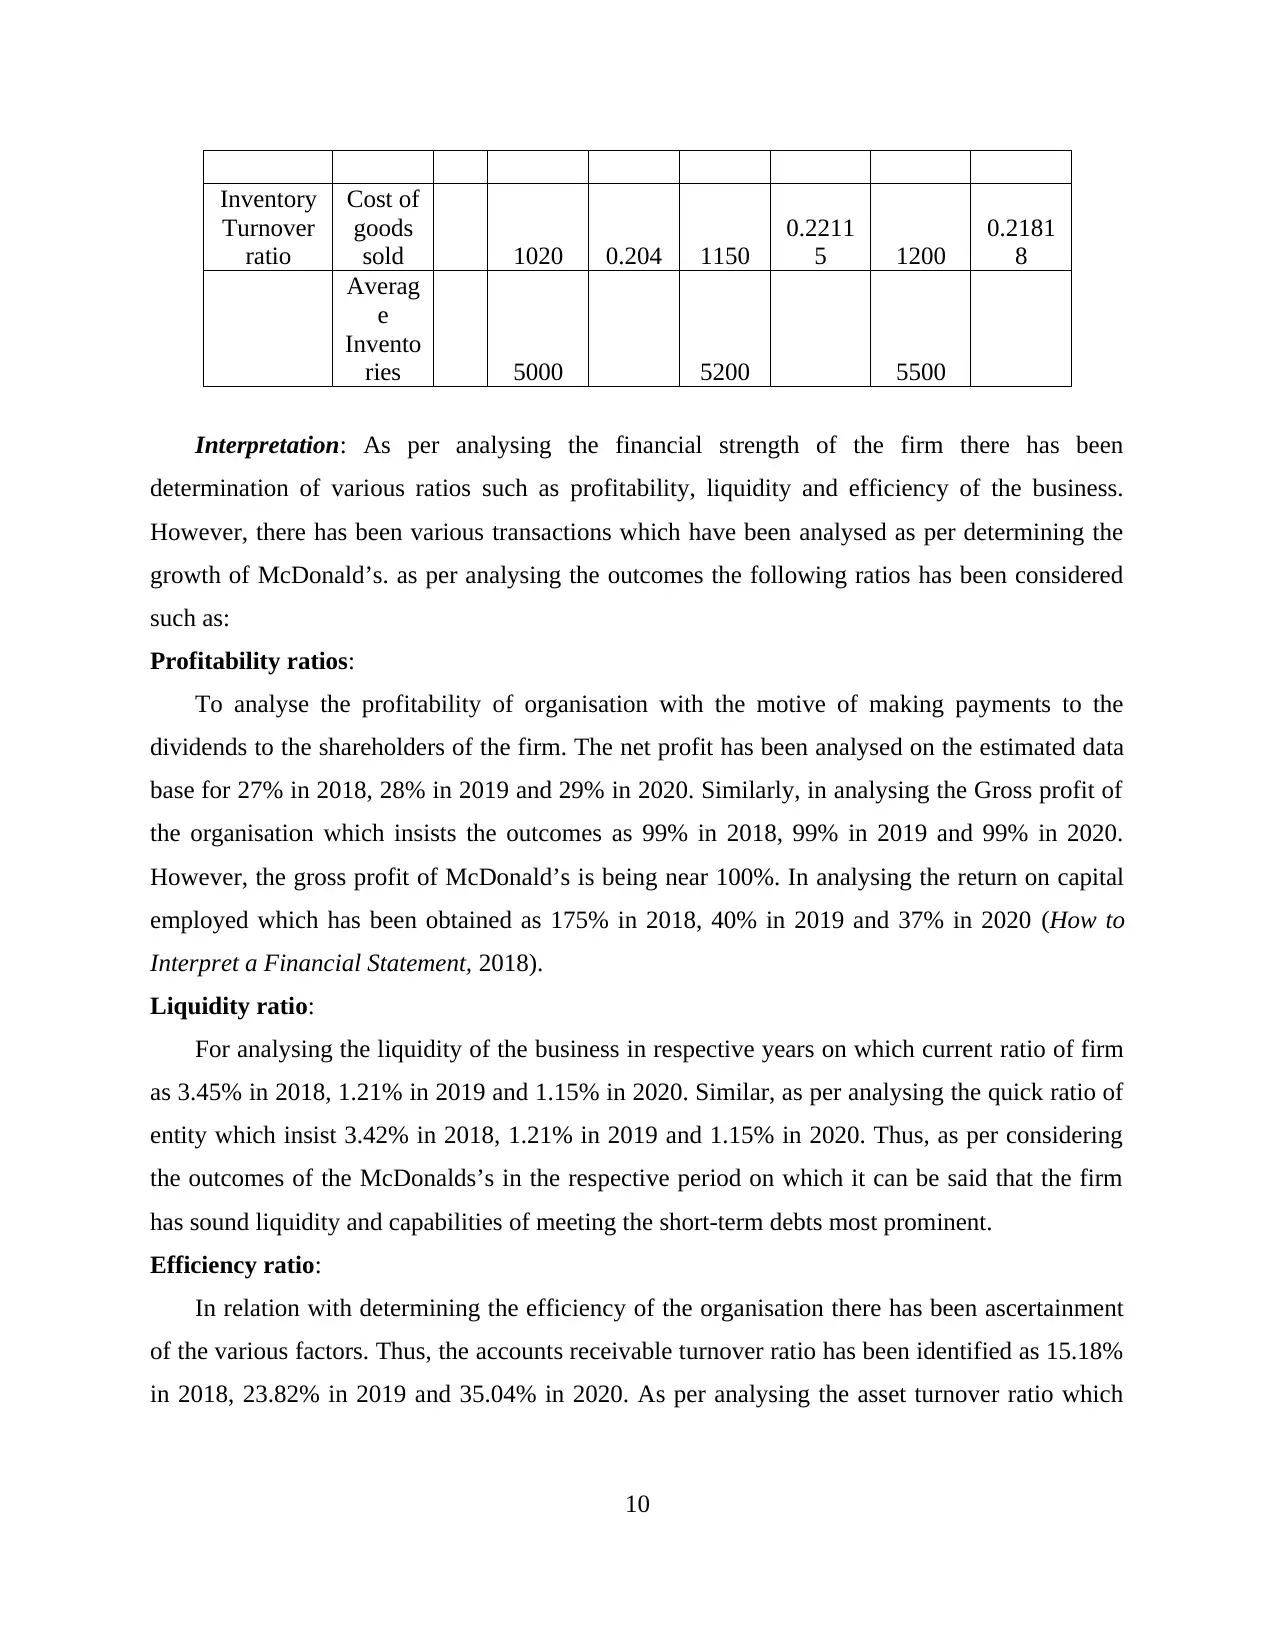
Interpretation: As per analysing the financial strength of the firm there has been
determination of various ratios such as profitability, liquidity and efficiency of the business.
However, there has been various transactions which have been analysed as per determining the
growth of McDonald’s. as per analysing the outcomes the following ratios has been considered
such as:
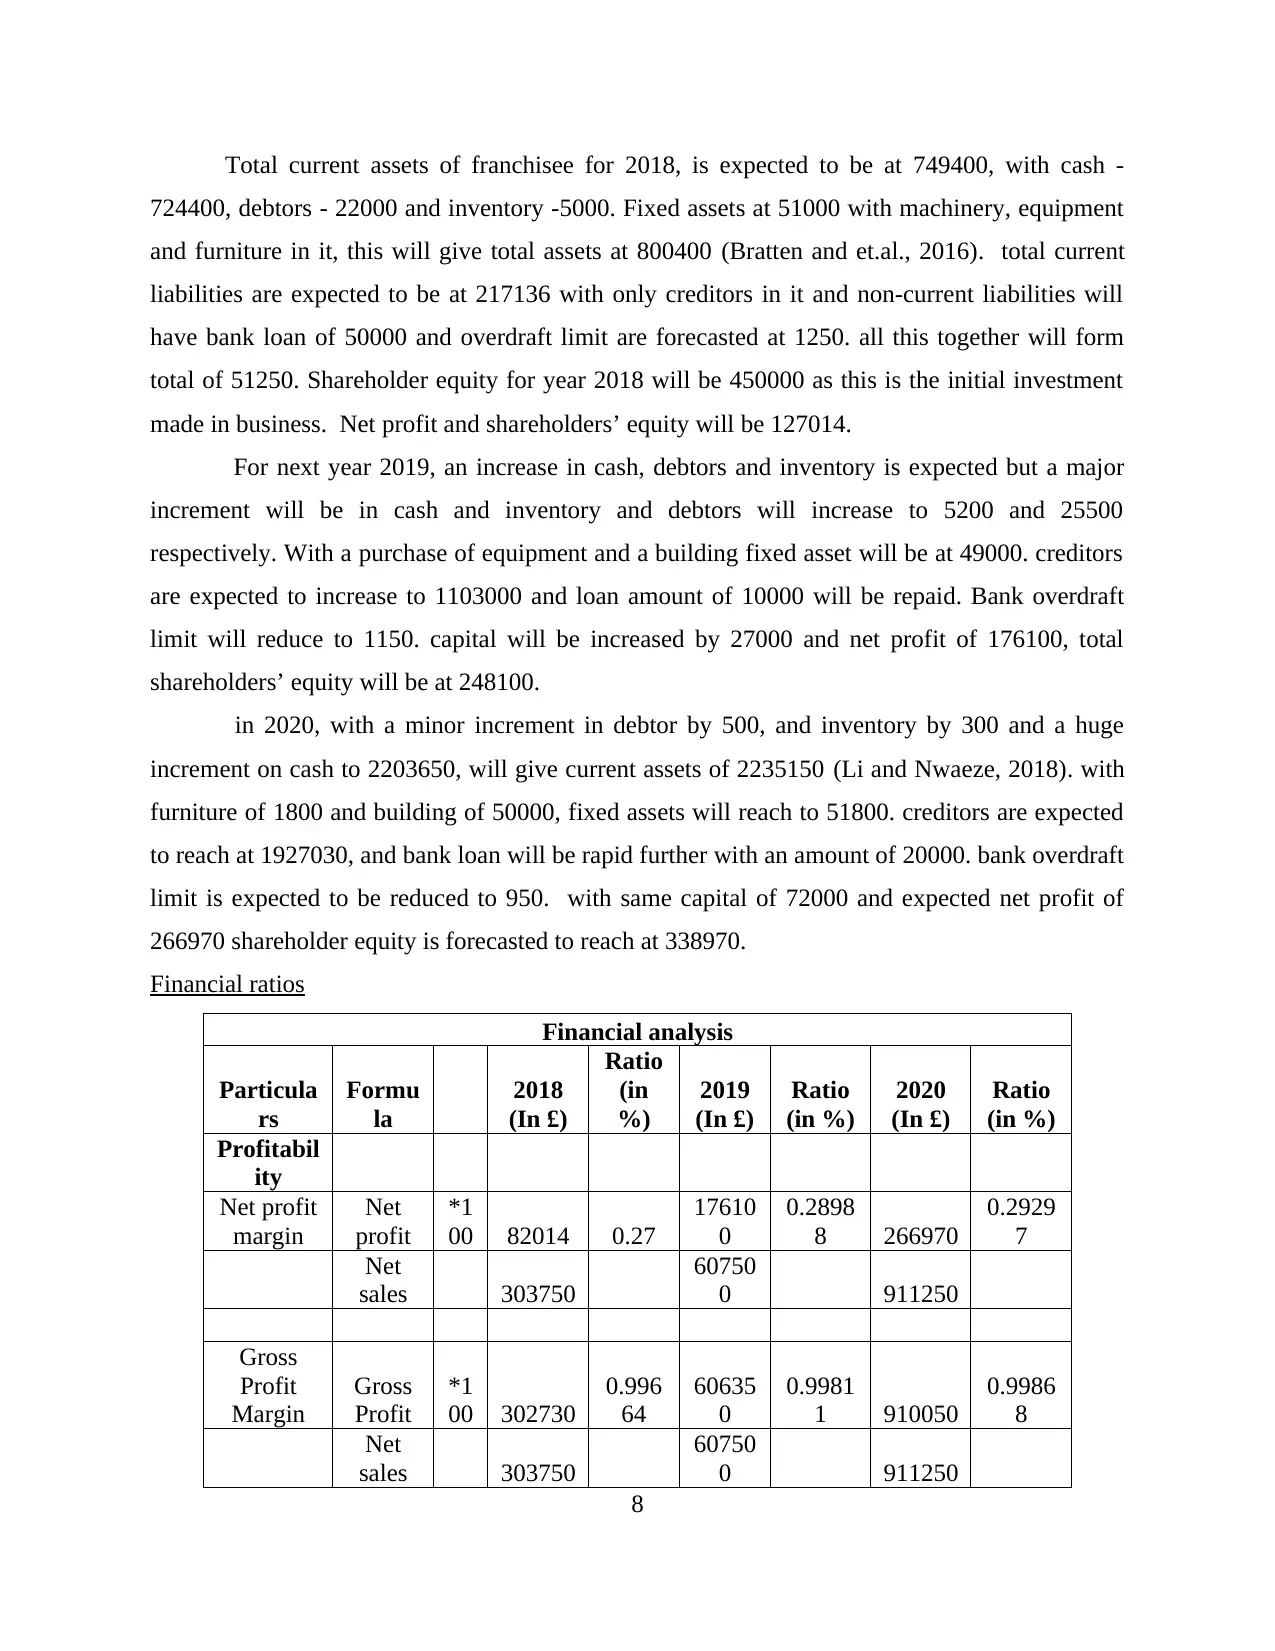
Profitability ratios:
To analyse the profitability of organisation with the motive of making payments to the
dividends to the shareholders of the firm. The net profit has been analysed on the estimated data
base for 27% in 2018, 28% in 2019 and 29% in 2020. Similarly, in analysing the Gross profit of
the organisation which insists the outcomes as 99% in 2018, 99% in 2019 and 99% in 2020.
However, the gross profit of McDonald’s is being near 100%. In analysing the return on capital
employed which has been obtained as 175% in 2018, 40% in 2019 and 37% in 2020 (How to
Interpret a Financial Statement, 2018).
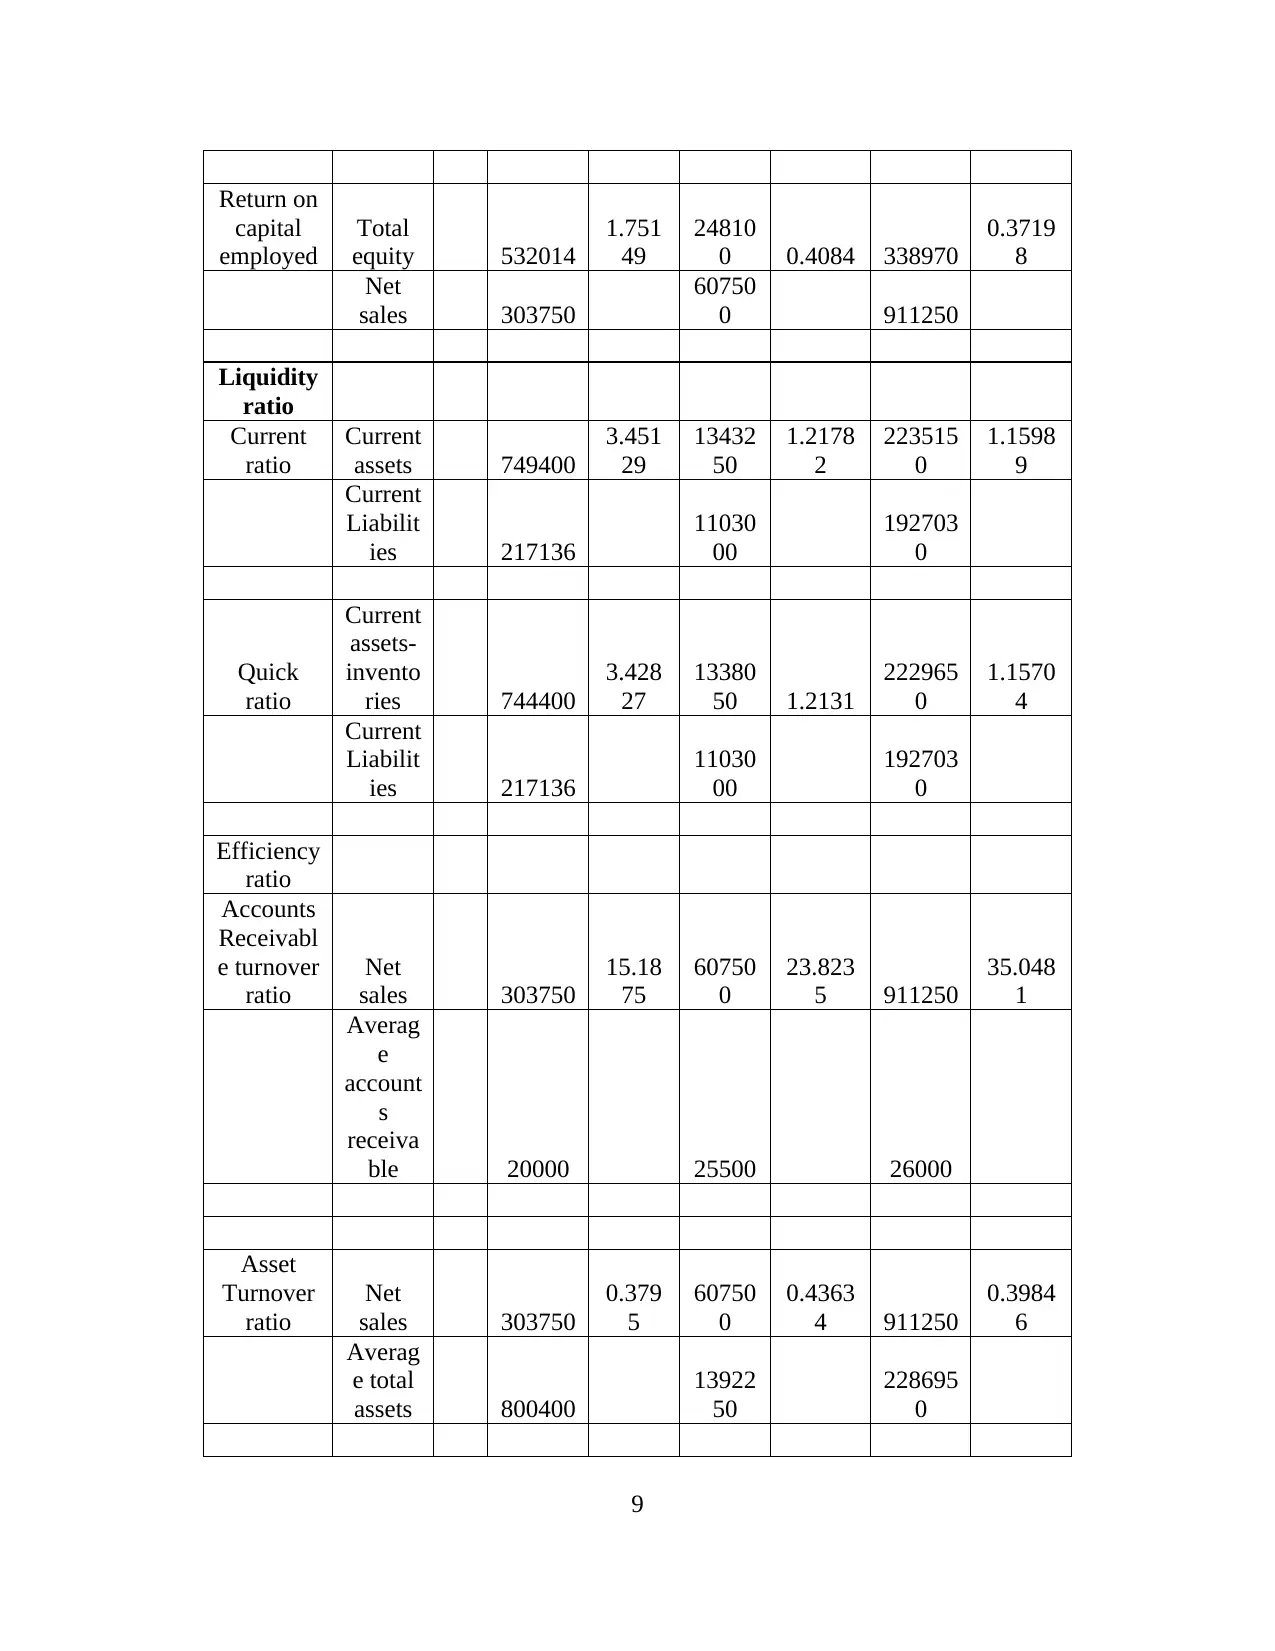
Liquidity ratio:
For analysing the liquidity of the business in respective years on which current ratio of firm
as 3.45% in 2018, 1.21% in 2019 and 1.15% in 2020. Similar, as per analysing the quick ratio of
entity which insist 3.42% in 2018, 1.21% in 2019 and 1.15% in 2020. Thus, as per considering
the outcomes of the McDonalds’s in the respective period on which it can be said that the firm
has sound liquidity and capabilities of meeting the short-term debts most prominent.
Efficiency ratio:
In relation with determining the efficiency of the organisation there has been ascertainment
of the various factors. Thus, the accounts receivable turnover ratio has been identified as 15.18%
in 2018, 23.82% in 2019 and 35.04% in 2020. As per analysing the asset turnover ratio which
10
Turnover
ratio
Cost of
goods
sold 1020 0.204 1150
0.2211
5 1200
0.2181
8
Averag
e
Invento
ries 5000 5200 5500
Interpretation: As per analysing the financial strength of the firm there has been
determination of various ratios such as profitability, liquidity and efficiency of the business.
However, there has been various transactions which have been analysed as per determining the
growth of McDonald’s. as per analysing the outcomes the following ratios has been considered
such as:
Profitability ratios:
To analyse the profitability of organisation with the motive of making payments to the
dividends to the shareholders of the firm. The net profit has been analysed on the estimated data
base for 27% in 2018, 28% in 2019 and 29% in 2020. Similarly, in analysing the Gross profit of
the organisation which insists the outcomes as 99% in 2018, 99% in 2019 and 99% in 2020.
However, the gross profit of McDonald’s is being near 100%. In analysing the return on capital
employed which has been obtained as 175% in 2018, 40% in 2019 and 37% in 2020 (How to
Interpret a Financial Statement, 2018).
Liquidity ratio:
For analysing the liquidity of the business in respective years on which current ratio of firm
as 3.45% in 2018, 1.21% in 2019 and 1.15% in 2020. Similar, as per analysing the quick ratio of
entity which insist 3.42% in 2018, 1.21% in 2019 and 1.15% in 2020. Thus, as per considering
the outcomes of the McDonalds’s in the respective period on which it can be said that the firm
has sound liquidity and capabilities of meeting the short-term debts most prominent.
Efficiency ratio:
In relation with determining the efficiency of the organisation there has been ascertainment
of the various factors. Thus, the accounts receivable turnover ratio has been identified as 15.18%
in 2018, 23.82% in 2019 and 35.04% in 2020. As per analysing the asset turnover ratio which
10
⊘ This is a preview!⊘
Do you want full access?
Subscribe today to unlock all pages.
Trusted by 1+ million students worldwide
1 out of 14
Related Documents


Your All-in-One AI-Powered Toolkit for Academic Success.
+13062052269
info@desklib.com
Available 24*7 on WhatsApp / Email
![[object Object]](/_next/static/media/star-bottom.7253800d.svg)
Unlock your academic potential
Copyright © 2020–2026 A2Z Services. All Rights Reserved. Developed and managed by ZUCOL.